Loading subject page…

- Analytical Chemistry
- Complexometric Titration, Precipitation Titration, and Gravimetry
- Complexometric EDTA Titration Curves
Micro-course: Complexometric Titration, Precipitation Titration, and Gravimetry
72,636 views
Learn key concepts and earn your certificate.









Complexometric EDTA Titration Curves

00:00
01:20
Video Summary: What are Complexometric Edta Titration Curves
Ever wondered how environmental scientists detect lead contamination in drinking water supplies across cities like Flint, Michigan? EDTA titration curves provide the analytical foundation for measuring metal ion concentrations with precision. These specialized plots track how metal ion concentration changes as EDTA solution is added, revealing critical information about complex formation and equivalence points that's essential for water quality testing. Watch the full video on JoVE Coach to master this concept with expert-led visuals and step-by-step explanations.
- Understand what are complexometric EDTA titration curves and how they graphically represent the relationship between metal ion concentration and EDTA volume
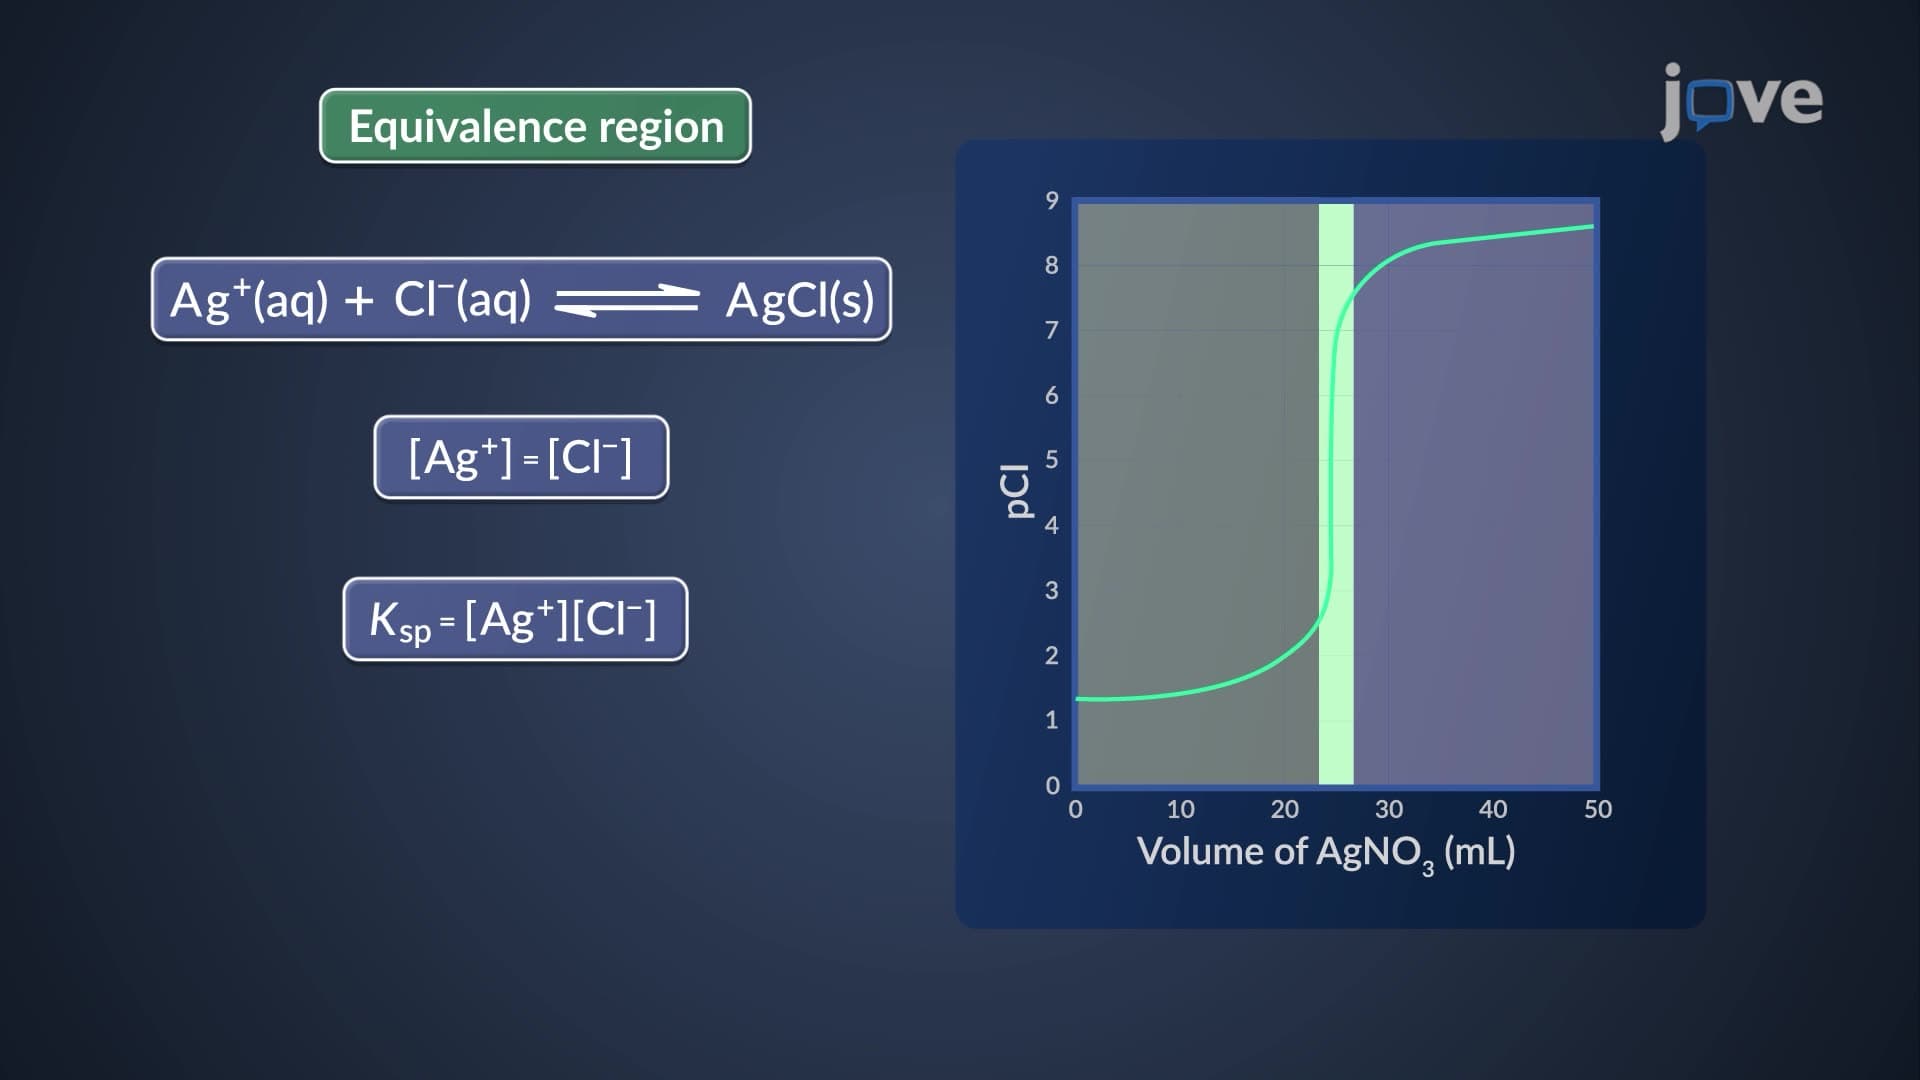
- Identify the three distinct regions of an EDTA titration curve: before equivalence point (excess metal), at equivalence point (stoichiometric reaction), and after equivalence point (excess EDTA)
- Analyze how conditional formation constants determine the sharpness of the equivalence point break in complexometric titrations
- Compare titration curve shapes for different metal ions like calcium and strontium to predict analytical precision
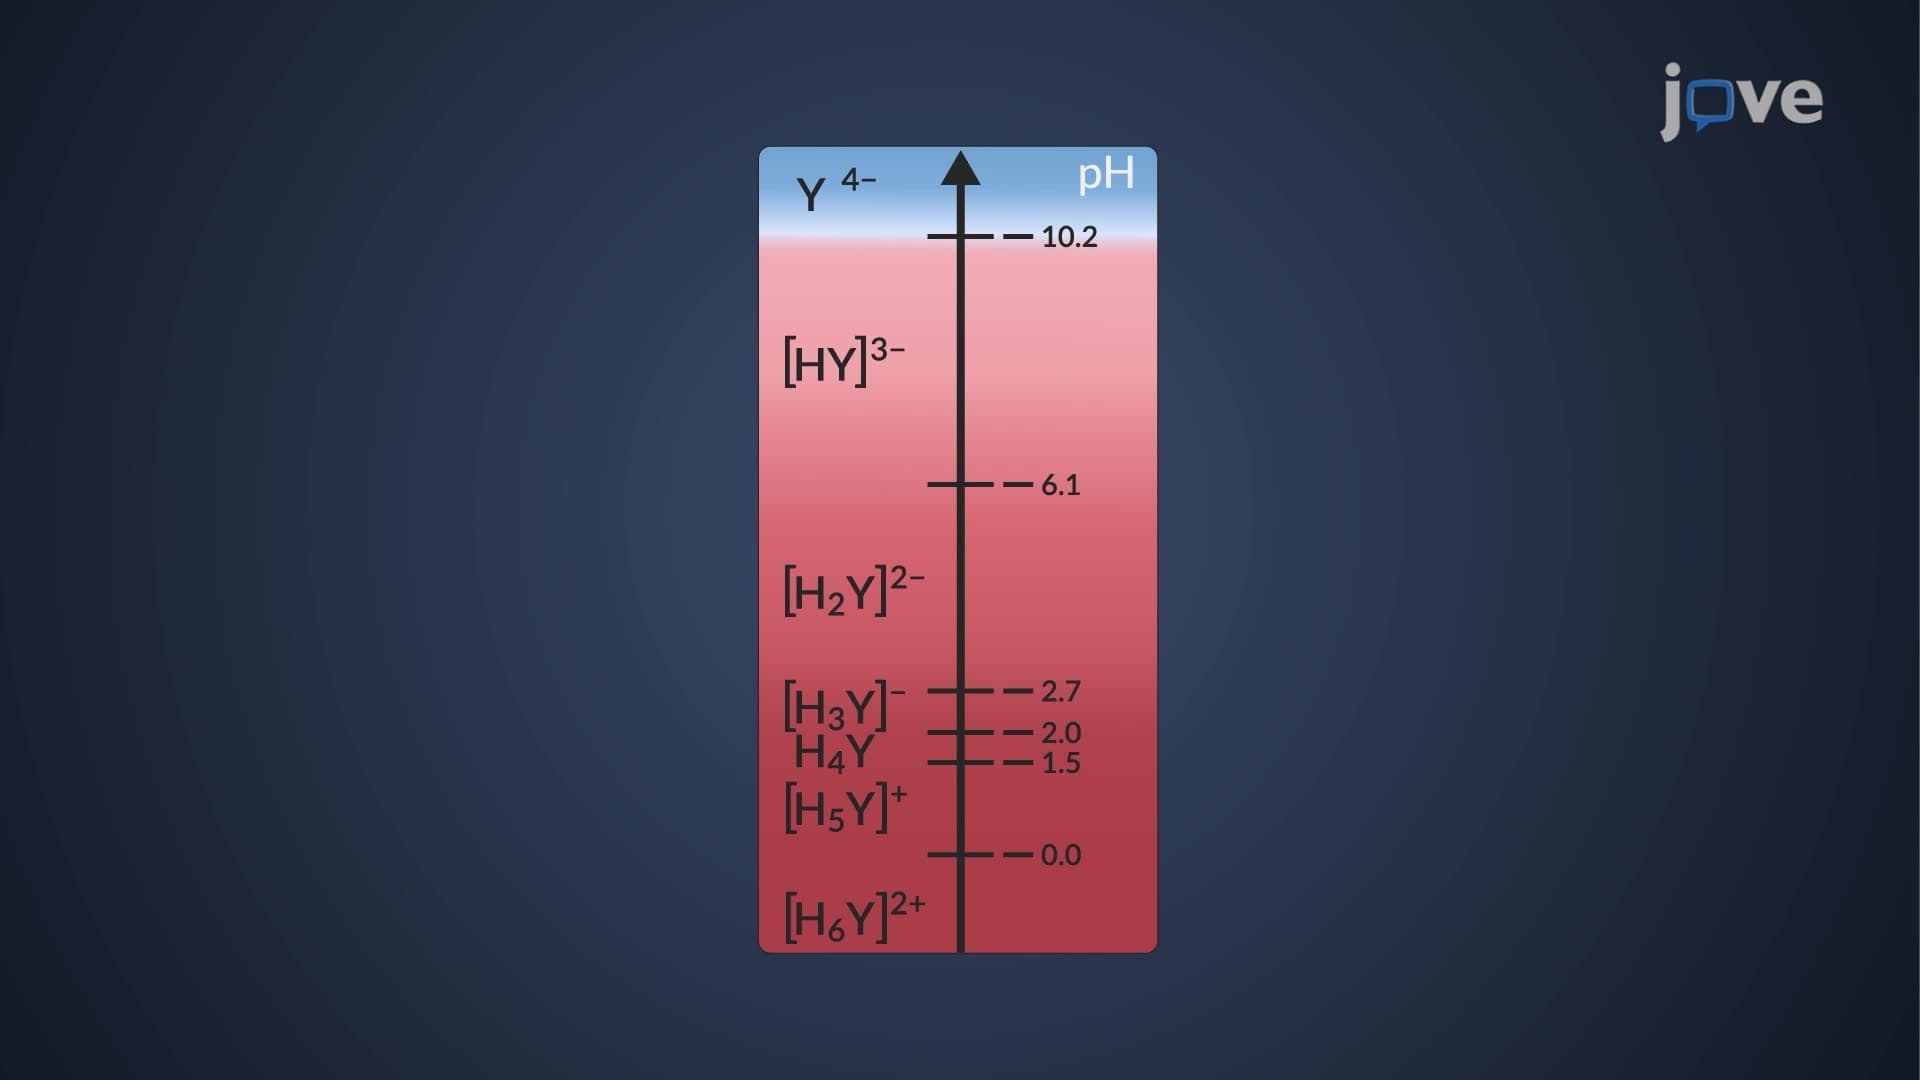
- Evaluate the effect of pH on EDTA complex formation and resulting curve characteristics
- Apply knowledge of pM calculations using conditional formation constants for post-equivalence point regions
- Recognize the practical significance of sharp breaks for accurate endpoint detection in quantitative analysis
- Explore how curve shape influences indicator selection and instrumental detection methods
Understanding What are Complexometric EDTA Titration Curves
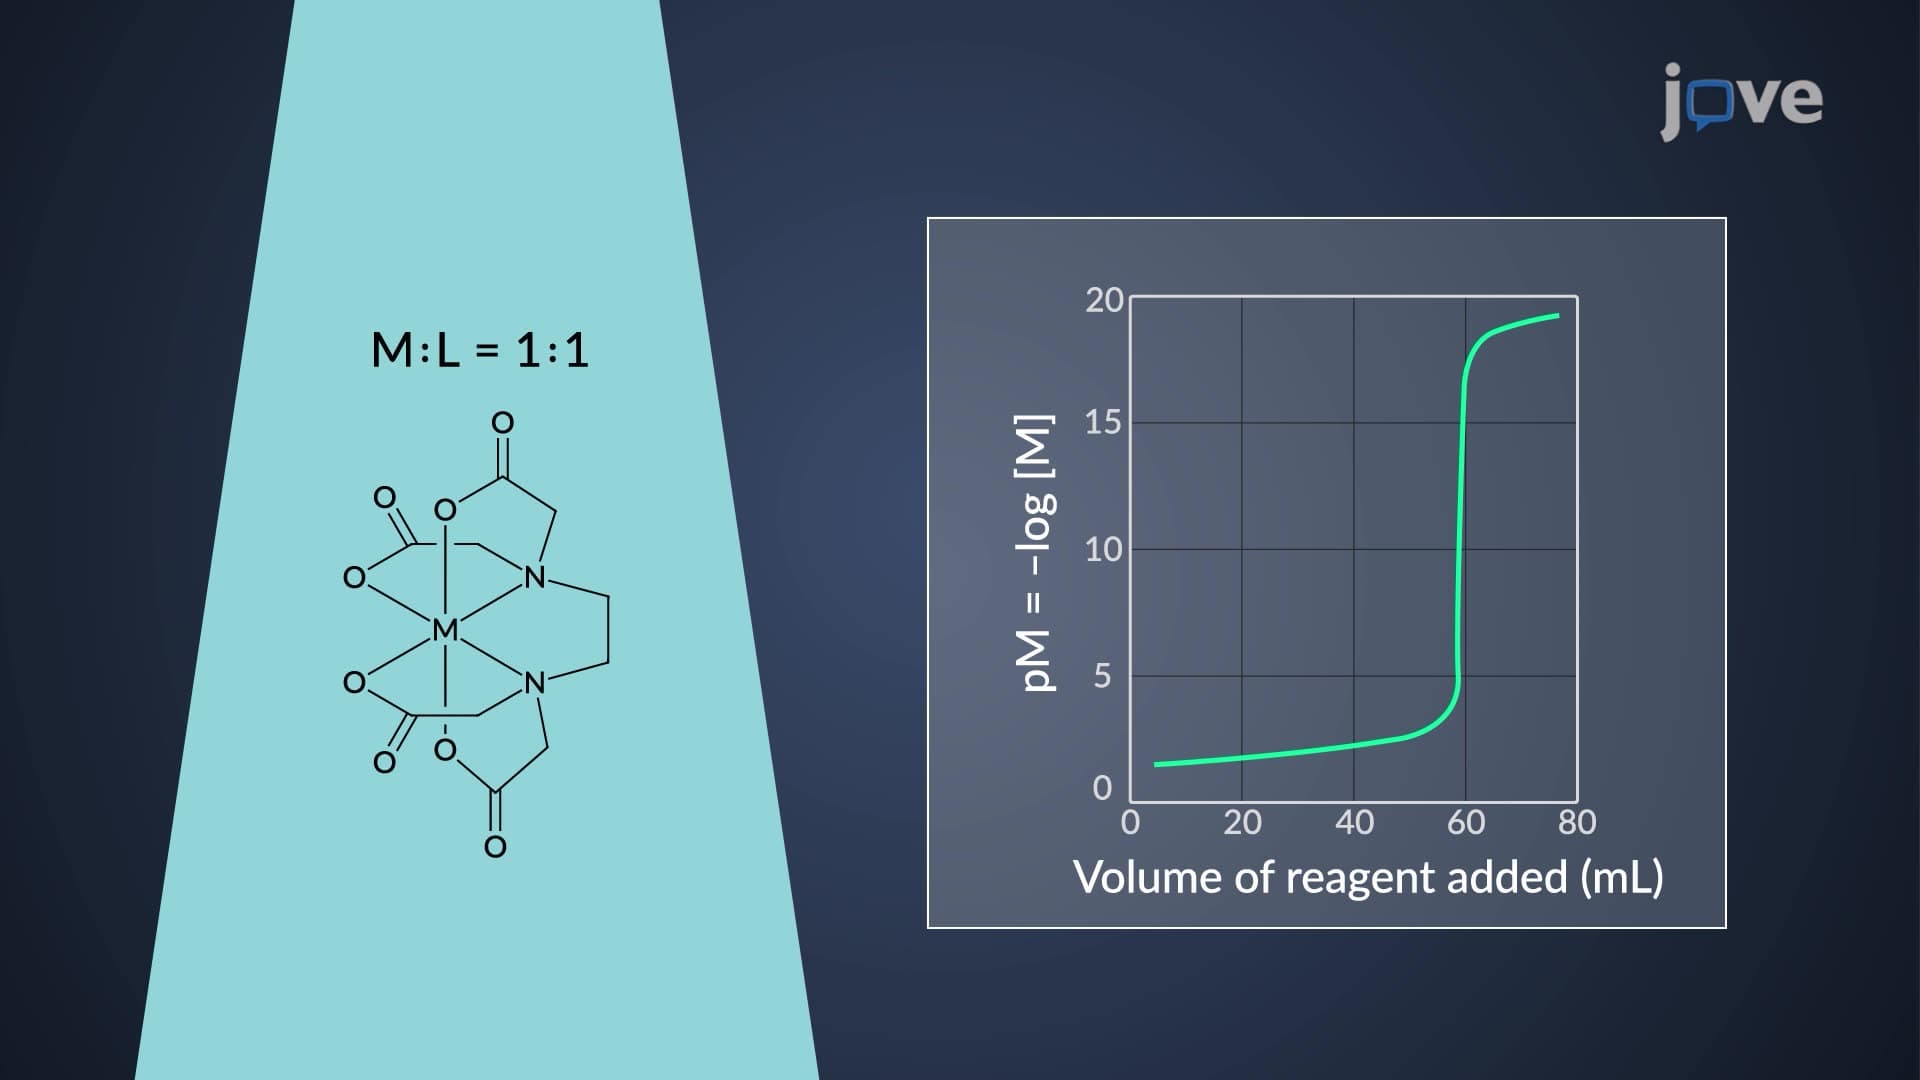
Complexometric EDTA titration curves are specialized analytical plots that map the logarithmic metal ion concentration (pM) against the volume of EDTA titrant added. Unlike simple acid-base titrations, these curves reveal the intricate dance between metal ions and the powerful chelating agent EDTA (ethylenediaminetetraacetic acid). The resulting S-shaped curve provides crucial information about complex formation equilibria and serves as the foundation for quantitative metal analysis in fields ranging from clinical chemistry to environmental monitoring.
Anatomy of the Titration Curve: Three Critical Regions
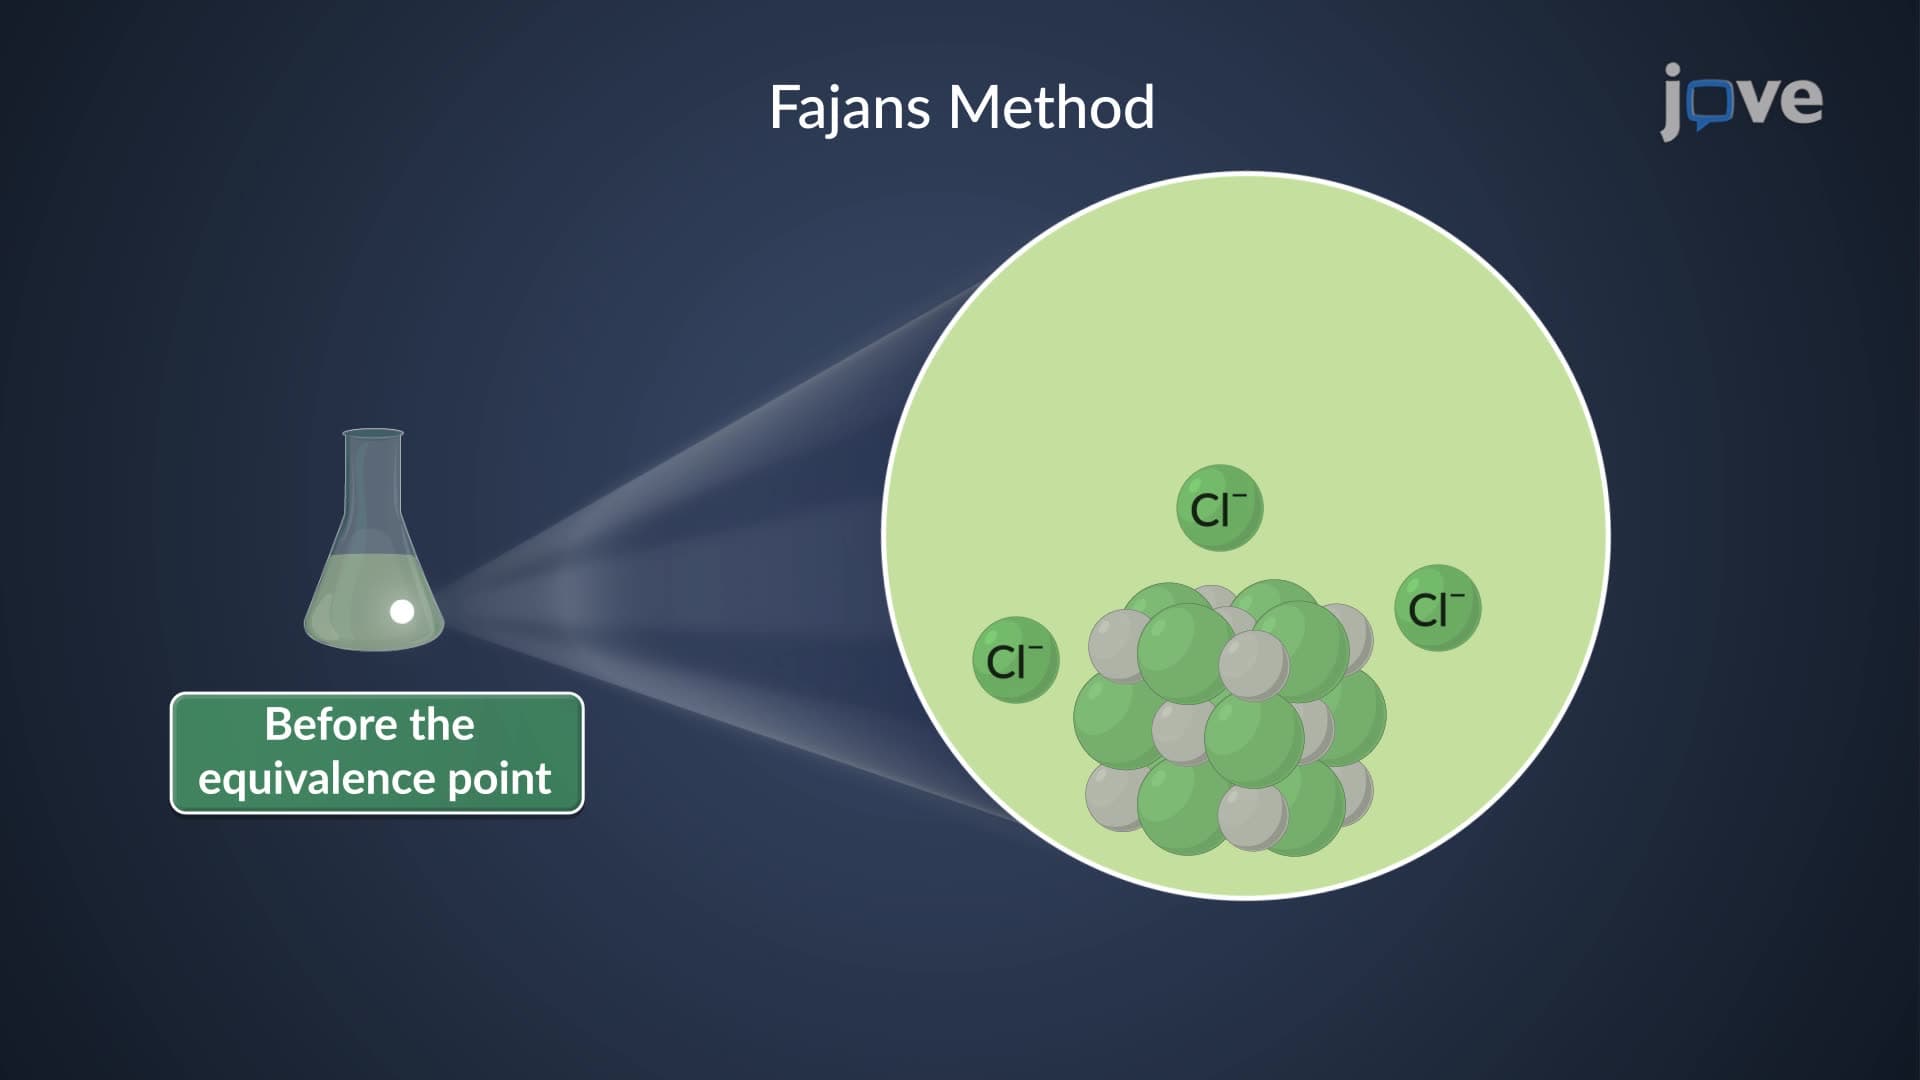
The EDTA titration curve divides into three distinct regions, each governed by different chemical principles. Before the equivalence point, free metal ions dominate the solution, creating a gradual decline in pM values. The dramatic inflection occurs at the equivalence point, where stoichiometric amounts of metal and EDTA have reacted. Beyond this point, excess EDTA controls the equilibrium, and the free metal ion concentration plummets to extremely low levels calculated using the conditional formation constant (K'f).
For students preparing for AP Chemistry or college analytical chemistry courses, understanding this three-region behavior is essential for predicting titration outcomes and selecting appropriate detection methods.
Conditional Formation Constants and Curve Sharpness
The sharpness of the equivalence point break directly correlates with the magnitude of the conditional formation constant. Consider the titration of calcium (log K'f ≈ 11 at pH 10) versus magnesium (log K'f ≈ 9 at pH 10) with EDTA. Calcium produces a dramatically sharper break, making endpoint detection more precise and reducing analytical uncertainty. This principle guides analytical chemists in choosing optimal conditions for trace metal analysis in drinking water samples or pharmaceutical quality control.
pH Effects on Complexometric Titration Curve Shape
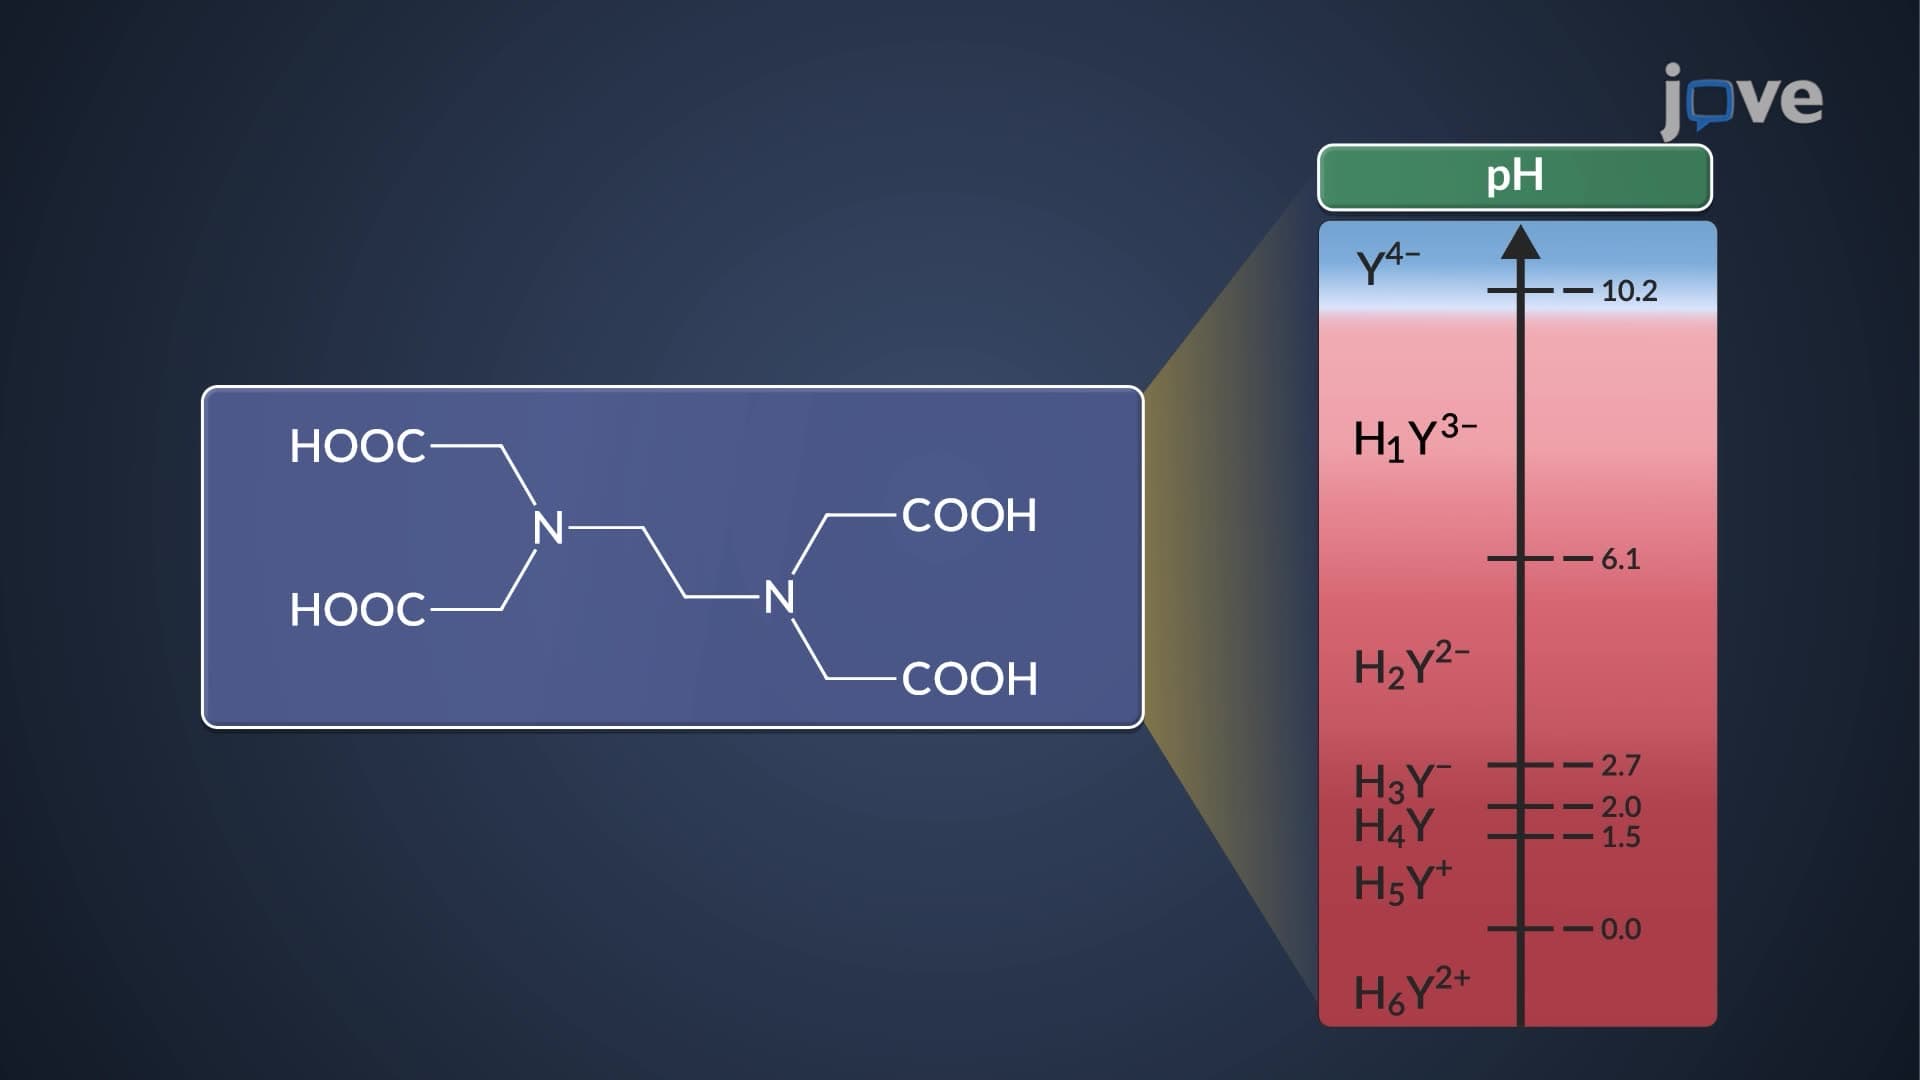
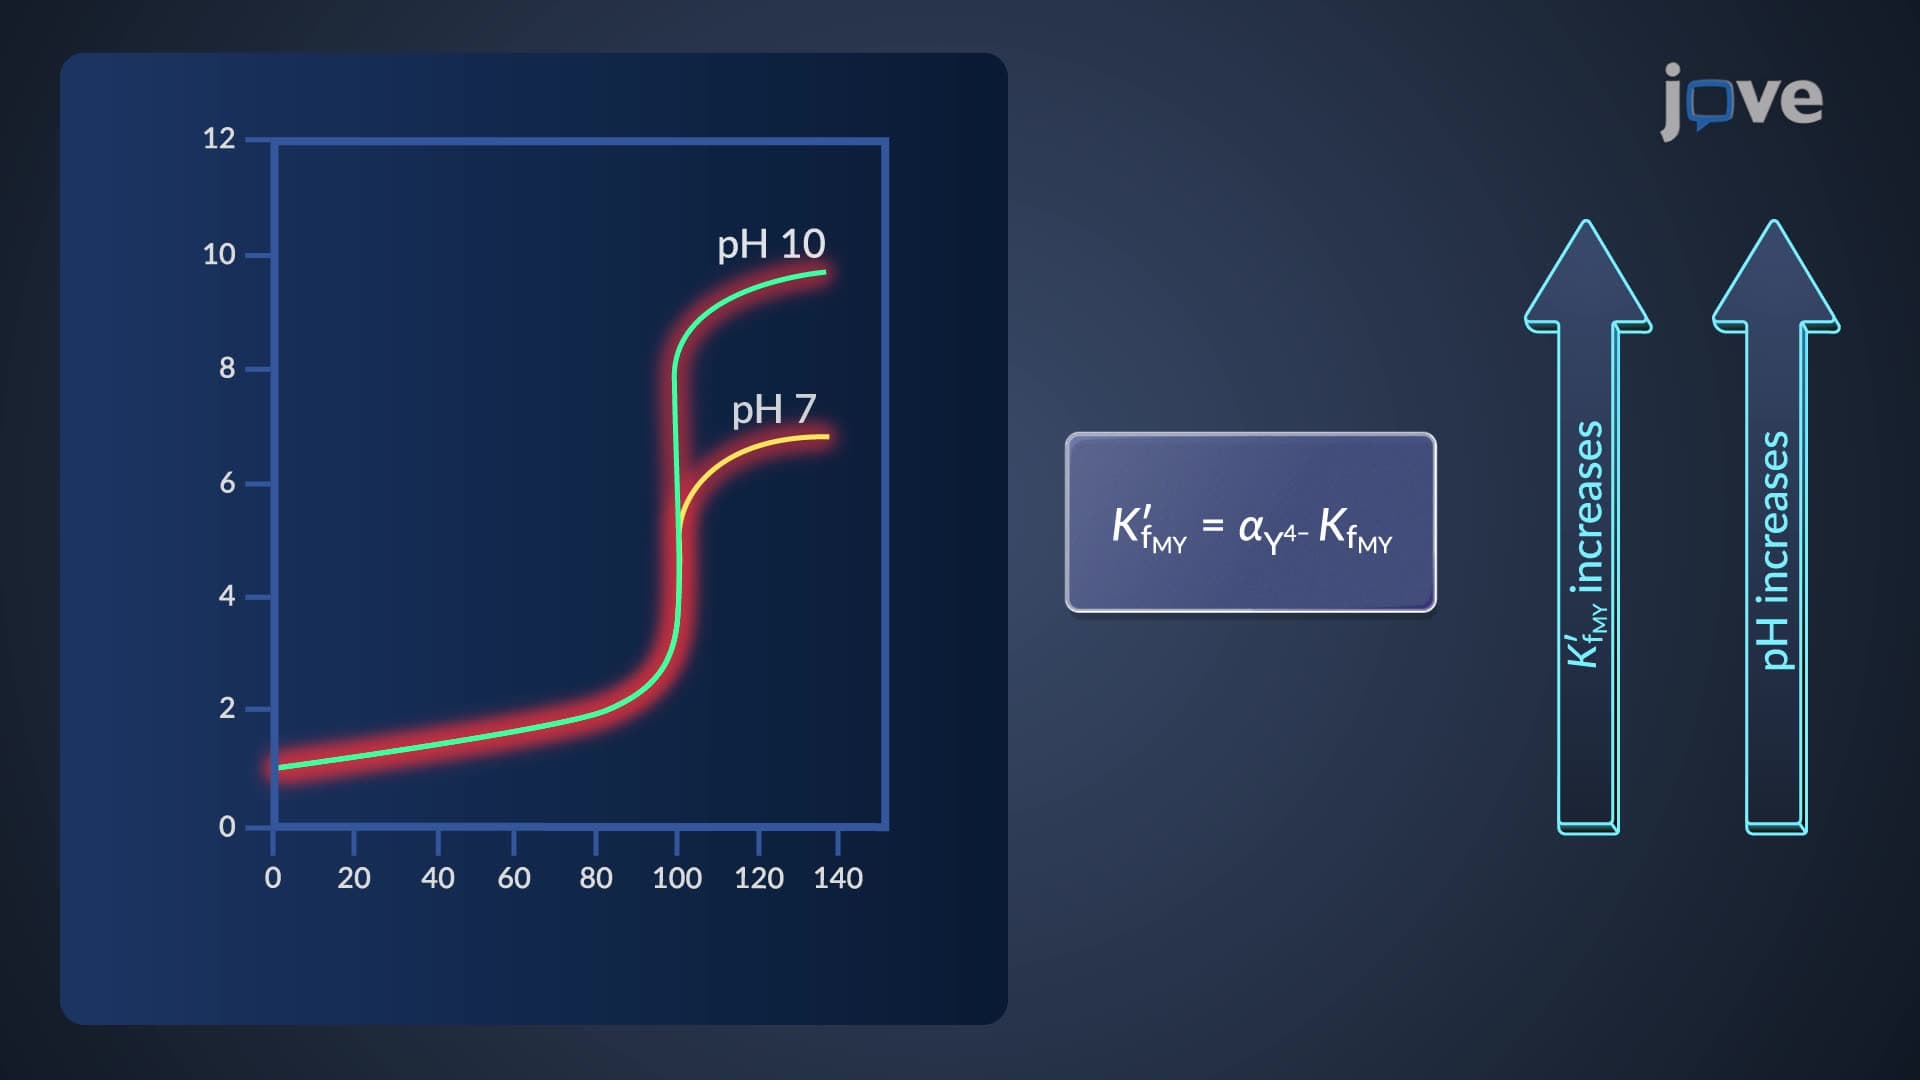
Perhaps the most fascinating aspect of EDTA titrations is their pH dependence. At lower pH values, protonation of EDTA reduces its complexing ability, resulting in smaller conditional formation constants and less sharp breaks. Clinical laboratories analyzing serum calcium levels must carefully control pH to ensure accurate results. At pH 10, using an ammonia buffer system, the calcium-EDTA complex formation becomes highly favorable, producing the sharp endpoint necessary for precise medical diagnostics that could influence patient treatment decisions.
Frequently Asked Questions
EDTA titration curves plot the negative logarithm of free metal ion concentration (pM) versus EDTA volume added, creating characteristic S-shaped curves. Unlike acid-base titrations that track pH changes, these curves monitor complex formation between metal ions and the chelating agent EDTA. The resulting plots reveal three distinct regions and provide quantitative information about metal-ligand binding strength.
MCAT questions often focus on interpreting curve shapes and relating conditional formation constants to endpoint sharpness. AP Chemistry may test your ability to identify equivalence points and explain pH effects on complex formation. College analytical chemistry courses extensively cover pM calculations and curve construction, making this a frequent midterm topic.
Larger conditional formation constants produce sharper equivalence point breaks because they indicate stronger metal-EDTA complex formation. This enhanced binding affinity causes a more dramatic decrease in free metal ion concentration at the equivalence point. pH also plays a crucial role, with higher pH values generally promoting sharper breaks for most metal ions.
Environmental laboratories use EDTA titrations to measure water hardness caused by calcium and magnesium ions in municipal supplies. The EPA requires regular monitoring of lead and copper levels in drinking water, often using complexometric methods. Food industries employ these techniques to ensure proper mineral content in fortified products and to detect heavy metal contamination.
The basic concepts require only logarithms and equilibrium expressions taught in general chemistry. While professional curve construction involves complex equilibrium calculations, students can grasp the fundamental principles using simplified approaches. Focus on understanding the three curve regions and factors affecting sharpness rather than detailed mathematical derivations.
Practice identifying the three curve regions and predicting relative curve shapes based on formation constants and pH conditions. Create comparison charts showing how different metals behave under identical conditions. Work through numerical problems calculating pM values at various points, especially post-equivalence calculations using conditional formation constants.
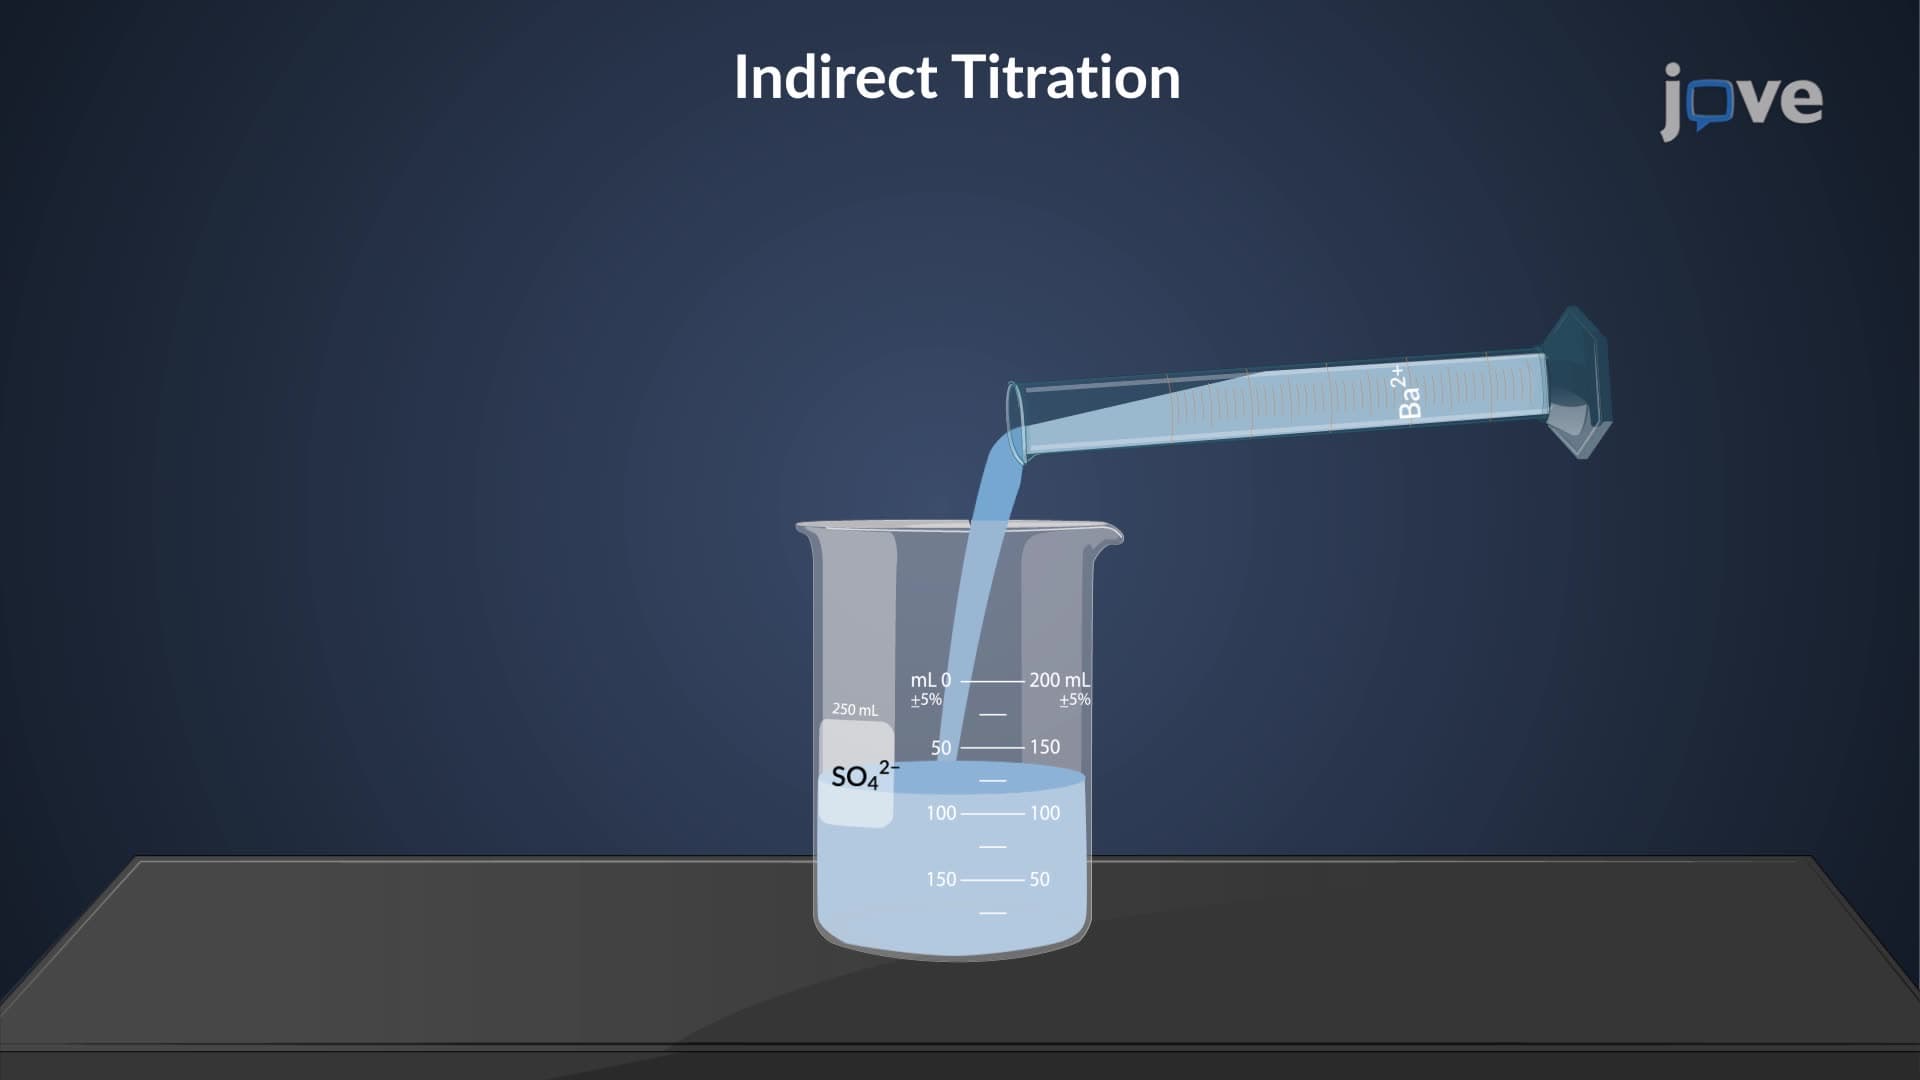
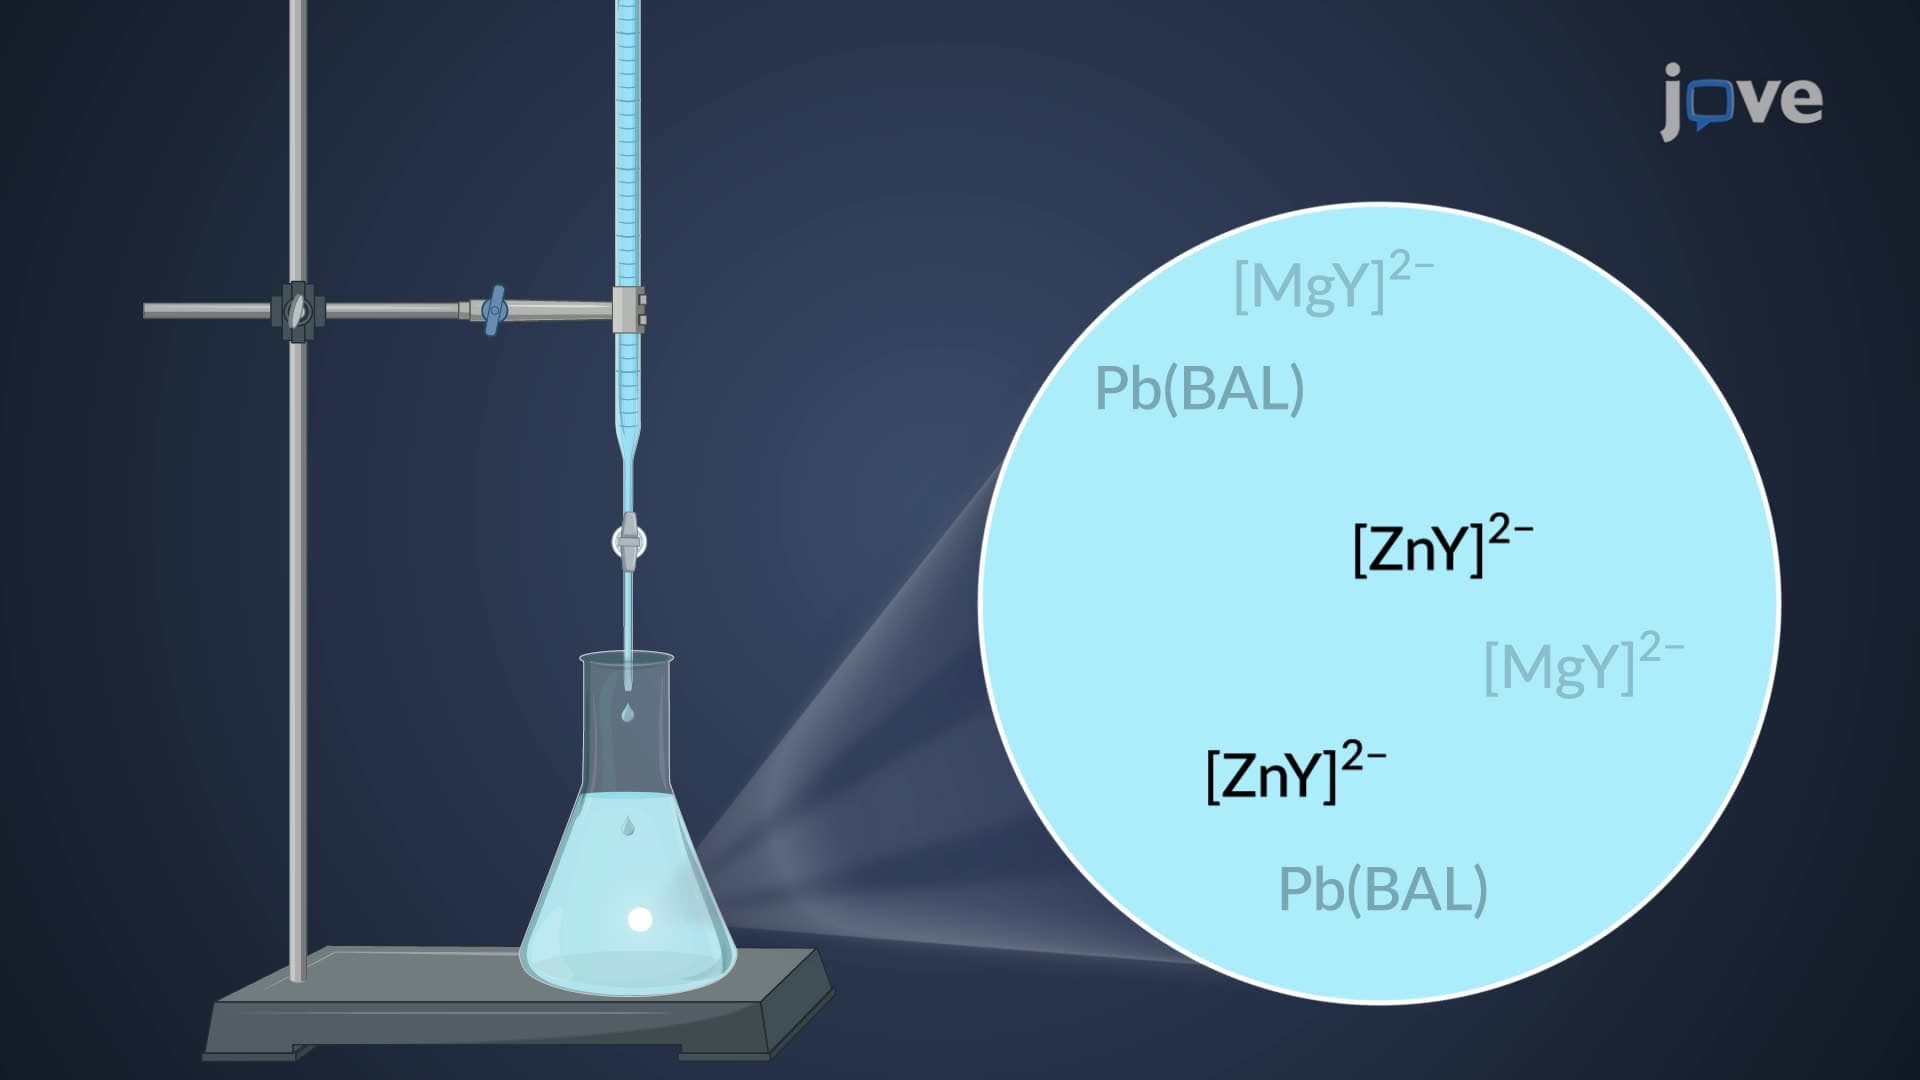
Explore other complexometric indicators like Eriochrome Black T and their color-change mechanisms. Study masking and demasking agents used in selective metal analysis. Advanced topics include back-titration methods and instrumental techniques like atomic absorption spectroscopy that complement complexometric analysis in modern analytical laboratories.
Related Micro-courses

14 Concepts

13 Concepts