Loading subject page…
Micro-course: Measure of Central Tendency
154,401 views
Learn key concepts and earn your certificate.






Skewness

00:00
01:06
Video Summary: What Is Skewness
Did you know that stock market crashes often follow a specific mathematical pattern? Skewness reveals how data deviates from perfect symmetry, helping analysts predict whether investments will deliver frequent small gains with occasional massive losses-or the reverse. For example, tech stock returns during the 2008 financial crisis showed extreme positive skewness, warning investors of impending volatility. Understanding what is skewness empowers students to interpret data distributions in statistics, economics, and finance courses. Watch the full video on JoVE Coach to master this concept with expert-led visuals and step-by-step explanations.
- Understand what is skewness and how it measures the asymmetry of data distributions compared to normal distributions
- Identify the relationship between mean, median, and mode in skewed versus symmetrical distributions
- Analyze how outliers create skewness by pulling the distribution tail in one direction
- Compare positive (right) skewness with negative (left) skewness using real-world data examples
- Evaluate investment risk using skewness patterns in financial return distributions
- Apply skewness concepts to interpret histograms and bell curves in statistics courses
- Recognize skewness indicators in AP Statistics problems and college-level data analysis
- Explore how skewness affects decision-making in business, healthcare, and economic forecasting
Understanding What is Skewness in Data Analysis
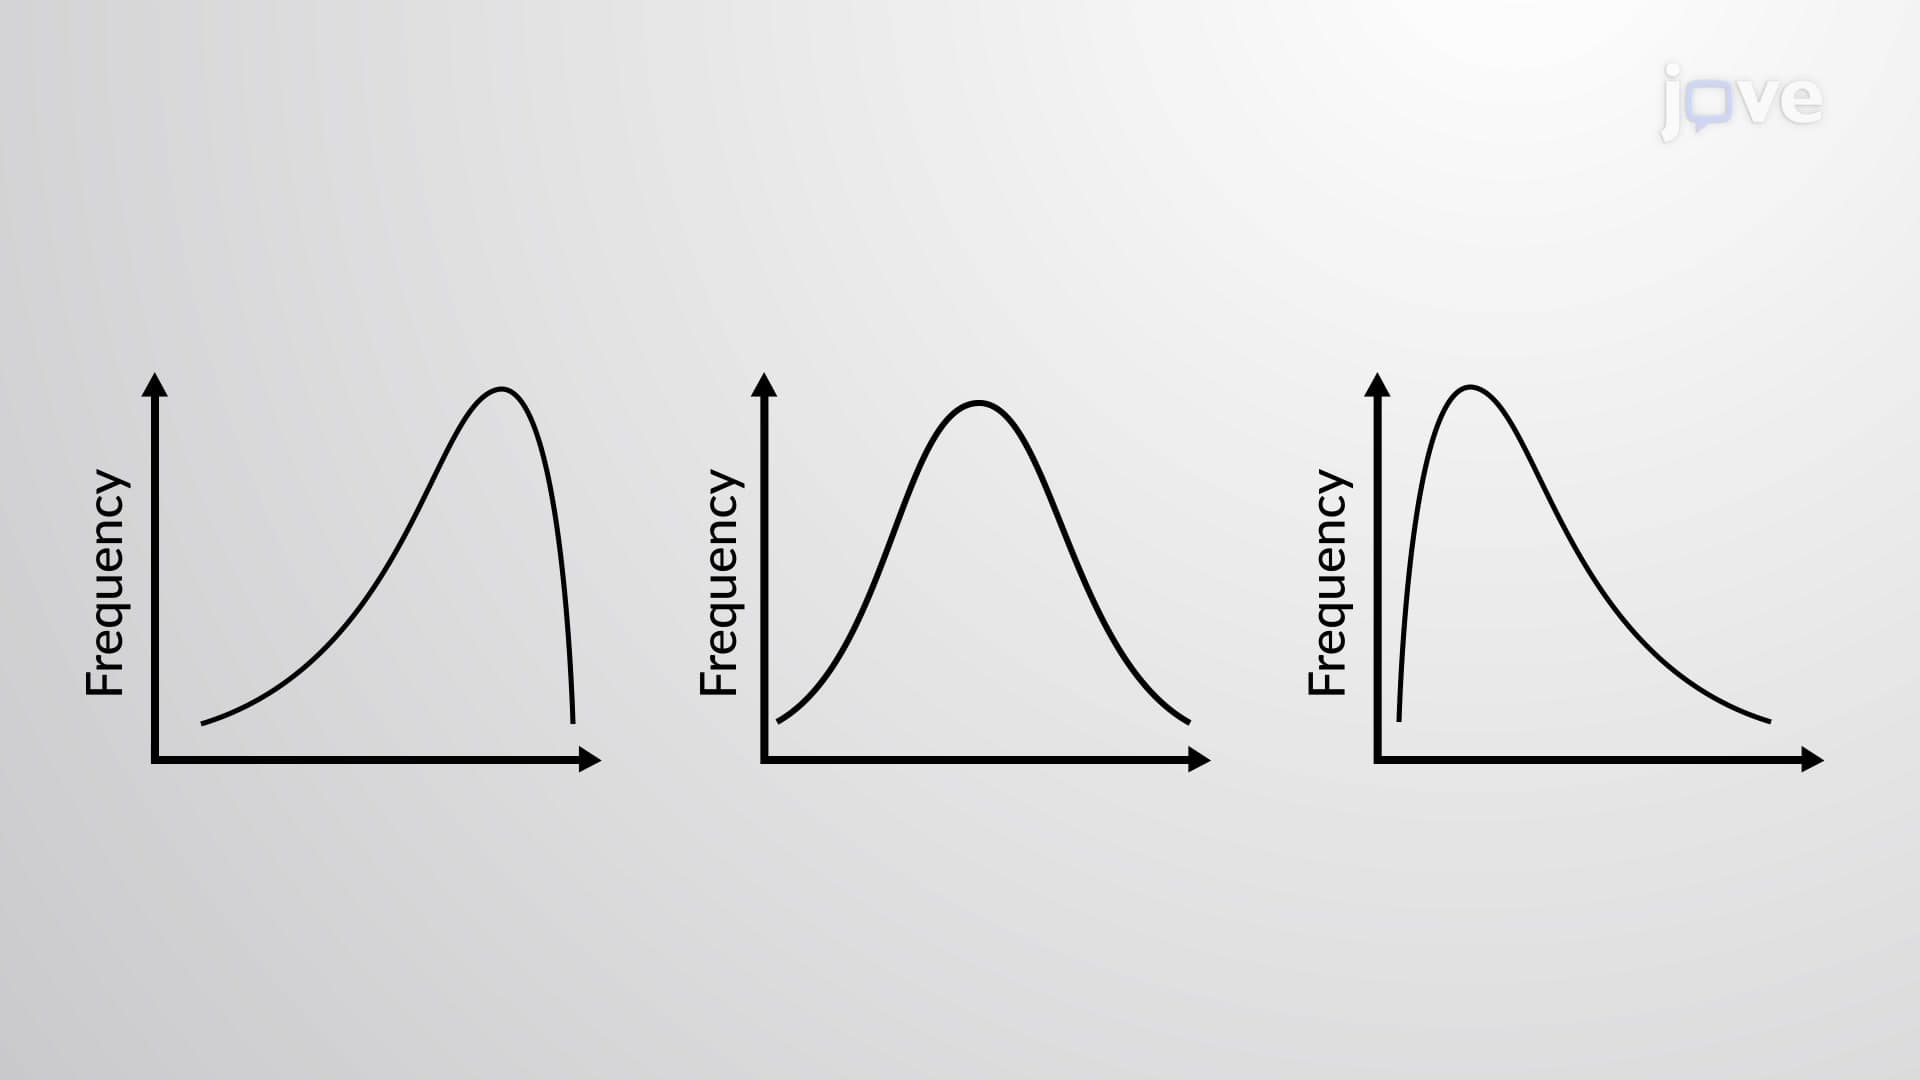
Skewness fundamentally measures how much a dataset deviates from perfect symmetry. In a perfectly normal distribution-the classic bell curve-data points distribute equally on both sides of the center. However, real-world data rarely achieves this ideal symmetry. When distributions become lopsided, skewness quantifies this asymmetry using mathematical precision.
Types of Skewness and Their Characteristics
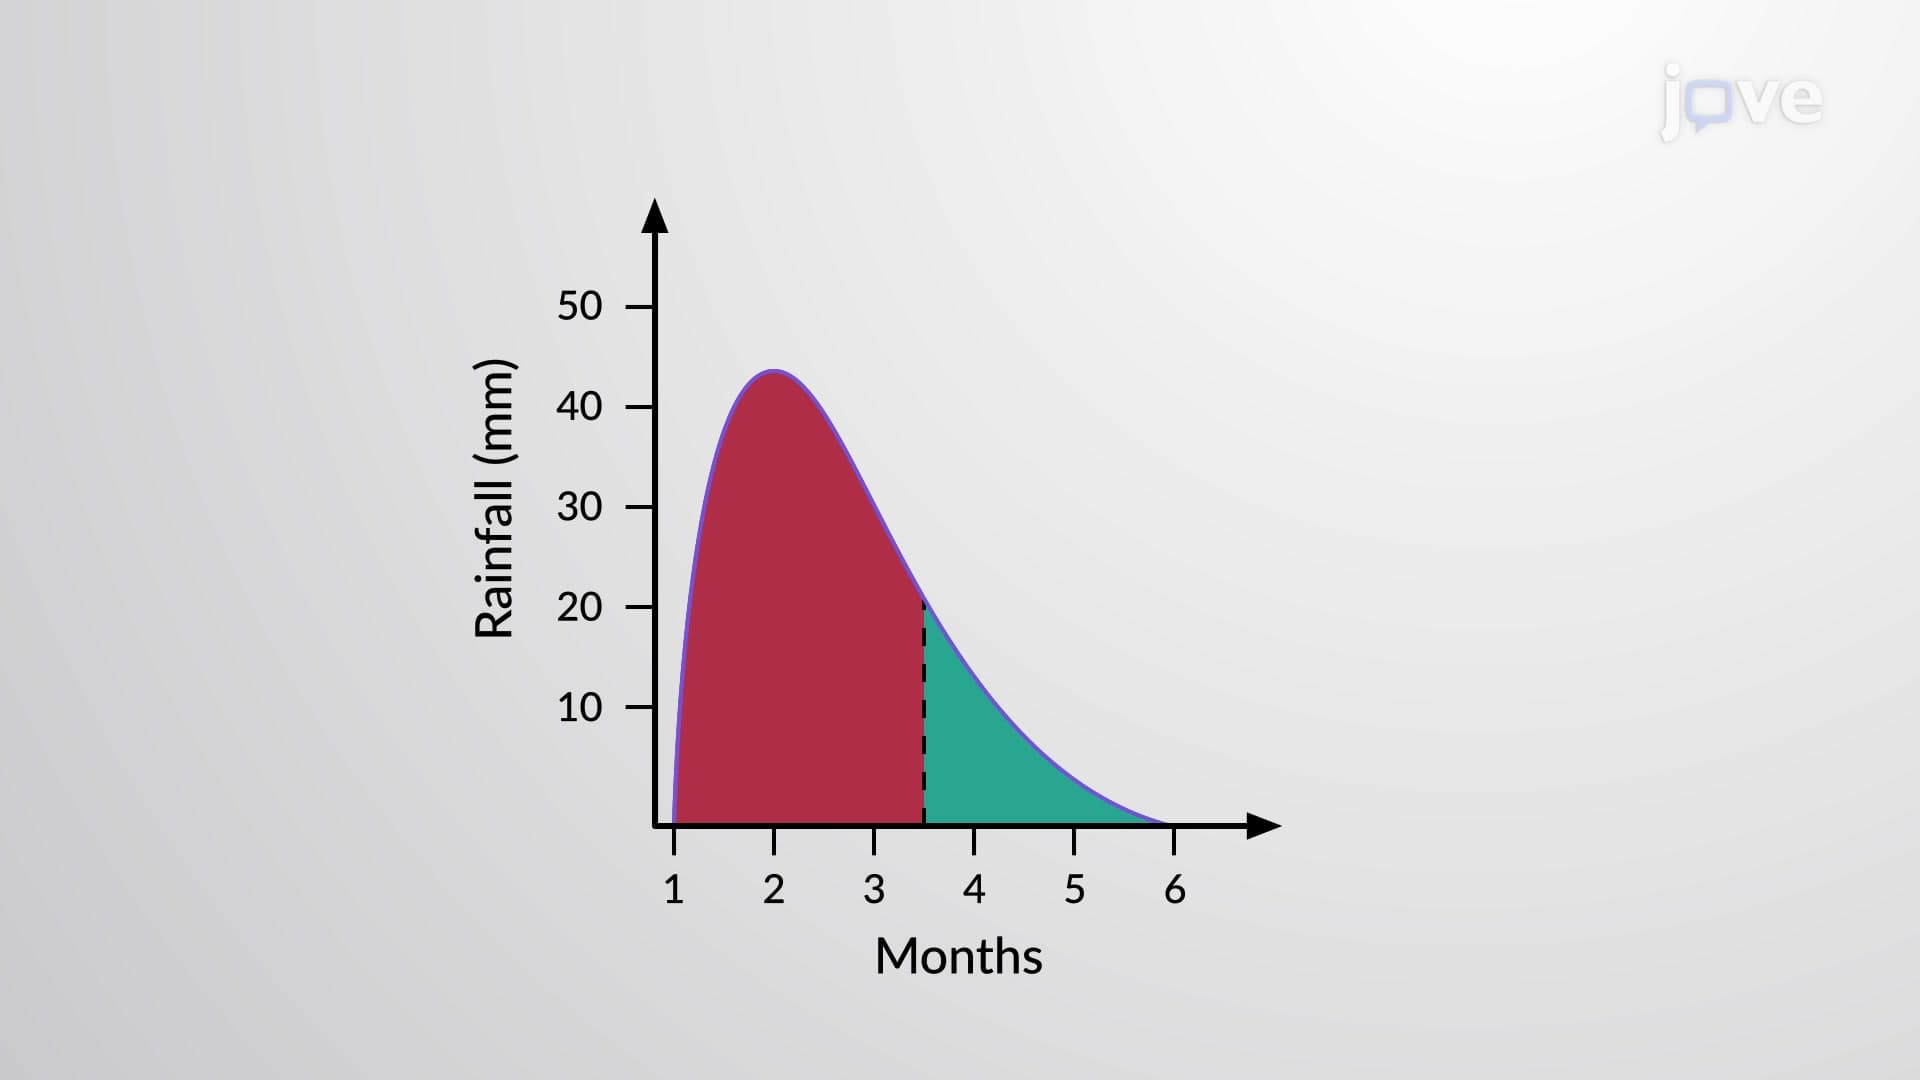
Positive skewness (right-skewed distributions) occurs when the distribution's tail extends toward higher values. In these cases, the mean exceeds the median, which exceeds the mode. Consider household income data across American families: most families earn moderate incomes, but a small percentage of extremely wealthy households creates a long right tail. This skewness overview explains why median income often provides better insights than mean income for policy discussions.
Negative skewness (left-skewed distributions) shows the opposite pattern, with the tail extending toward lower values. Here, the mode exceeds the median, which exceeds the mean. Test scores on particularly easy exams demonstrate this pattern-most students score high, with fewer achieving lower scores.
Practical Applications in Academic and Professional Settings
Understanding skewness basics proves essential for AP Statistics students analyzing real datasets. College entrance exam scores, stock market returns, and scientific measurements all exhibit various skewness patterns. In healthcare research, drug effectiveness studies often show skewed distributions, affecting how medical professionals interpret clinical trial results.
Skewness study guide materials emphasize its importance in investment analysis. Portfolio managers examine return skewness to assess risk profiles. Investments with negative skewness might deliver steady returns but carry catastrophic loss potential-think of mortgage-backed securities before 2008. Conversely, venture capital investments often show positive skewness, with many small losses but occasional massive gains.
Measuring and Interpreting Skewness Values
The skewness concept extends beyond visual identification to precise mathematical measurement. Statisticians calculate skewness coefficients ranging from negative to positive values. Zero indicates perfect symmetry, while values between -0.5 and 0.5 suggest approximate normality. Values beyond ±1.0 indicate highly skewed distributions requiring specialized analytical approaches.
Understanding skewness becomes crucial when students encounter standardized tests like the MCAT or SAT, where data interpretation questions frequently appear. Recognizing skewness patterns helps identify appropriate statistical measures and avoid common analytical pitfalls.
Frequently Asked Questions
Skewness measures how asymmetrical data spreads around its center point, unlike normal distributions where data spreads symmetrically. In skewed distributions, the mean, median, and mode occupy different positions, while they align perfectly in normal distributions. This asymmetry indicates that outliers pull the distribution toward one direction.
AP Statistics frequently tests skewness through histogram interpretation and data analysis questions. Focus on identifying whether distributions lean left or right, explaining how outliers affect measures of central tendency, and selecting appropriate statistical measures. Practice distinguishing between mean and median as better central tendency indicators for different skew types.
Income distribution across US households shows strong positive skewness, with most families earning moderate wages while few earn extremely high incomes. Housing prices in cities like San Francisco demonstrate similar patterns. Conversely, student performance on easy standardized tests often creates negative skewness, with most scores clustering near the maximum.
No advanced mathematics is required for basic skewness understanding. High school algebra and basic statistics knowledge suffice for identifying skewed patterns and interpreting their practical implications. Focus on visual recognition and conceptual understanding rather than complex calculations initially.
Practice identifying skewness direction using histograms and box plots, memorize the relationship between mean, median, and mode in different skew types, and understand when to use median versus mean for skewed data. Create flashcards connecting real-world scenarios with their typical skewness patterns.
Skewness helps predict risk patterns in financial returns and business outcomes. Investors use skewness analysis to understand whether investments might produce frequent small gains with rare large losses, or vice versa. This information guides portfolio allocation and risk management strategies.
Progress to kurtosis (measuring distribution tail thickness), standard deviation calculations, and confidence intervals. These concepts build naturally on skewness understanding and frequently appear together in advanced statistics courses and standardized exams.
Many scientific measurements naturally exhibit skewness due to physical constraints or measurement limitations. Recognizing these patterns helps students choose appropriate analytical methods, avoid misinterpreting results, and design better experiments. This knowledge proves valuable in biology, chemistry, and physics laboratory courses.
Related Micro-courses
11 Concepts

9 Concepts

14 Concepts