Loading…
Loading video…
85,600 views

Did you know that when the CDC reports "65% of Americans support a health policy with a margin of error of ±3%," they're using confidence intervals to acknowledge uncertainty in their estimate? Confidence intervals provide a range of plausible values for population parameters, moving beyond single-point estimates to give researchers and decision-makers a more complete picture of statistical uncertainty. For example, a pharmaceutical company testing a new drug might report that 78-84% of patients show improvement, rather than claiming exactly 81% effectiveness. Watch the full video on JoVE Coach to master this concept with expert-led visuals and step-by-step explanations.
Confidence intervals address a fundamental limitation in statistics: point estimates alone don't capture the uncertainty inherent in sampling. When researchers survey 1,000 Americans about vaccine acceptance and find 72% support, this single number doesn't reveal how precise this estimate is. A confidence interval might show the true population support falls between 69% and 75%, providing crucial context for policy decisions.
The most common types of confidence intervals focus on different population parameters. Population proportion confidence intervals estimate percentages, like the proportion of students who pass the AP Statistics exam in a given year. Population mean confidence intervals estimate averages, such as the mean SAT score for students in a particular state. Both follow the same fundamental principle: sample statistic ± margin of error.
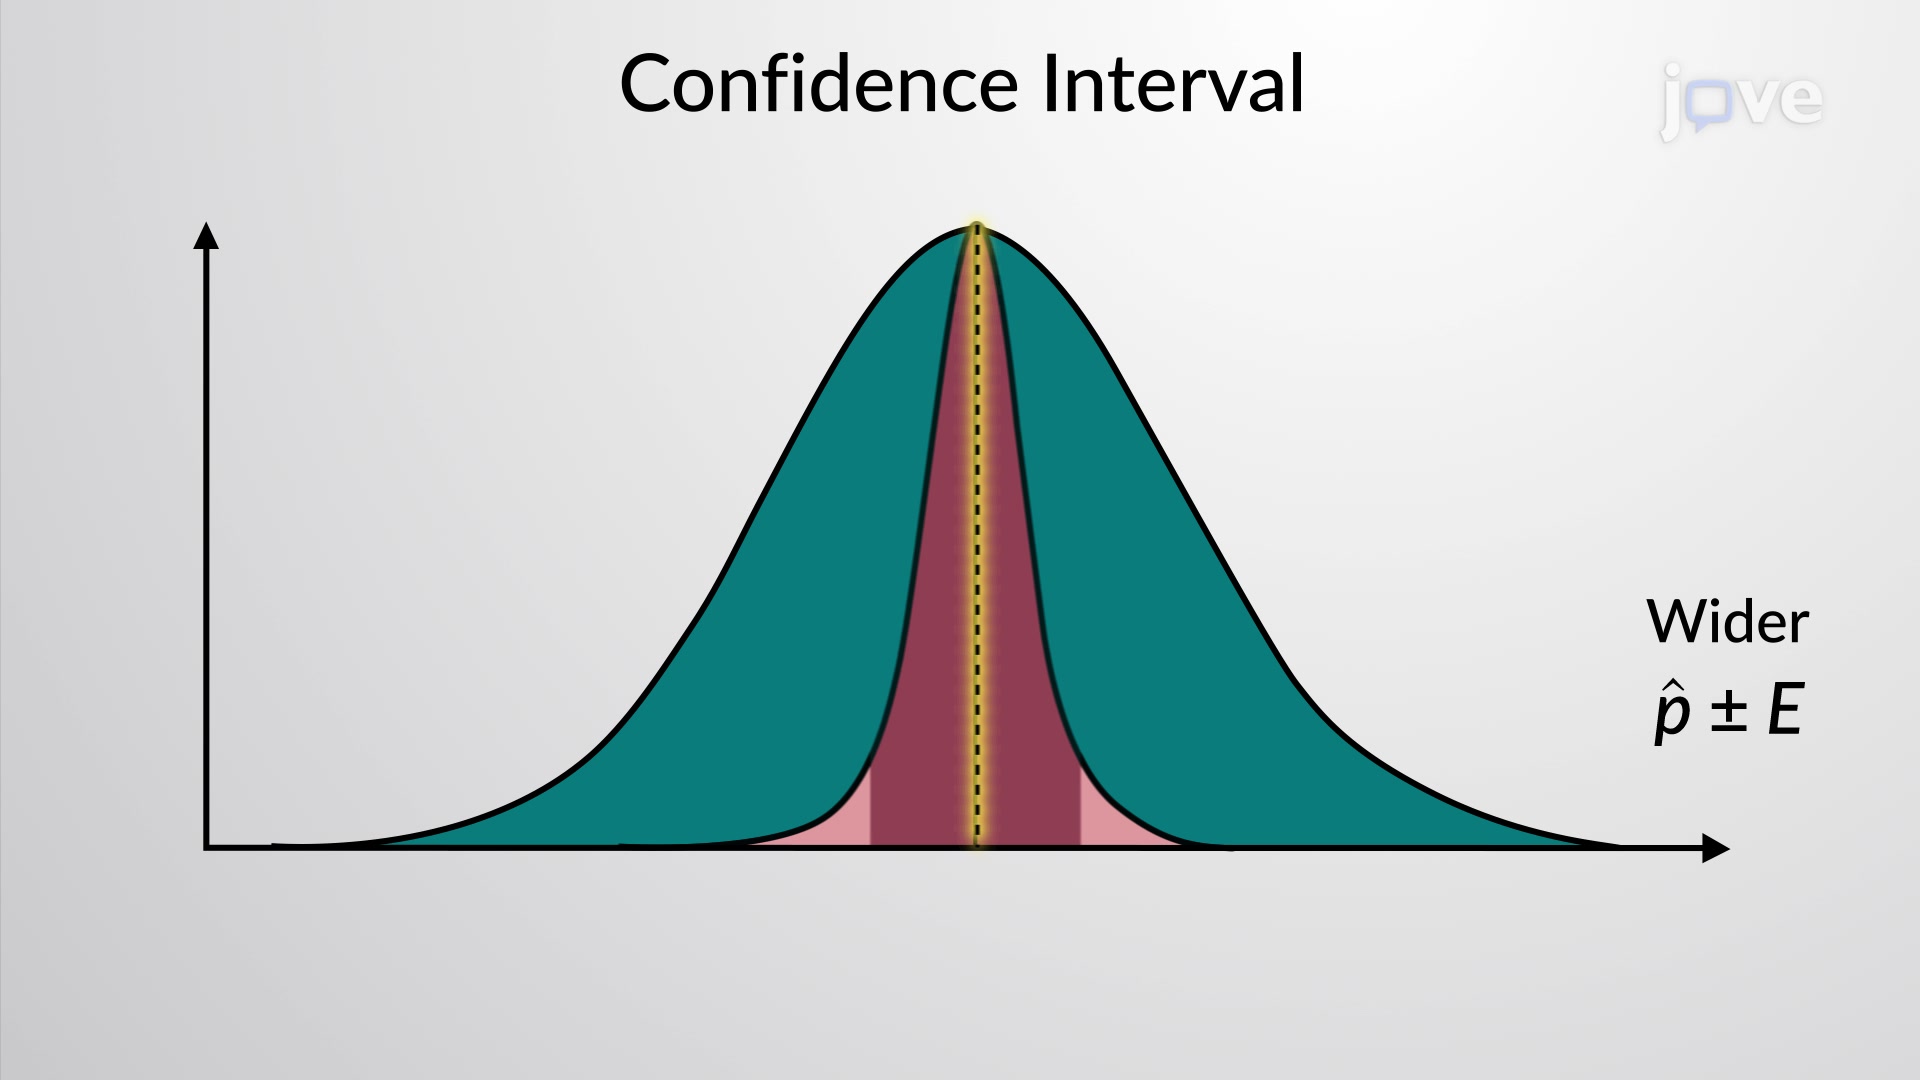
For proportion confidence intervals, the formula simplifies to: p̂ ± E, where p̂ represents the sample proportion and E represents the margin of error. This margin of error depends on the desired confidence level and sample size, creating a direct relationship between precision and resources invested in data collection.
The confidence level (commonly 90%, 95%, or 99%) indicates how often the interval would capture the true population parameter if we repeated the sampling process many times. A 95% confidence interval means that if we conducted the same study 100 times, approximately 95 intervals would contain the true population value.
Higher confidence levels create wider intervals, reflecting the trade-off between certainty and precision. Medical researchers studying drug effectiveness might prefer 99% confidence intervals despite their width, while market researchers might accept 90% intervals for quicker, more precise estimates. This decision impacts everything from FDA drug approval processes to college admissions statistics.
Students encounter confidence intervals throughout their academic journey. In AP Statistics courses, they're essential for hypothesis testing and research projects. College students in psychology, business, and pre-med programs use them to interpret research findings and design experiments. The MCAT includes confidence interval questions in its psychological and social sciences section, while nursing students see them in evidence-based practice courses.
Understanding confidence intervals proves invaluable for interpreting news reports, evaluating medical studies, and making data-driven decisions in any career involving research or analysis.
Frequently Asked Questions
A confidence interval provides a range of plausible values for a population parameter, while a simple average gives only one estimate. For example, instead of saying "the average height is 68 inches," a confidence interval might state "the average height is between 67.2 and 68.8 inches with 95% confidence." This range accounts for sampling uncertainty and provides more reliable information for decision-making.
You'll primarily work with confidence intervals for population means and population proportions. Mean intervals estimate averages (like average test scores), while proportion intervals estimate percentages (like the percentage of students who prefer online learning). Both use similar calculation methods but different formulas based on whether you're working with continuous data or categorical data.
The MCAT's Psychological, Social, and Biological Foundations section includes confidence intervals in research methodology questions. You'll need to interpret study results, understand what different confidence levels mean, and recognize when researchers have sufficient evidence to support their conclusions. USMLE Step 1 also tests confidence interval interpretation in clinical research contexts.
When the FDA evaluates a new medication, clinical trials might show that 82% of patients improve, with a 95% confidence interval of 78-86%. This means regulators can be confident the true improvement rate falls within this range, helping them assess whether the drug meets effectiveness standards for approval and public use.
Not at all! While the underlying calculations involve some algebra and basic probability concepts, understanding confidence intervals primarily requires logical thinking about uncertainty and ranges. If you're comfortable with percentages and basic algebraic manipulation, you have the foundation needed to master this concept in high school or introductory college courses.
Focus on interpretation rather than memorizing formulas. Practice explaining what different confidence levels mean in plain English, work through real-world examples from news articles or research studies, and understand the relationship between sample size, confidence level, and interval width. Many students find drawing visual representations helpful for cementing these concepts.
The margin of error you see in election polls (like "±3 percentage points") represents half the width of a confidence interval. When a poll shows 52% support with ±3% margin of error, the full 95% confidence interval runs from 49% to 55%, indicating the true population support likely falls within this range.
Hypothesis testing naturally follows confidence intervals, as both deal with statistical inference and uncertainty. You'll also want to explore sampling distributions, which provide the theoretical foundation for why confidence intervals work, and eventually move into more advanced topics like regression analysis and experimental design.
Related Micro-courses
Related Subjects


