Loading subject page…
- Statistics
- Estimates
- Interpretation of Confidence Intervals
Micro-course: Estimates
85,600 views
Learn key concepts and earn your certificate.




Interpretation of Confidence Intervals

00:00
01:19
Video Summary: What Is Interpretation of Confidence Intervals
Did you know that most students misinterpret confidence intervals, even after calculating them correctly? The interpretation of confidence intervals isn't about the probability that a single interval contains the true population parameter-it's about what happens when you repeat the sampling process many times. For example, when the FDA evaluates drug effectiveness across multiple clinical trials, they rely on this proper understanding to make regulatory decisions. Watch the full video on JoVE Coach to master this concept with expert-led visuals and step-by-step explanations.
- Understand what is interpretation of confidence intervals and why common misconceptions lead to incorrect statistical conclusions
- Identify the difference between probability statements about individual intervals versus long-run frequency interpretations
- Analyze why a 95% confidence interval doesn't mean there's a 95% chance the true parameter lies within that specific interval
- Compare correct and incorrect interpretations of confidence intervals using real-world scenarios
- Evaluate the relationship between confidence intervals and statistical significance testing
- Apply proper interpretation methods when analyzing data from surveys, experiments, and clinical studies
- Recognize how confidence interval interpretation connects to hypothesis testing and p-values
- Explore the practical implications of confidence interval interpretation in scientific research and policy decisions
Understanding What is Interpretation of Confidence Intervals
The interpretation of confidence intervals represents one of statistics' most frequently misunderstood concepts, yet mastering it is crucial for anyone working with data analysis. Unlike point estimates that provide single values, confidence intervals offer ranges that help us understand the uncertainty inherent in sampling from populations.
Common Misconceptions About Confidence Interval Interpretation
Many students fall into the trap of thinking a 95% confidence interval means there's a 95% probability that the true population parameter falls within their calculated range. This interpretation of confidence intervals definition is fundamentally flawed because it treats the population parameter as a random variable when it's actually fixed-we just don't know its exact value.
Consider a real example: if researchers study average SAT scores across US high schools and calculate a 95% confidence interval of [1180, 1220], the correct interpretation isn't that there's a 95% chance the true mean falls between 1180 and 1220. Instead, either the true mean is in this interval (probability = 1) or it isn't (probability = 0).
The Correct Statistical Framework
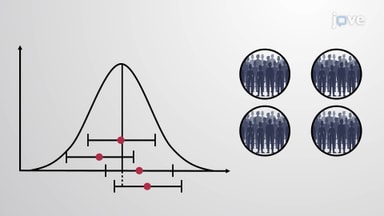
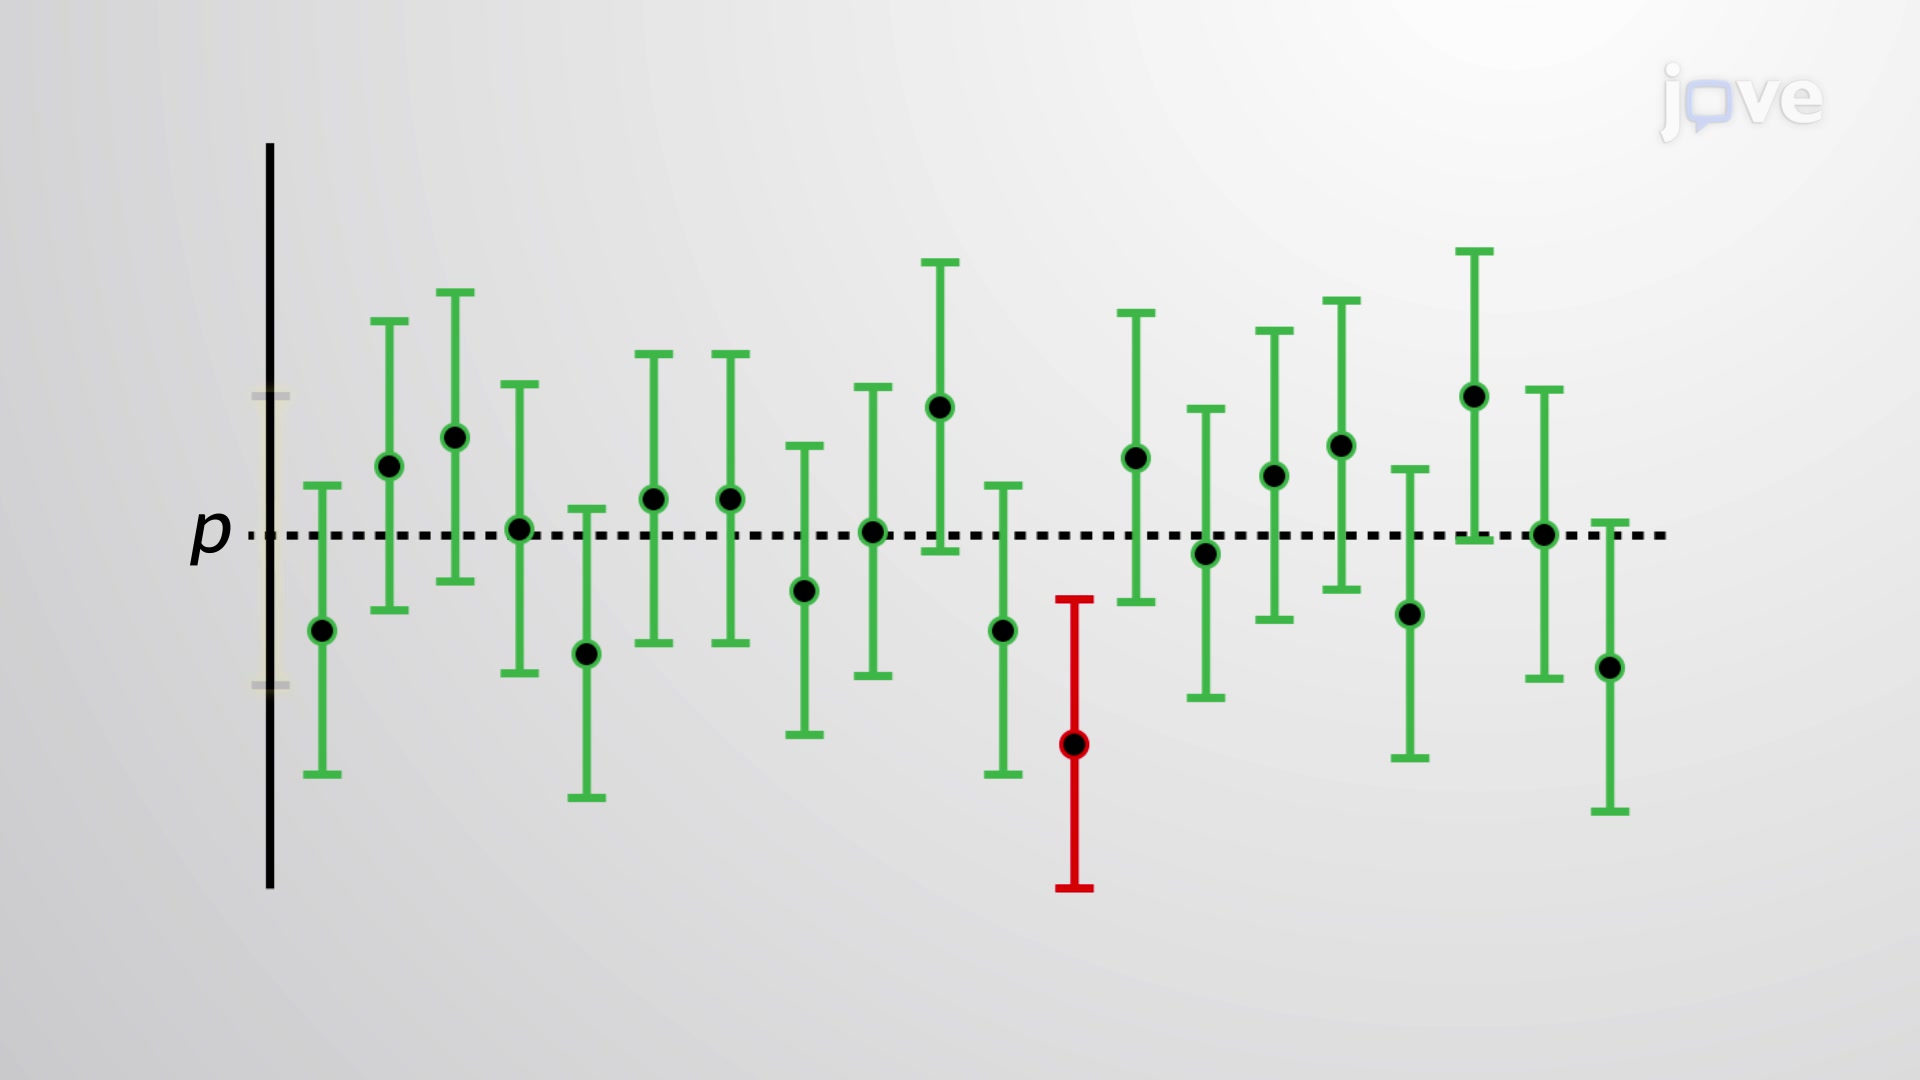
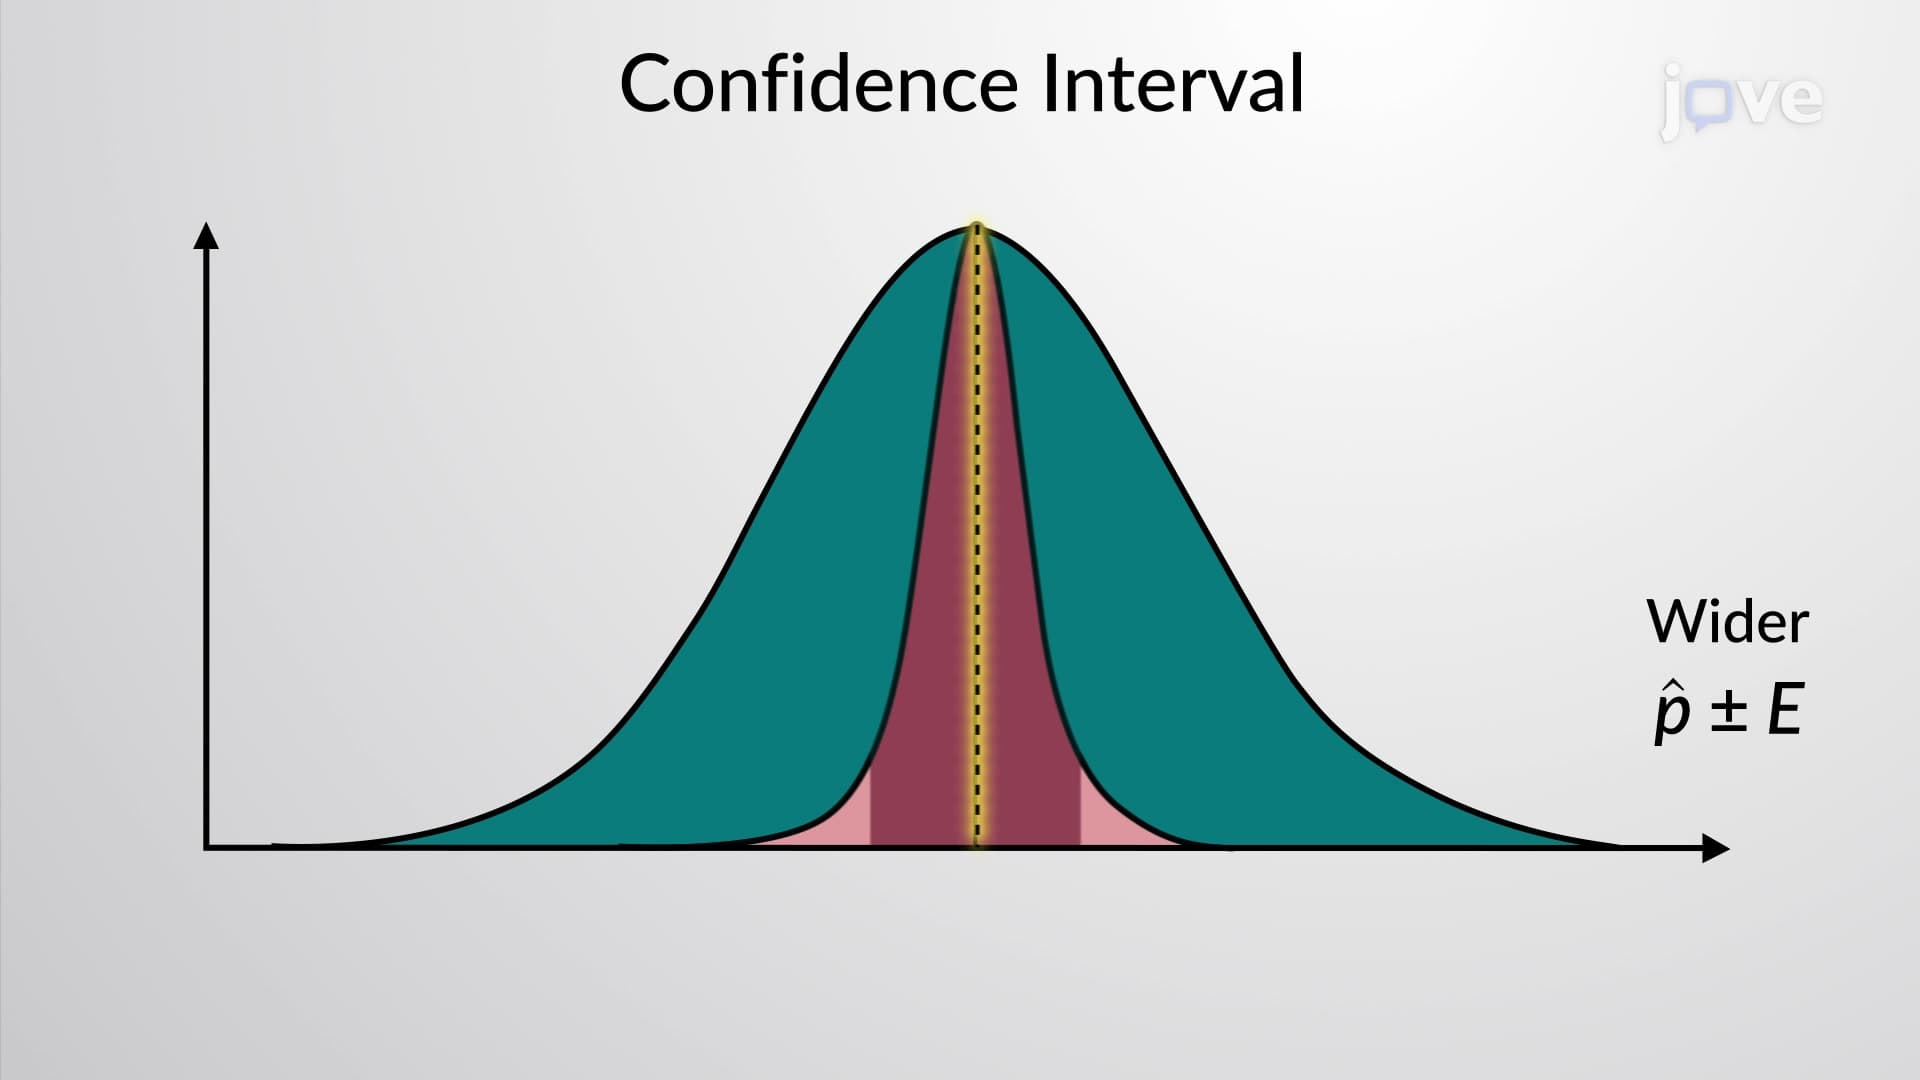
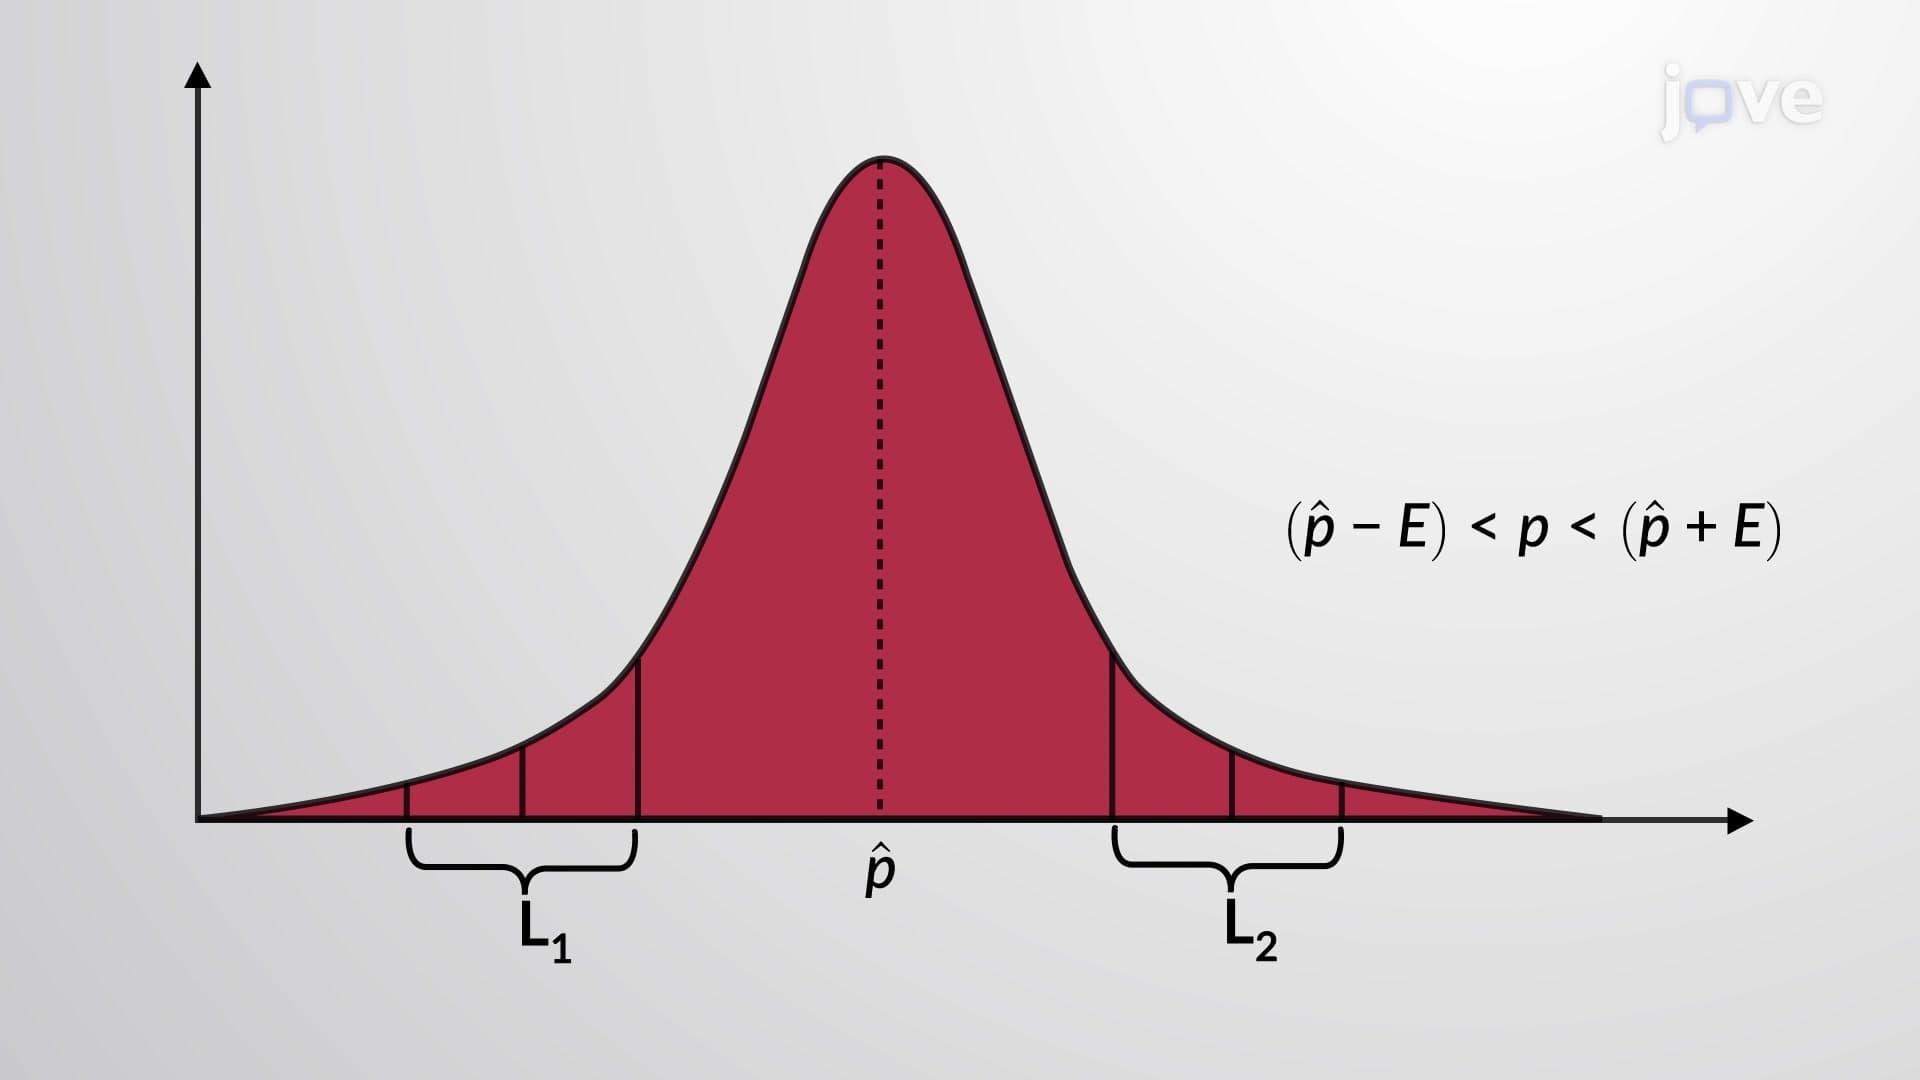
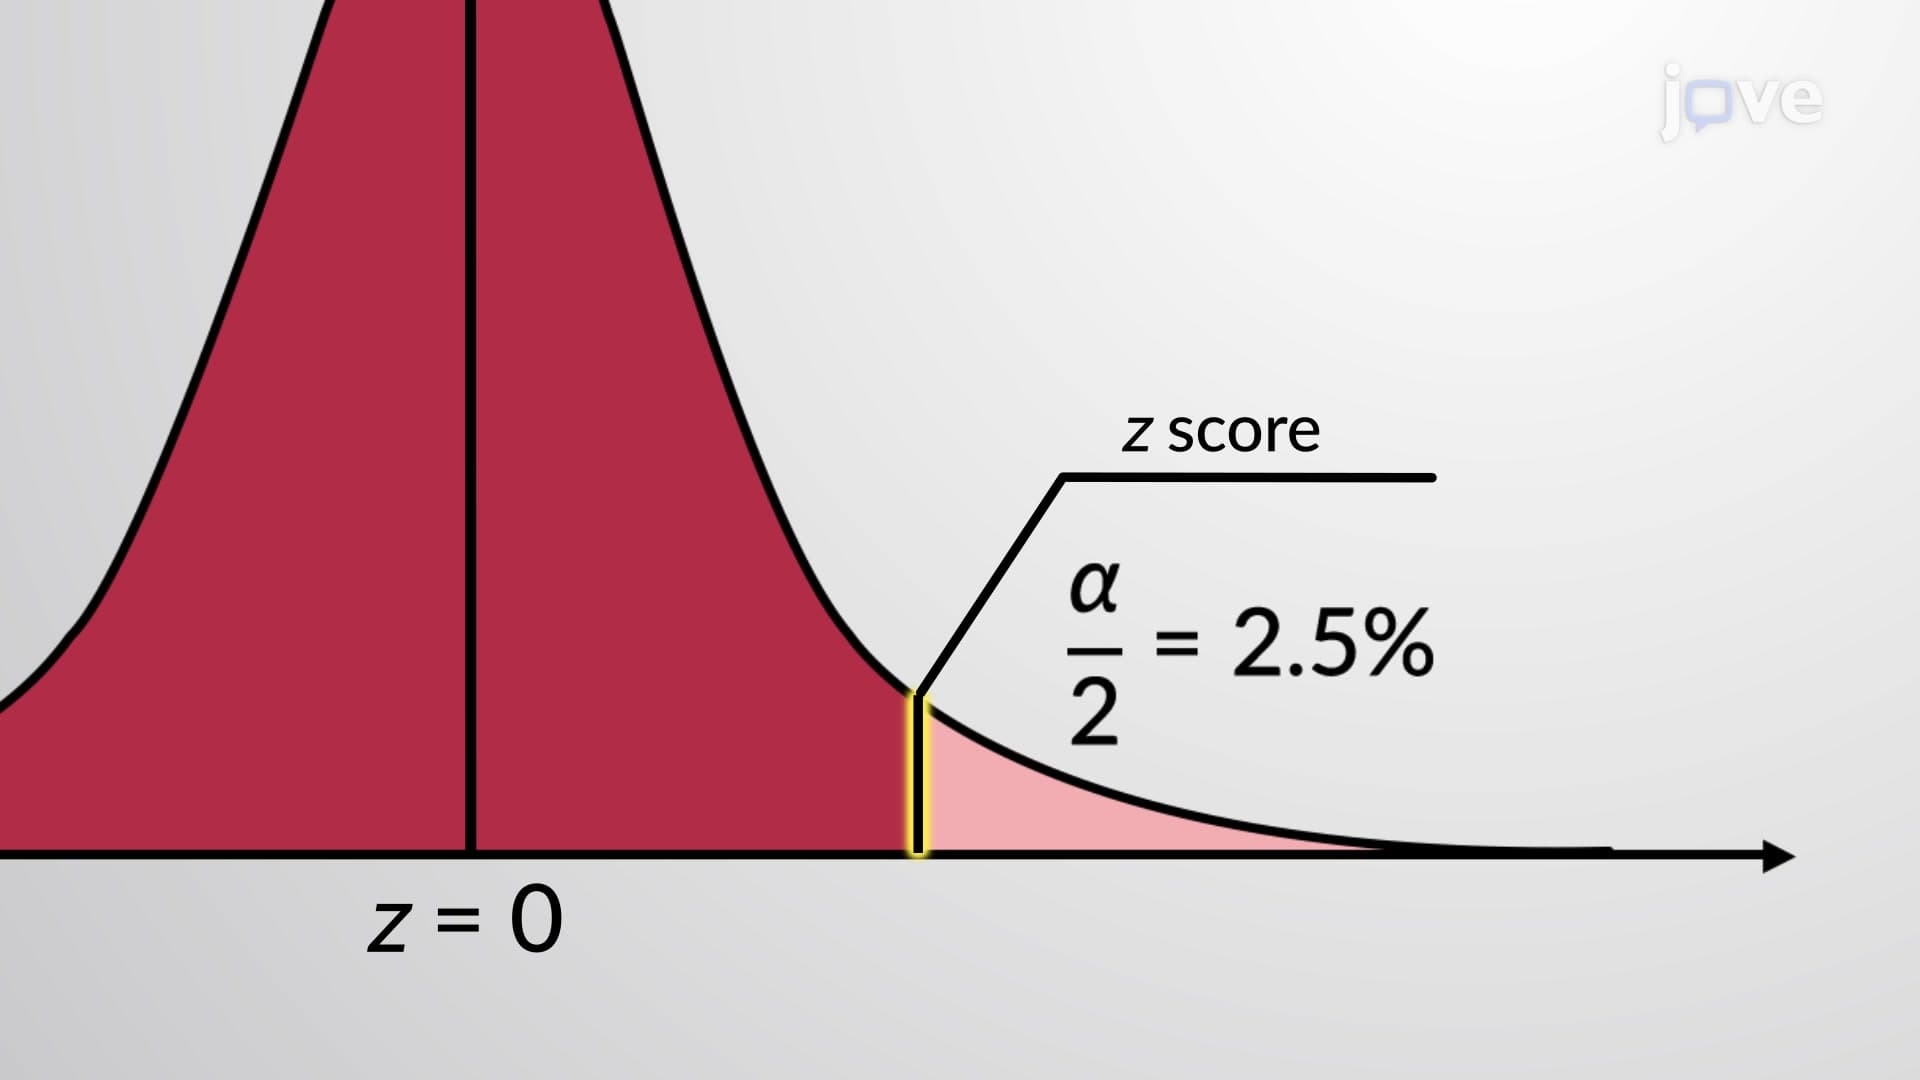
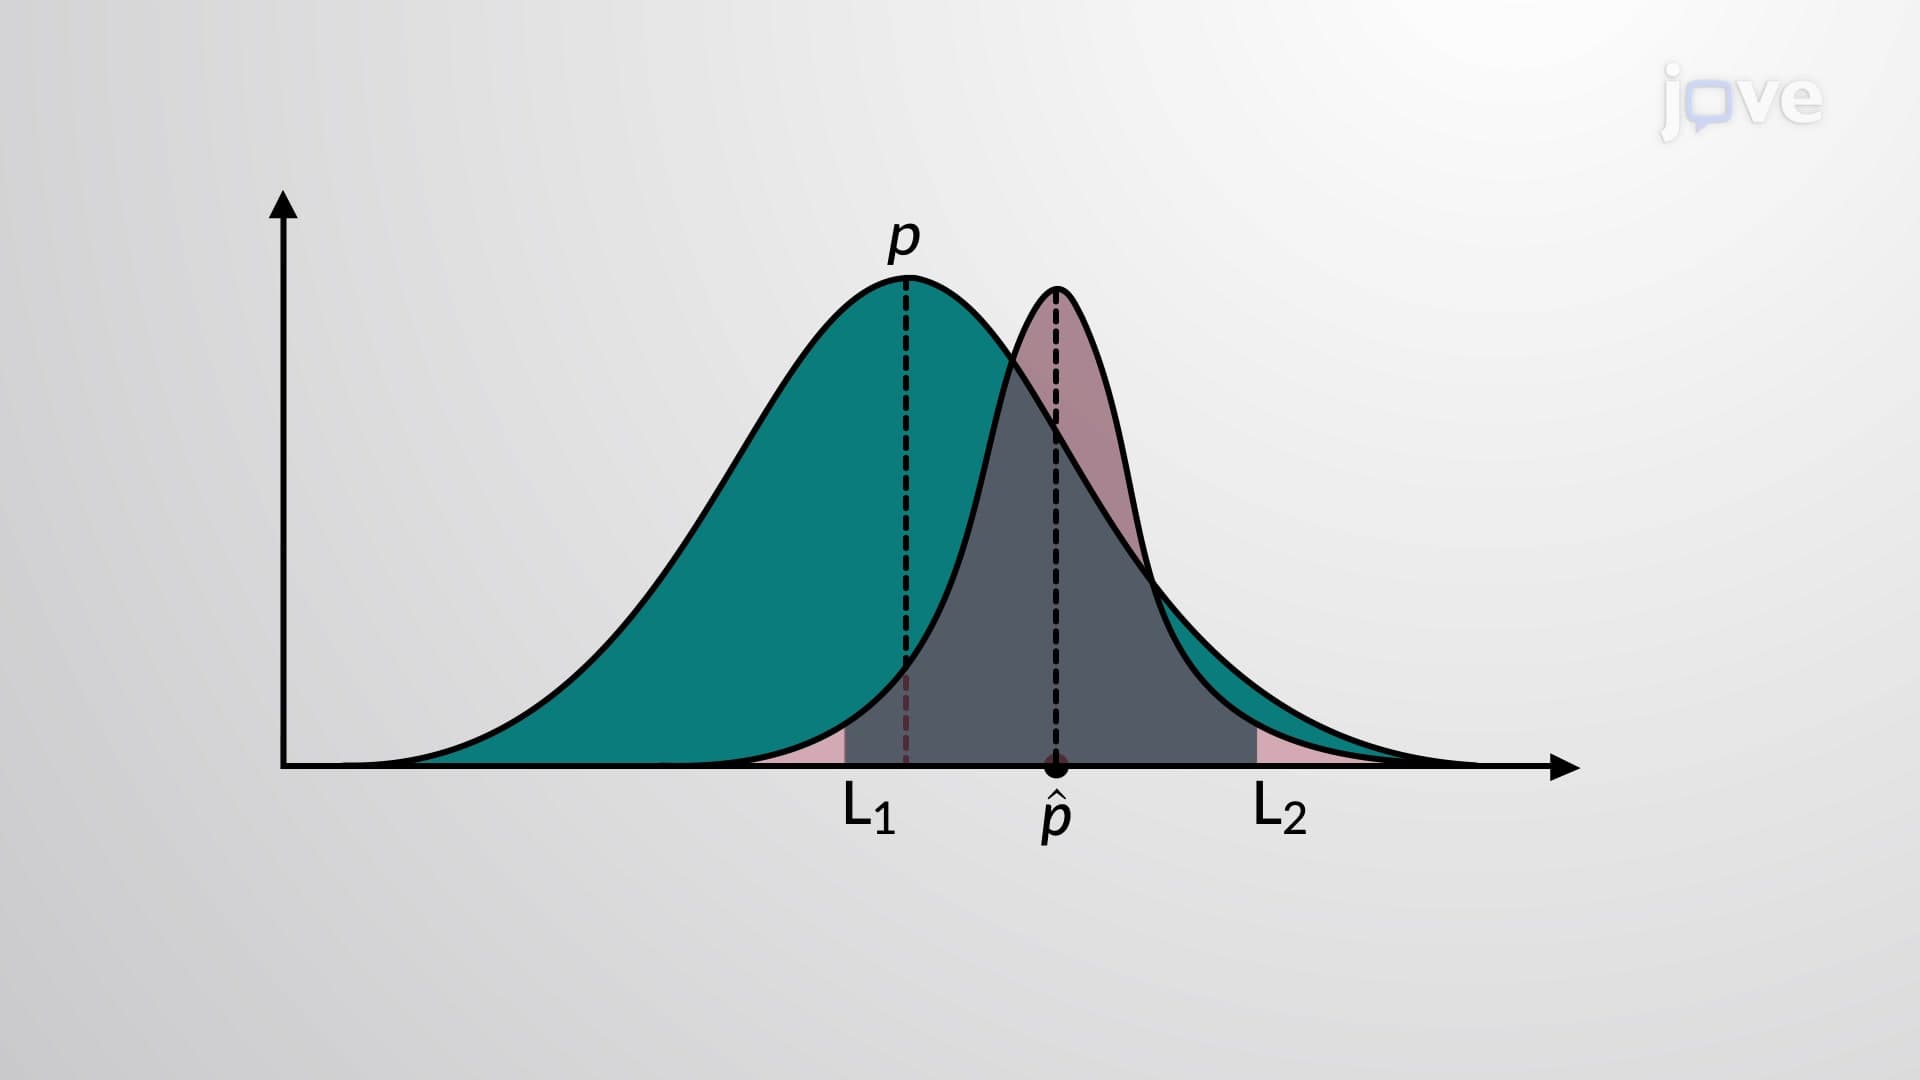
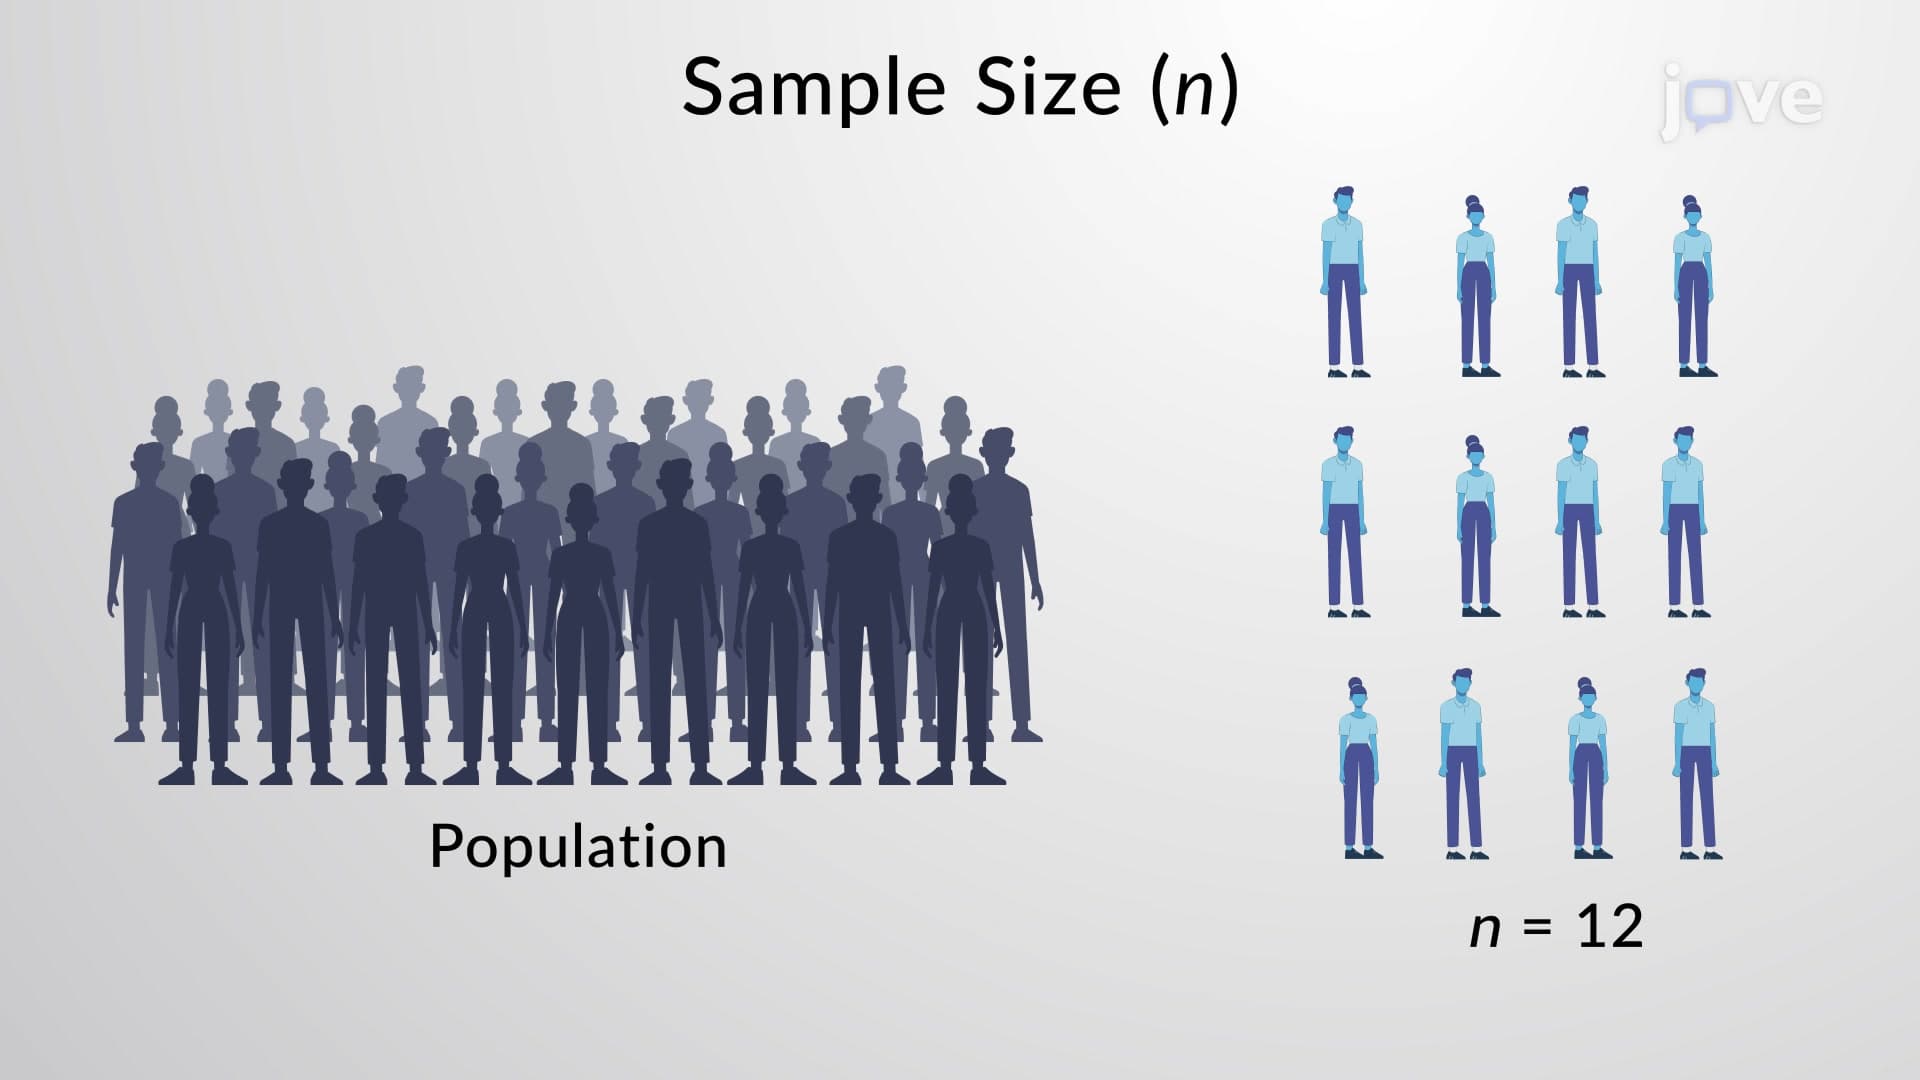
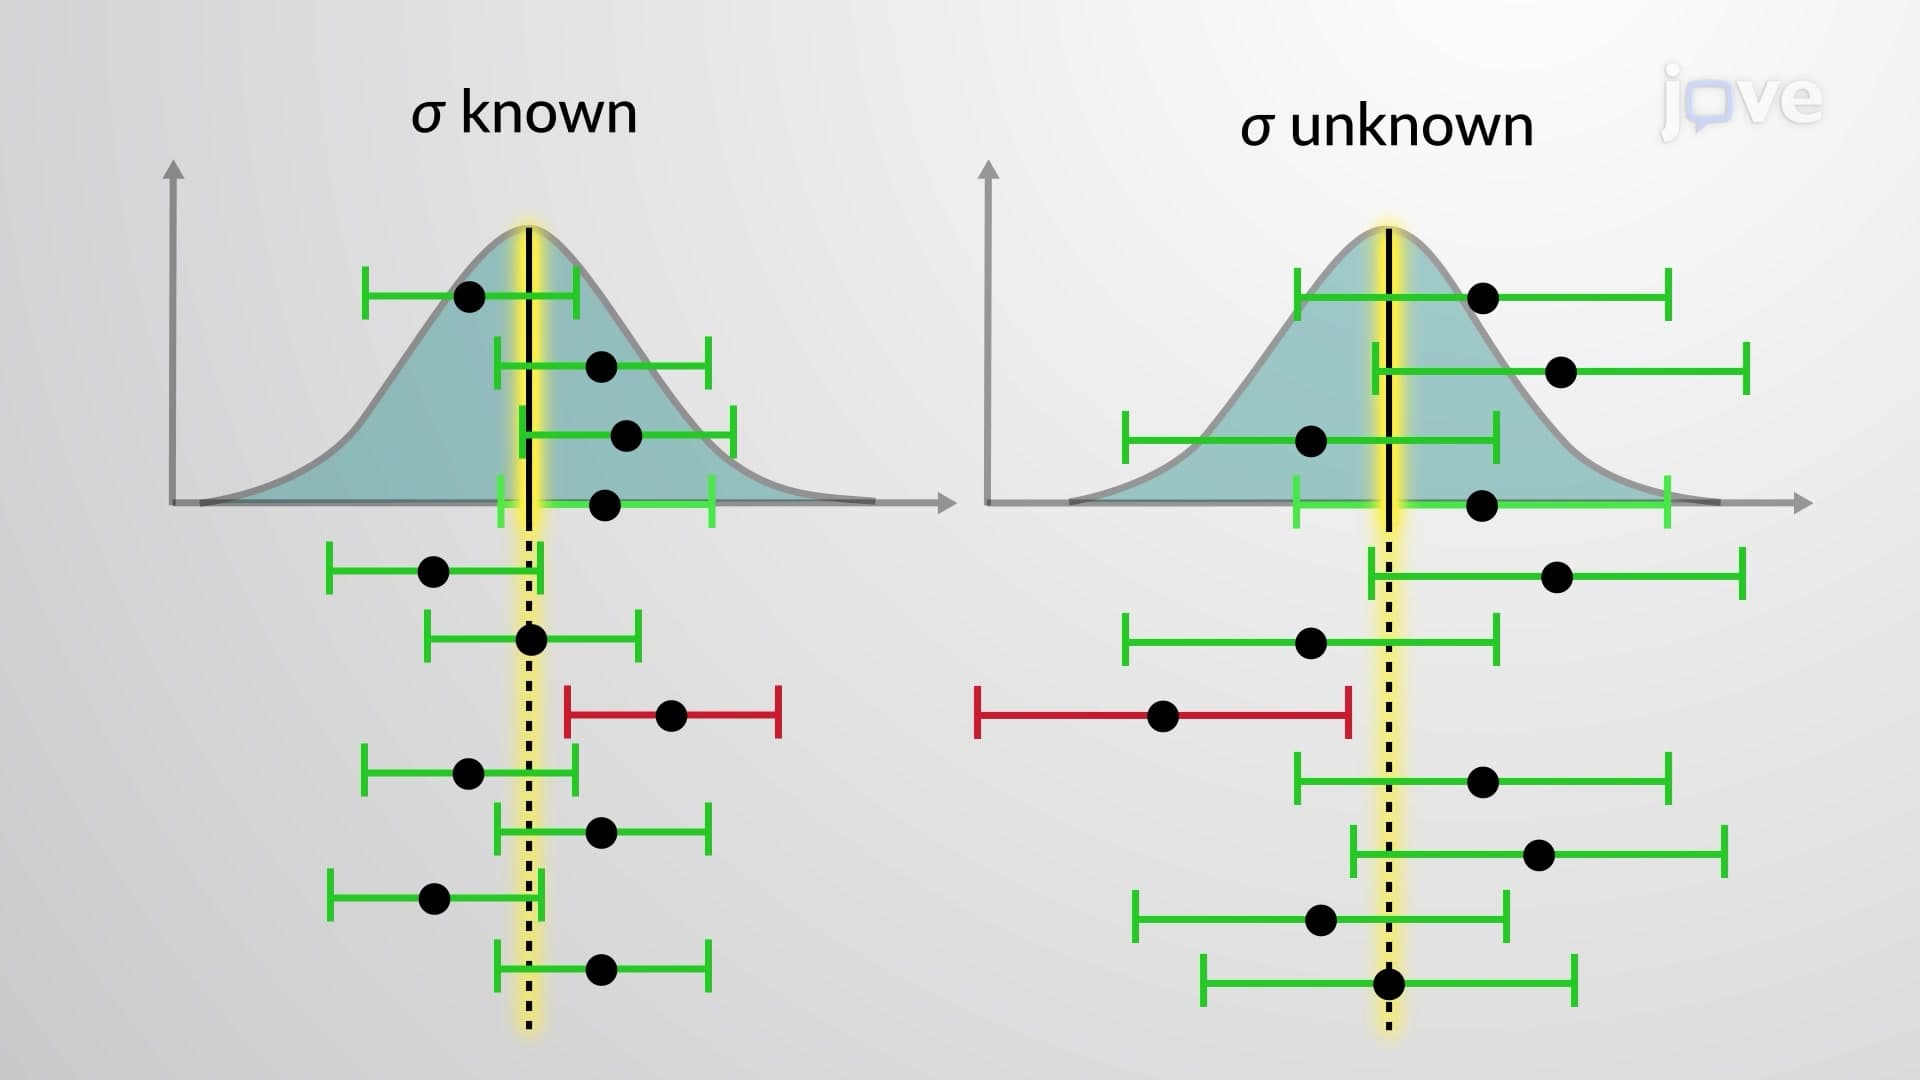
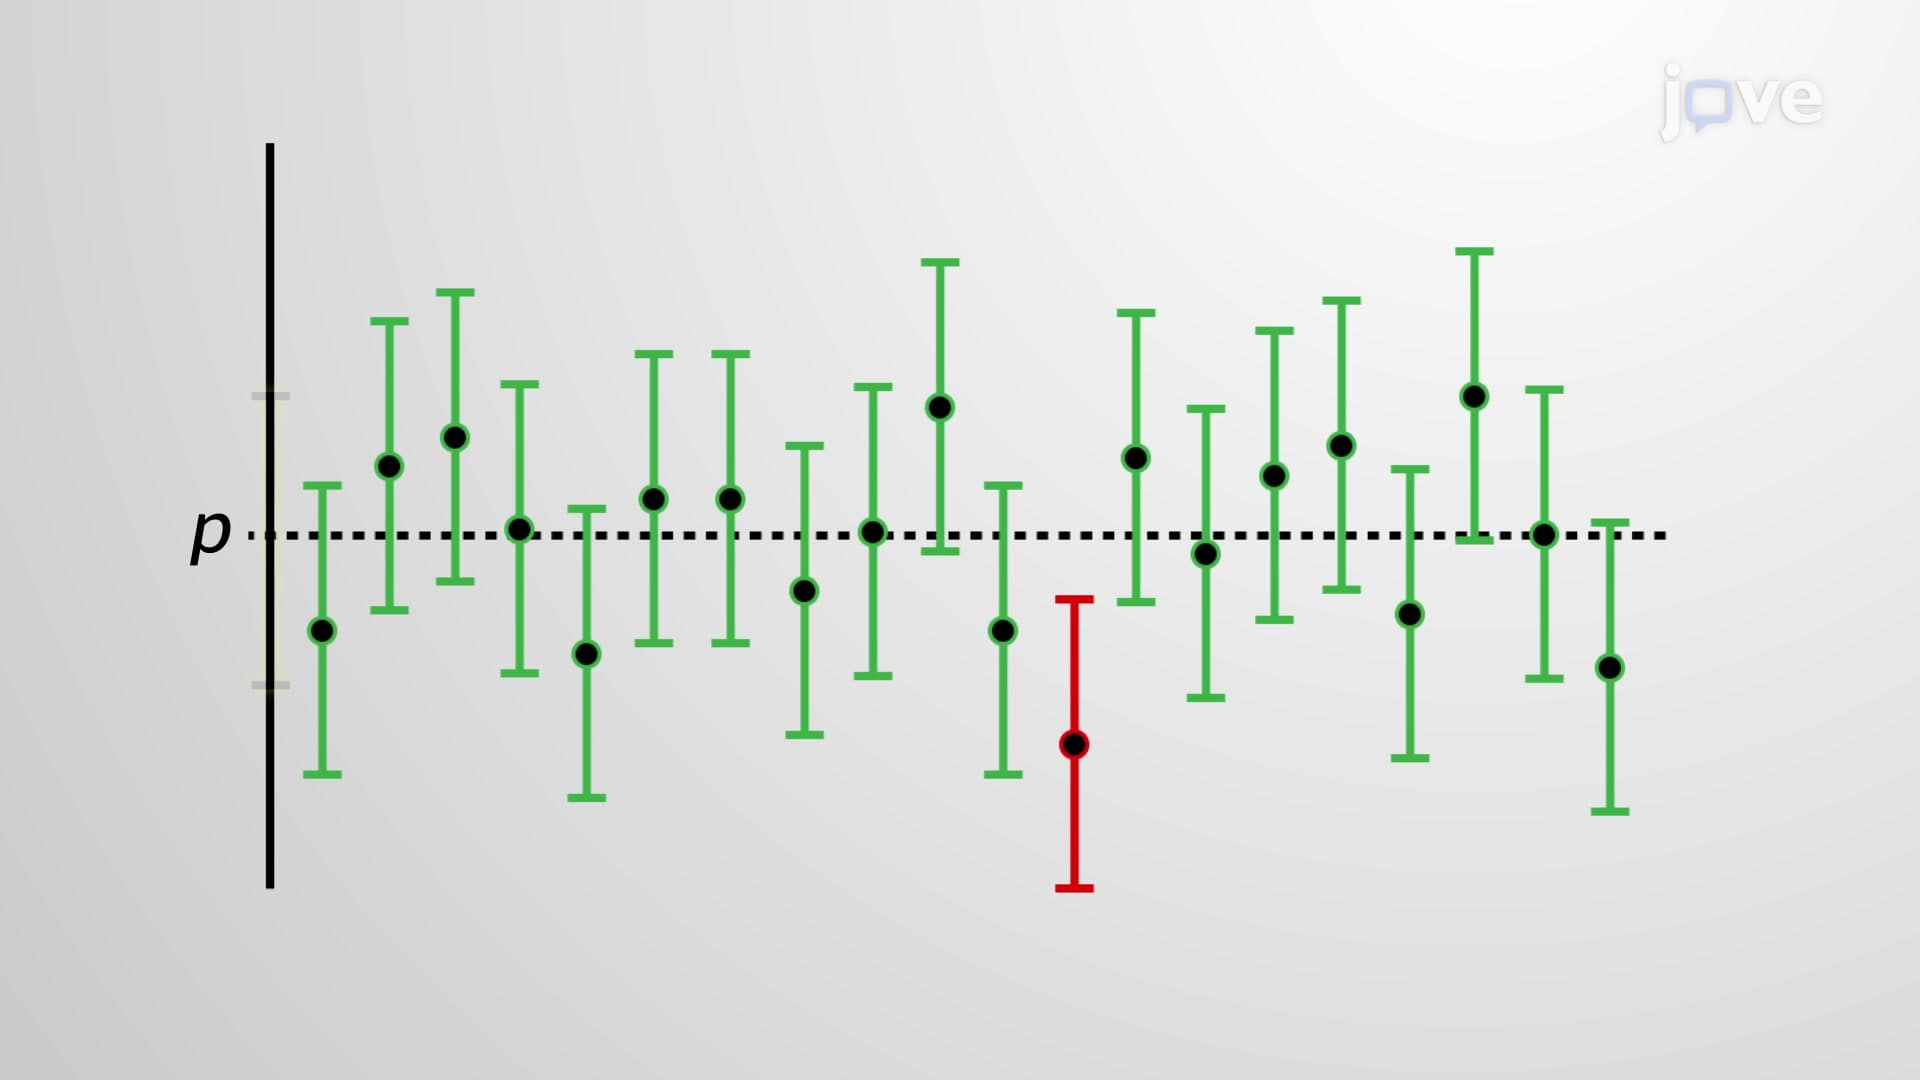
What is interpretation of confidence intervals in detail requires understanding the long-run frequency perspective. A 95% confidence level means that if you repeated your sampling method hundreds of times and calculated confidence intervals each time, approximately 95% of those intervals would contain the true population parameter.
This concept becomes clearer when examining medical research. The CDC regularly conducts health surveys across different US populations. When they report confidence intervals for disease prevalence rates, they're acknowledging that their specific interval might not contain the true rate, but their methodology ensures that 95% of similarly constructed intervals would capture it.
Practical Applications and Exam Relevance
For AP Statistics students, this interpretation of confidence intervals concept frequently appears in free-response questions where proper explanation of results is crucial. College-level courses in psychology, biology, and economics all require students to interpret confidence intervals correctly when analyzing research findings.
The connection to hypothesis testing is equally important: when a 95% confidence interval doesn't include a hypothesized parameter value, this corresponds to rejecting that hypothesis at the α = 0.05 significance level. This relationship helps students understand why confidence intervals provide both estimation and testing capabilities in a single statistical tool.
Frequently Asked Questions
Interpretation of confidence intervals refers to understanding what the interval actually tells us about population parameters. It's misunderstood because people incorrectly think it gives the probability that a specific interval contains the true parameter, when it actually describes the long-run success rate of the interval construction method across many samples.
AP Statistics regularly tests confidence interval interpretation through free-response questions requiring students to explain what intervals mean in context. Students must demonstrate understanding that the confidence level refers to the procedure's reliability, not the probability for any single interval. Proper interpretation often determines whether students earn full credit.
Yes, MCAT psychology and sociology sections include confidence interval interpretation, especially when evaluating research studies. Medical school applicants must understand how confidence intervals support or challenge research conclusions, as this skill is essential for evidence-based medicine practice.
When Pfizer or Moderna report vaccine efficacy rates, they include confidence intervals showing the range of plausible effectiveness percentages. FDA regulators use proper interpretation to determine whether the evidence supports drug approval, understanding that the intervals reflect sampling uncertainty rather than probabilities about specific values.
No advanced mathematics is required beyond basic algebra and probability concepts. The interpretation is more about logical reasoning and understanding sampling variability than complex calculations. High school students in AP Statistics successfully master this concept with proper instruction and practice.
Practice explaining intervals in plain English using real-world contexts rather than just memorizing formulas. Create scenarios where you'd use confidence intervals, then practice writing correct interpretations. Focus on distinguishing between what the interval tells you versus what it doesn't tell you.
When a confidence interval excludes a hypothesized parameter value, this corresponds to rejecting that hypothesis at the corresponding significance level. For example, if a 95% confidence interval for a population mean doesn't include the value 50, you'd reject the hypothesis that μ = 50 at α = 0.05.
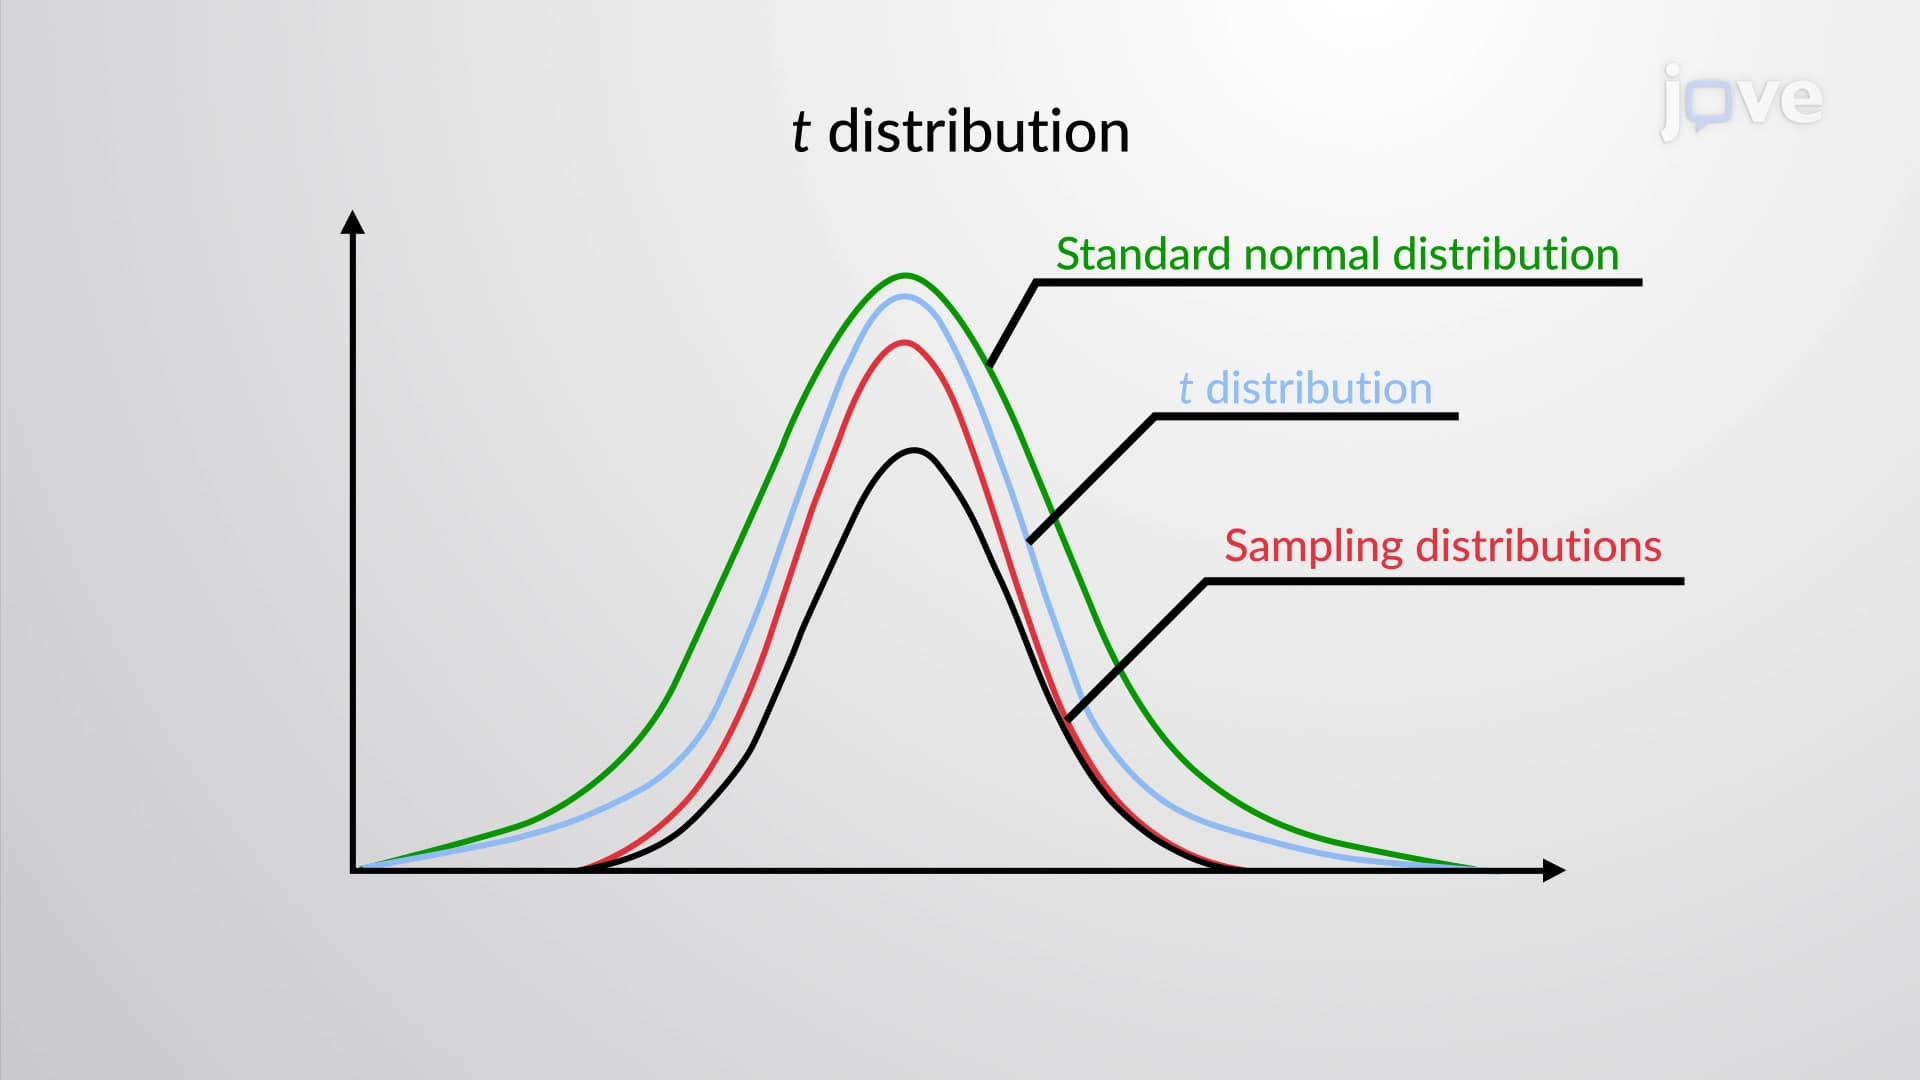
Move on to hypothesis testing procedures, Type I and Type II errors, and power analysis. Understanding confidence intervals provides the foundation for these advanced inference topics. You'll also benefit from studying sampling distributions and the Central Limit Theorem more deeply.
College students across disciplines use confidence intervals to quantify uncertainty in their findings. Whether analyzing survey data in psychology, experimental results in biology, or economic indicators in business courses, proper interpretation helps distinguish between meaningful patterns and random variation in your data.
Related Micro-courses