Loading video…

 11 Concepts
 85.6K views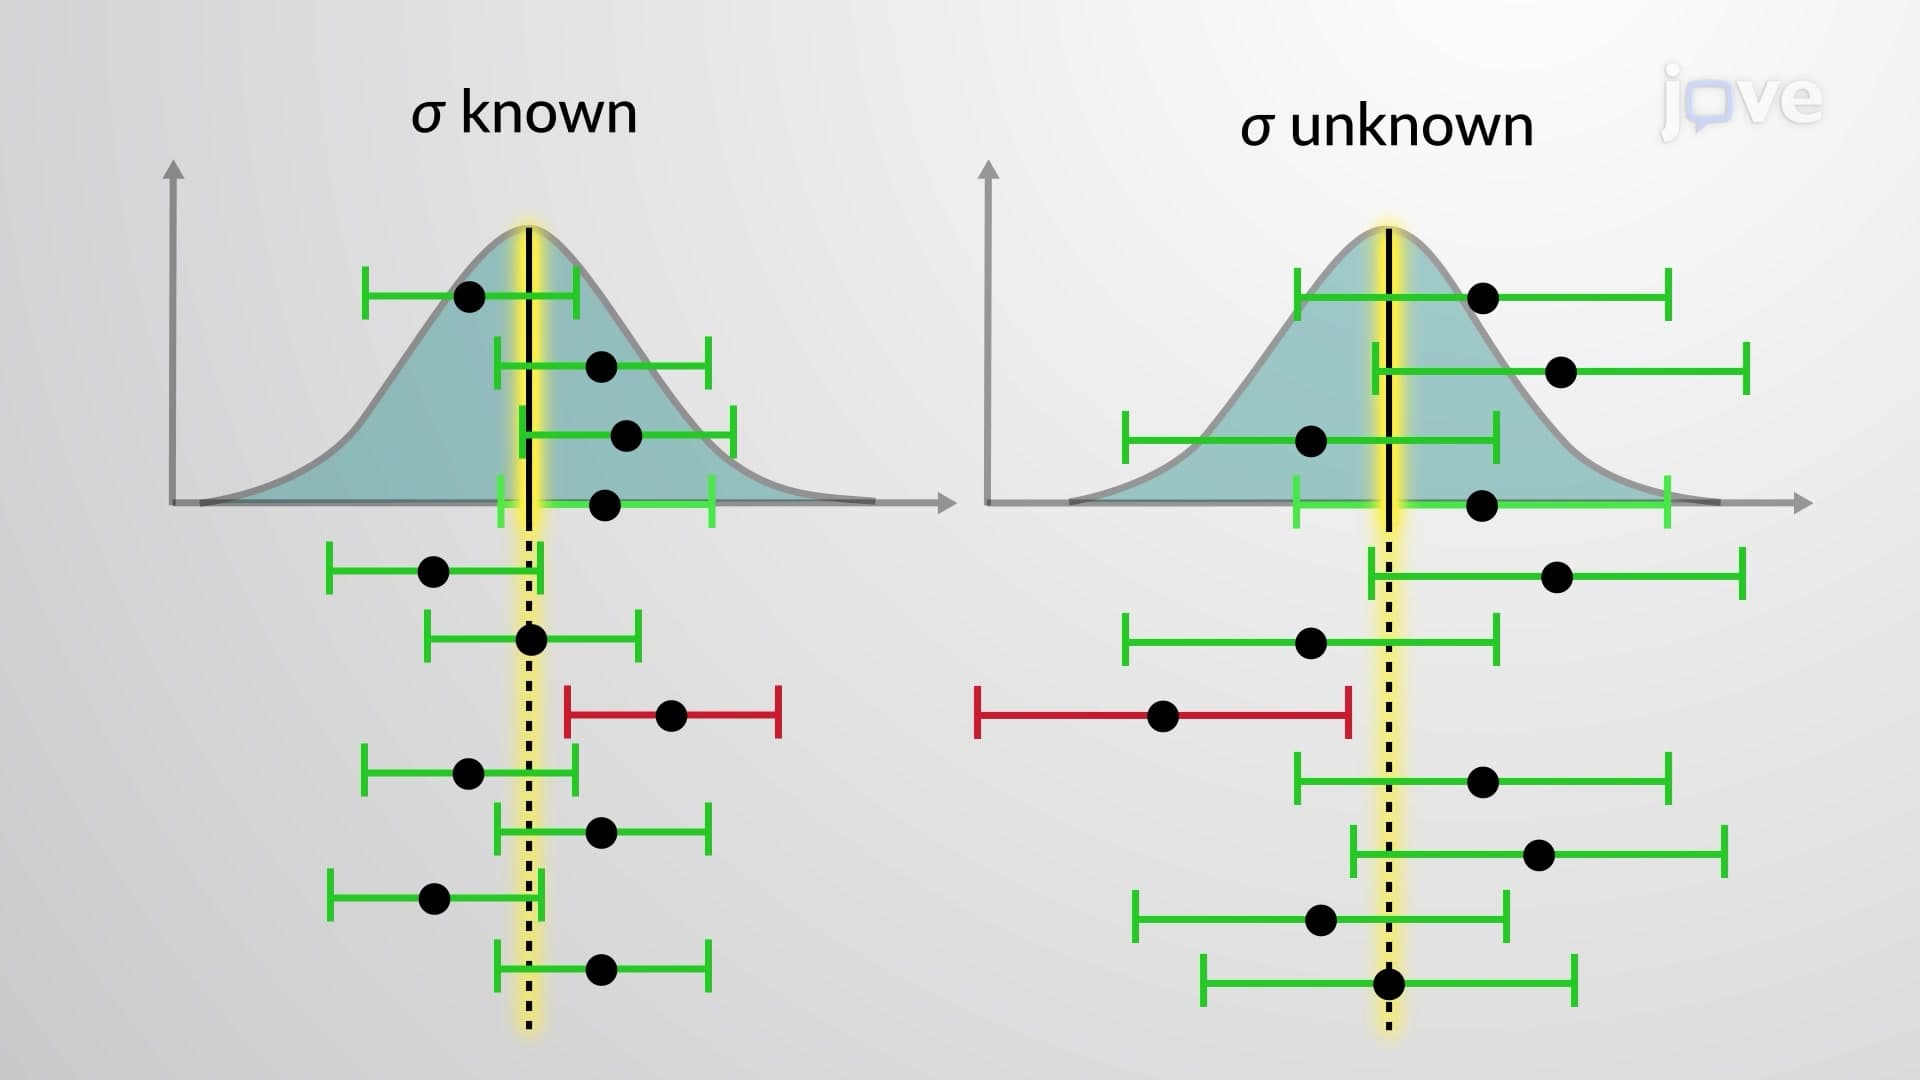

Video Summary: Confidence Interval for Estimating Population Mean Explained
Ever wonder how pollsters predict election outcomes with just 1,000 voters representing 240 million Americans? The confidence interval for estimating population mean makes this statistical magic possible by creating a reliable range around sample estimates. When Gallup surveys Americans about economic confidence, they use this method to transform limited sample data into trustworthy population predictions. Watch the full video on JoVE Coach to master this concept with expert-led visuals and step-by-step explanations.
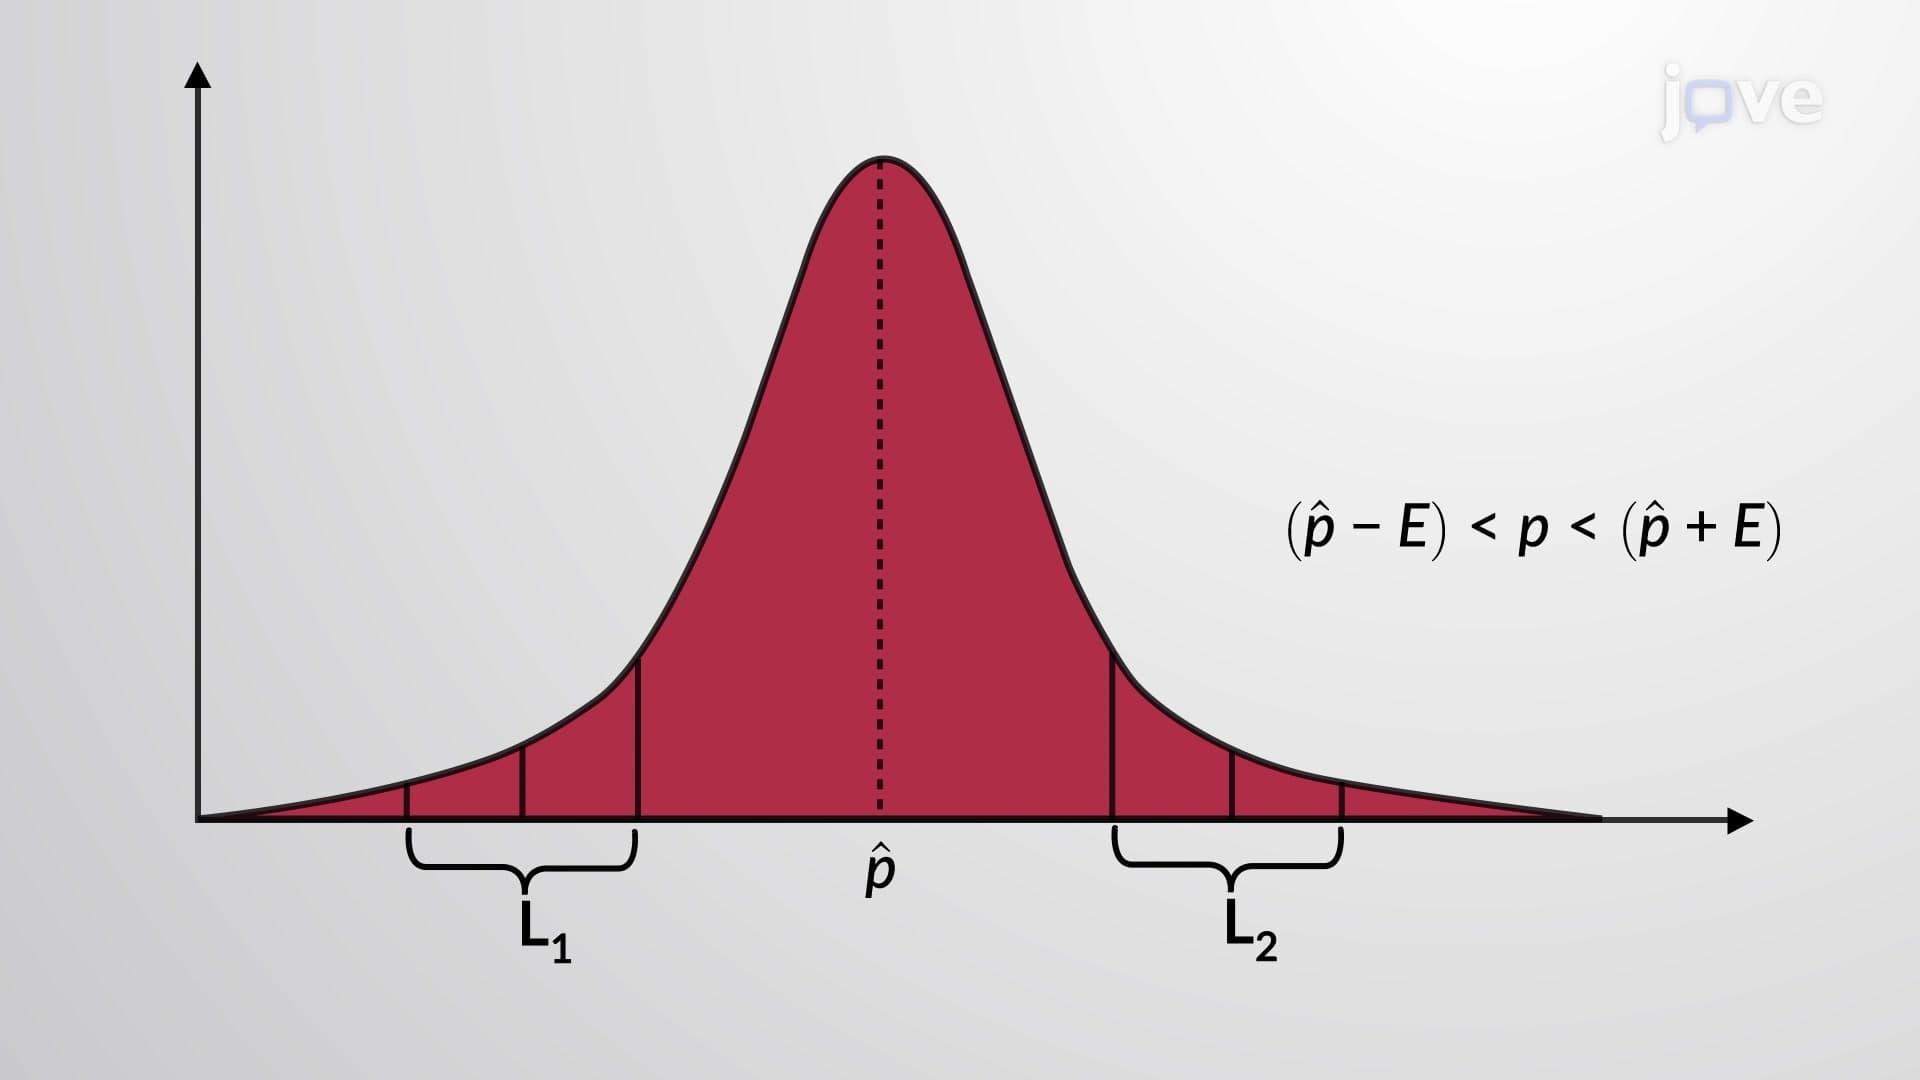
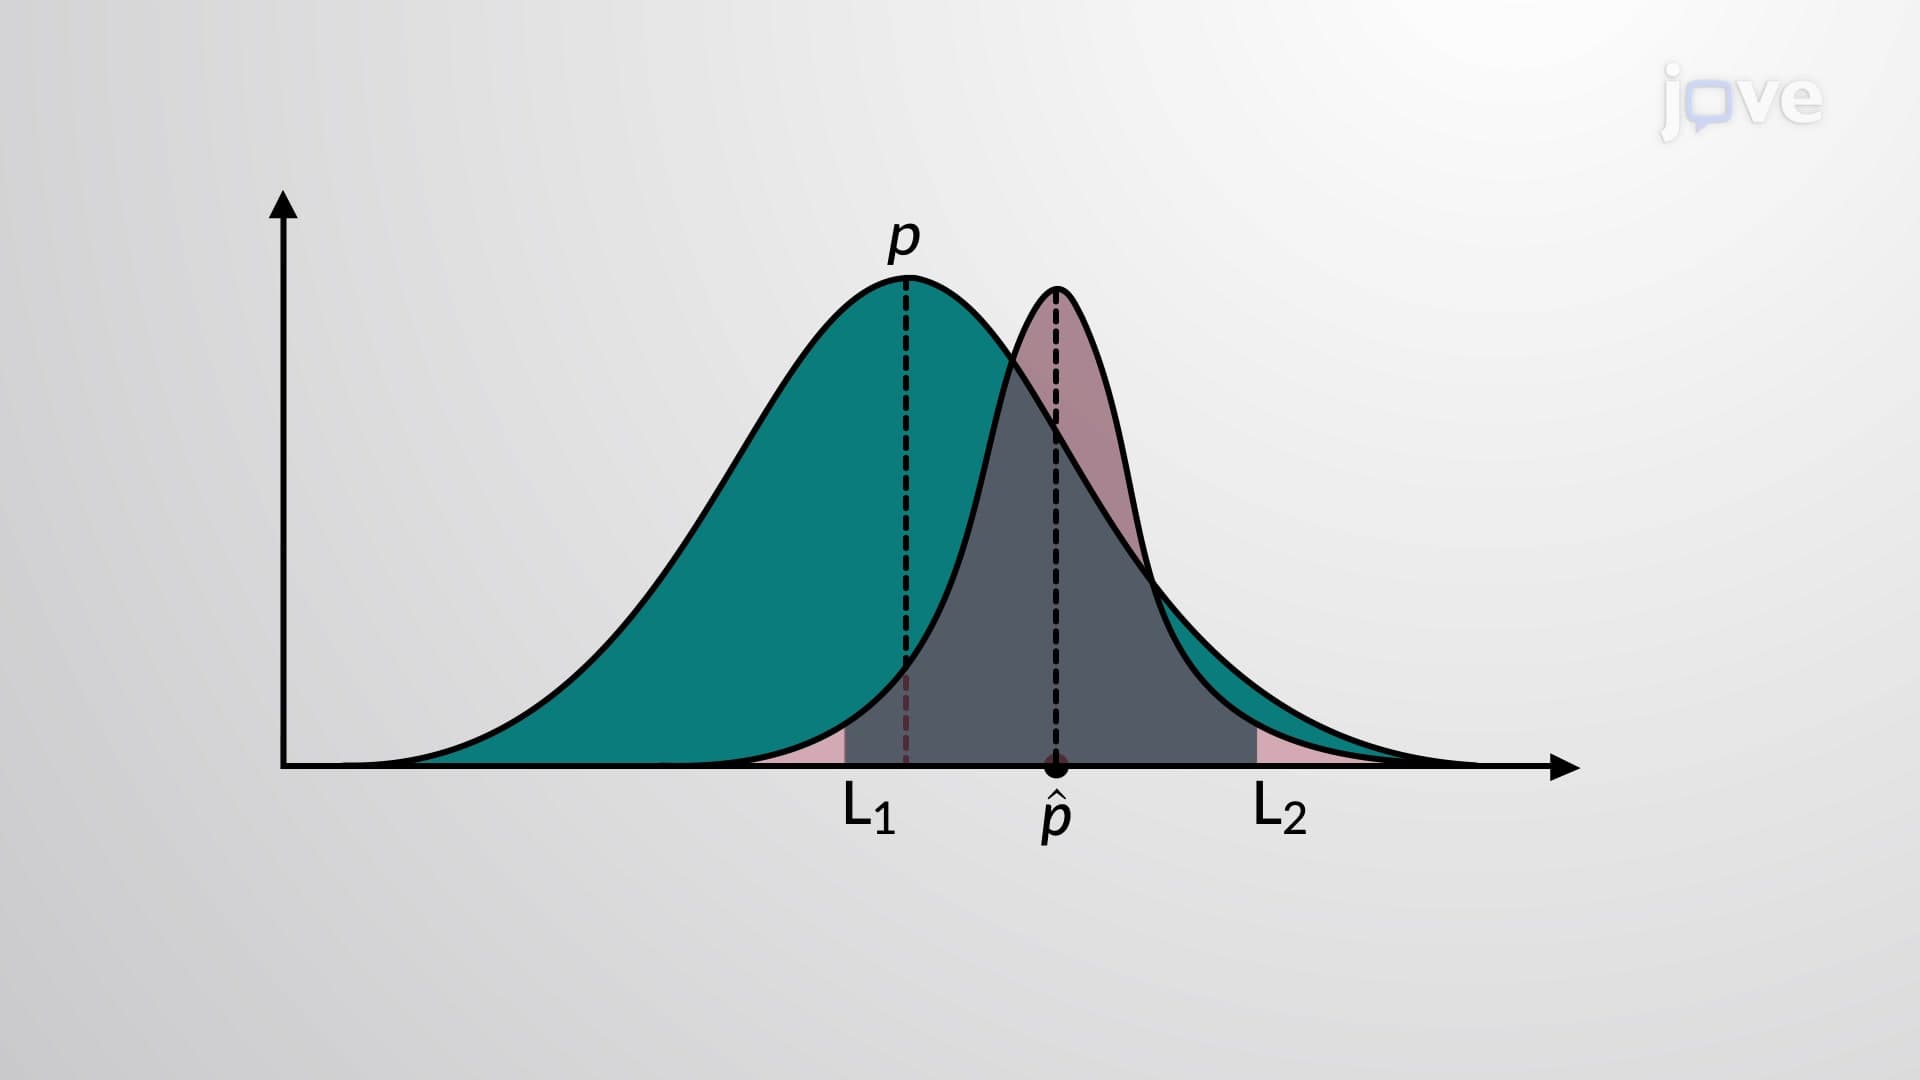
The confidence interval for estimating population mean addresses a fundamental statistical challenge: how can we make reliable inferences about an entire population based on limited sample data? This powerful concept transforms potentially misleading single-number estimates into informative ranges that quantify our uncertainty.
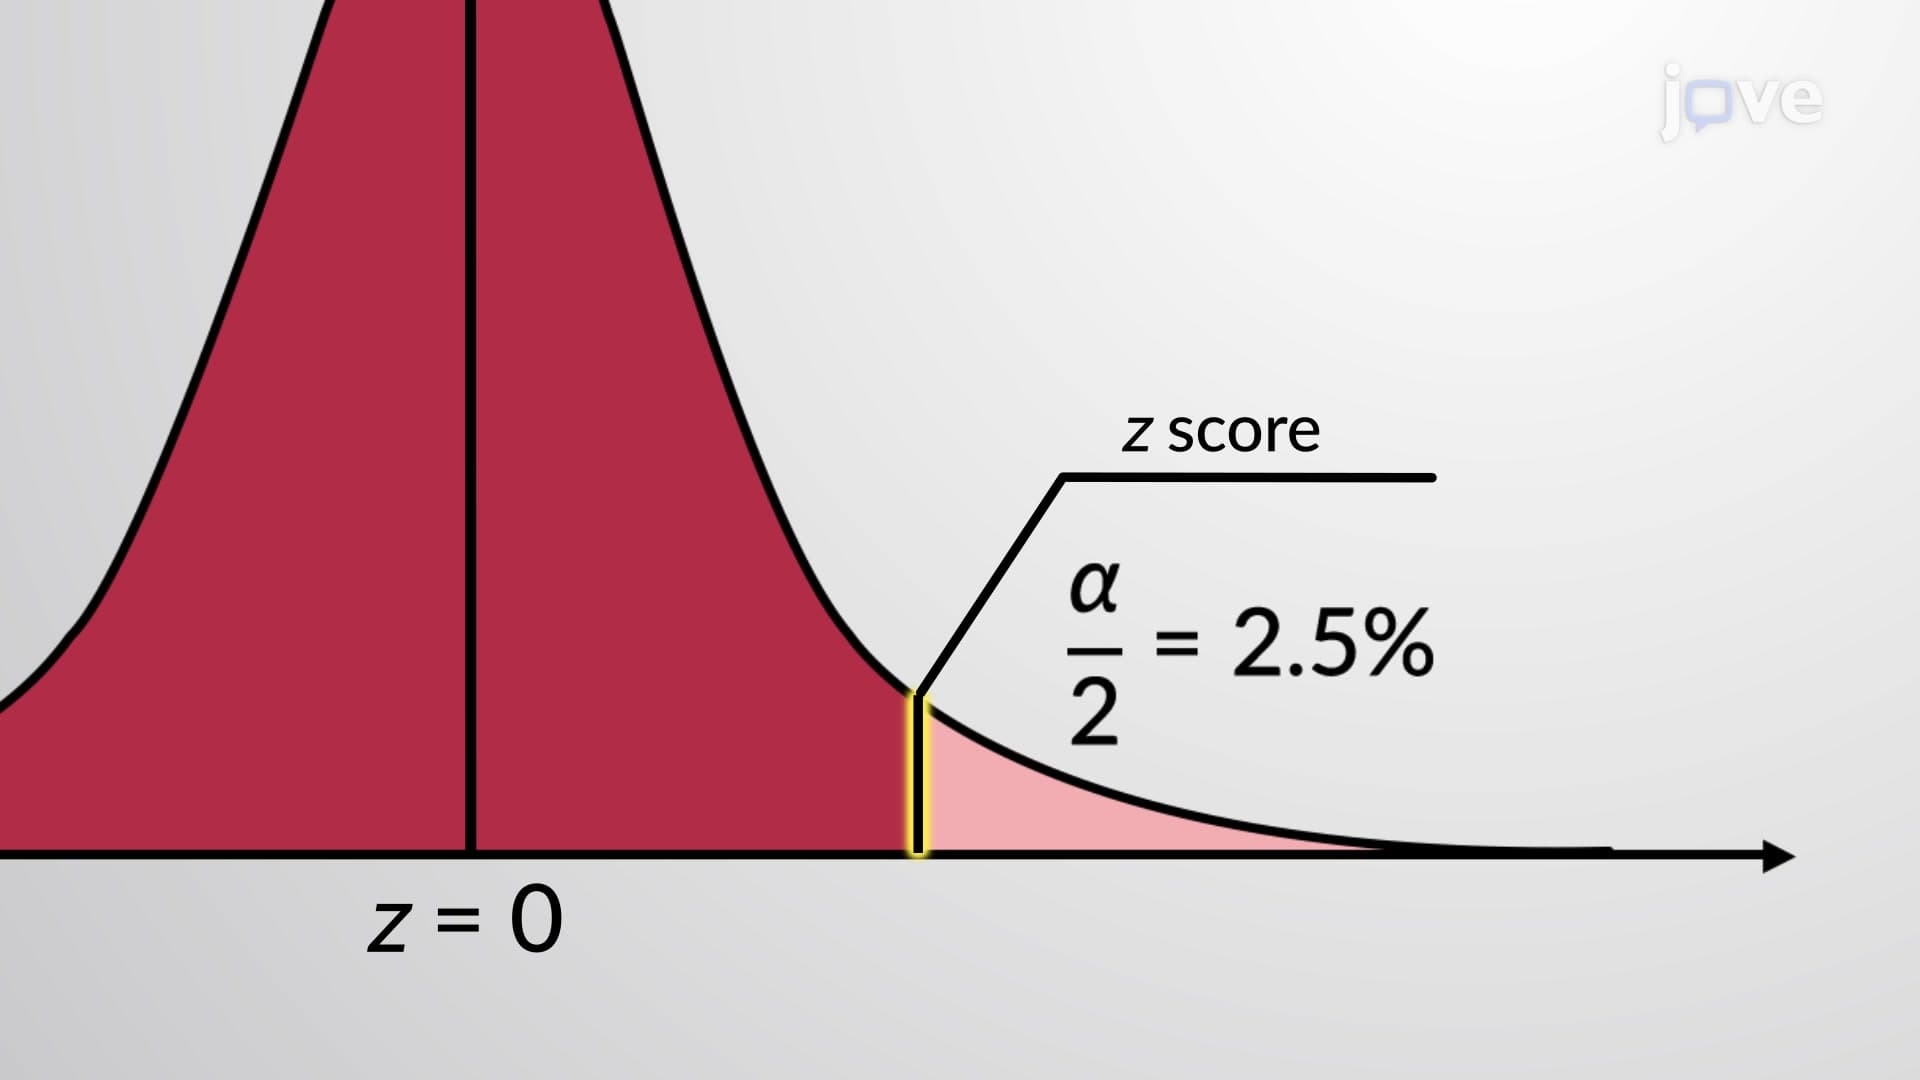
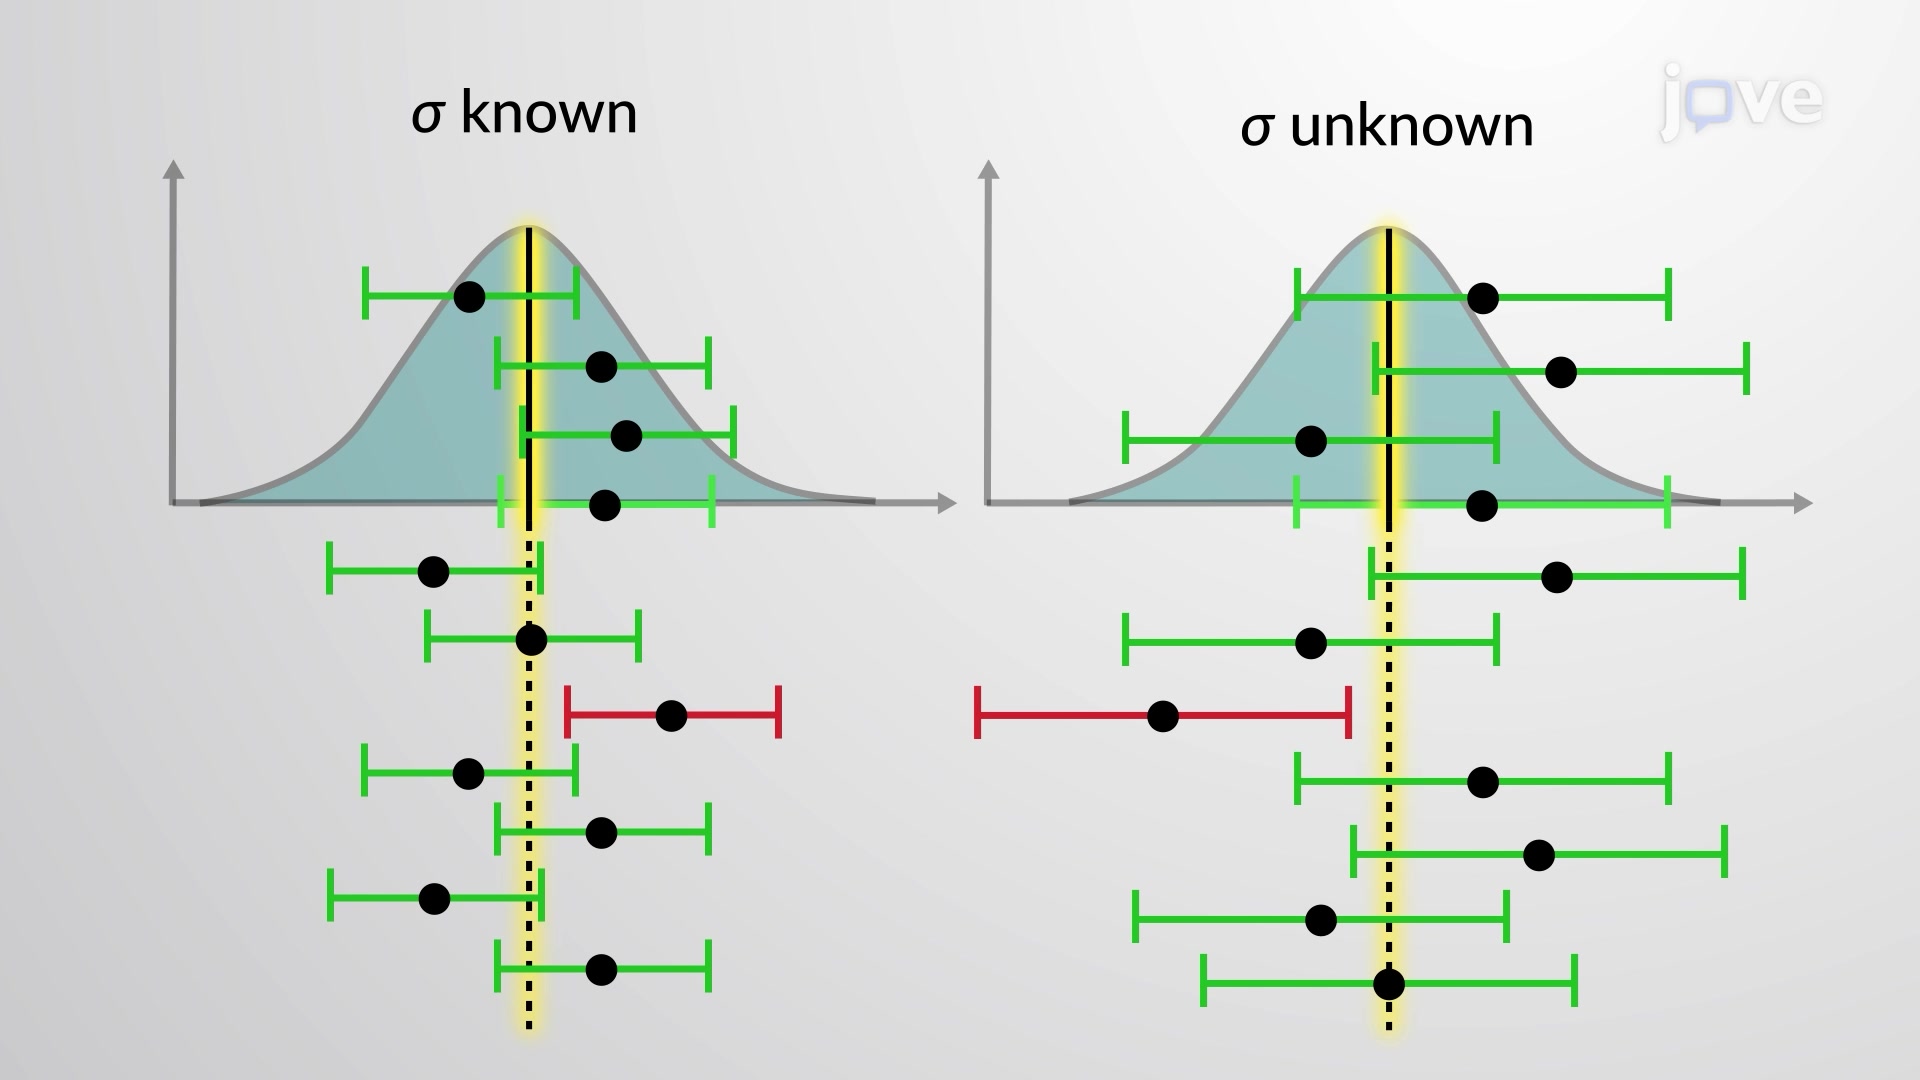
When population standard deviation is known-a rare but important scenario-we use the z-distribution to construct confidence intervals. The formula becomes: sample mean ± (z-critical value × standard error). For a 95% confidence level, the z-critical value is 1.96. This means that if the FDA tests drug effectiveness with known population variance, they can create precise confidence intervals for mean treatment effects.
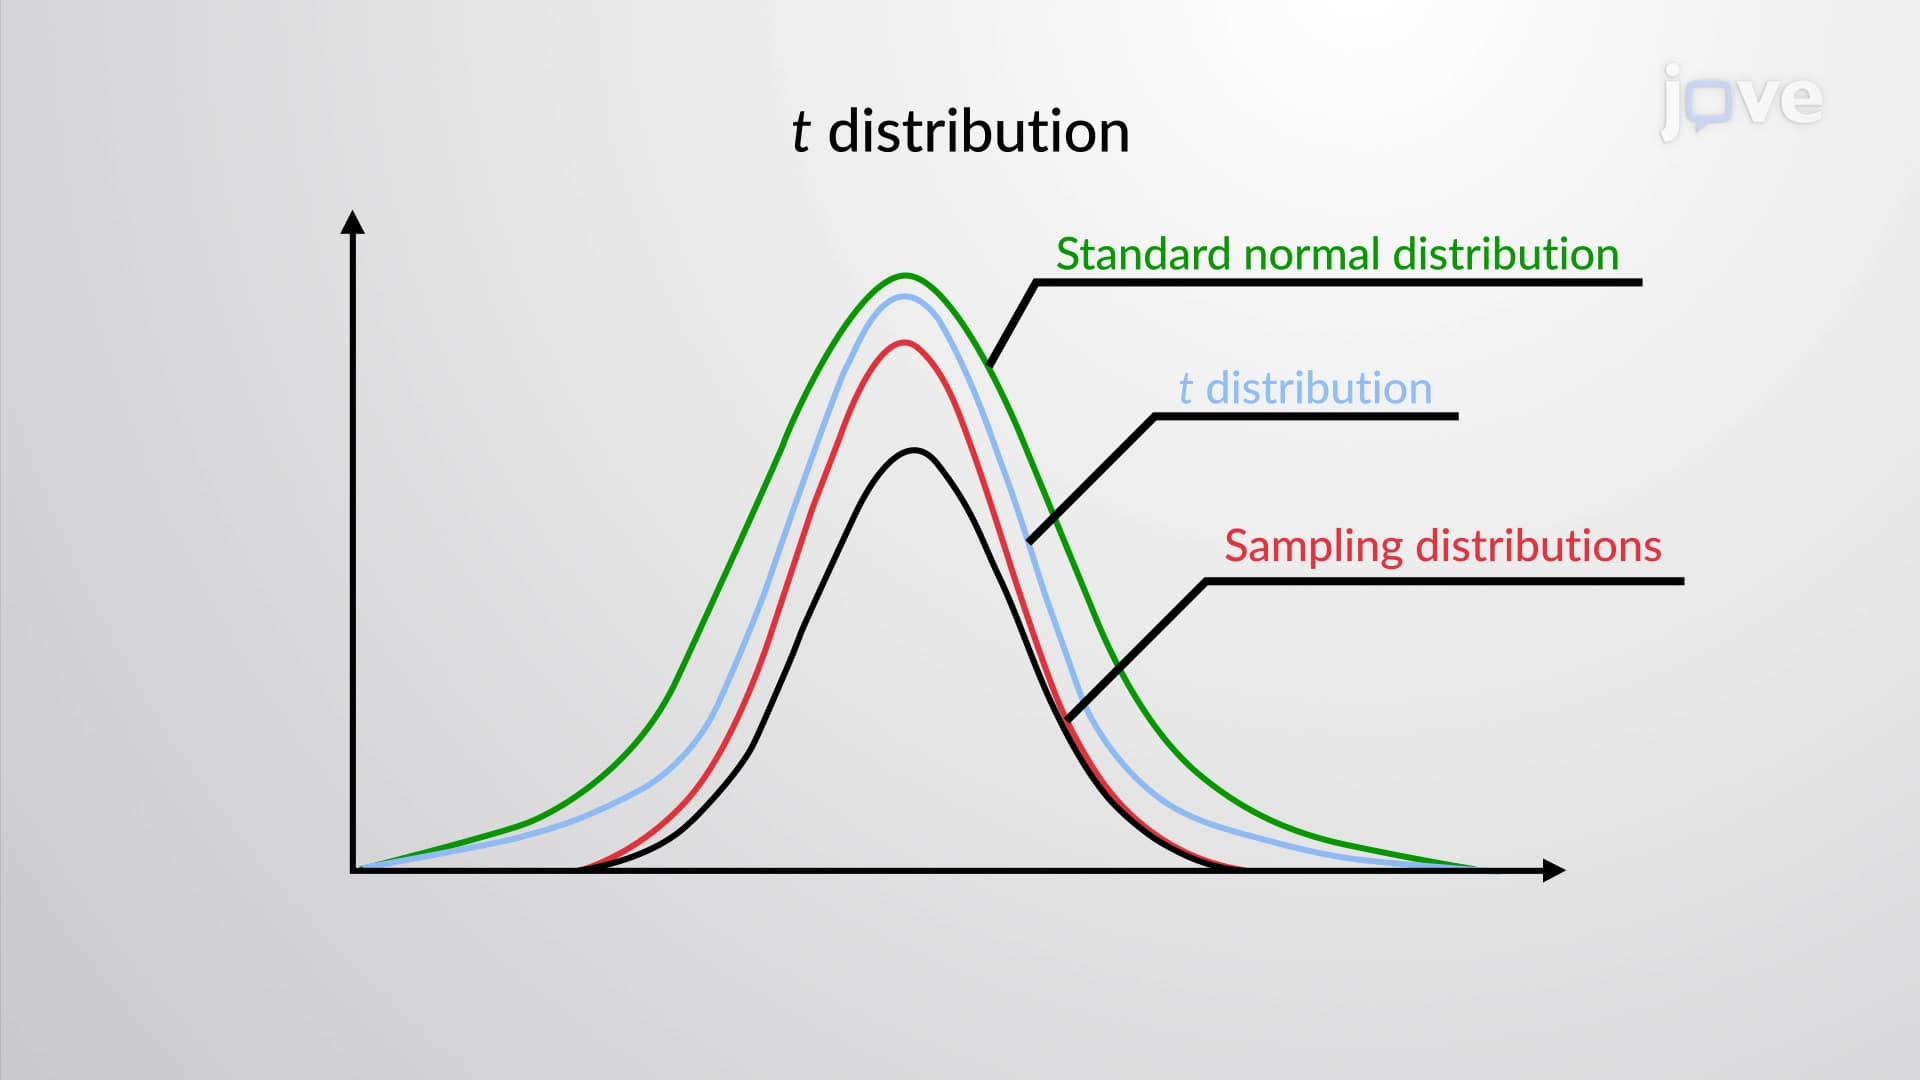
In practice, population standard deviation is almost always unknown, making the t-distribution essential for confidence interval for estimating population mean calculations. Unlike the z-distribution, t-distribution accounts for additional uncertainty from estimating population variance. A medical researcher studying blood pressure medication effectiveness typically uses t-intervals because population variance is unknown. While these intervals are wider than z-intervals, they provide equally reliable population mean estimates.
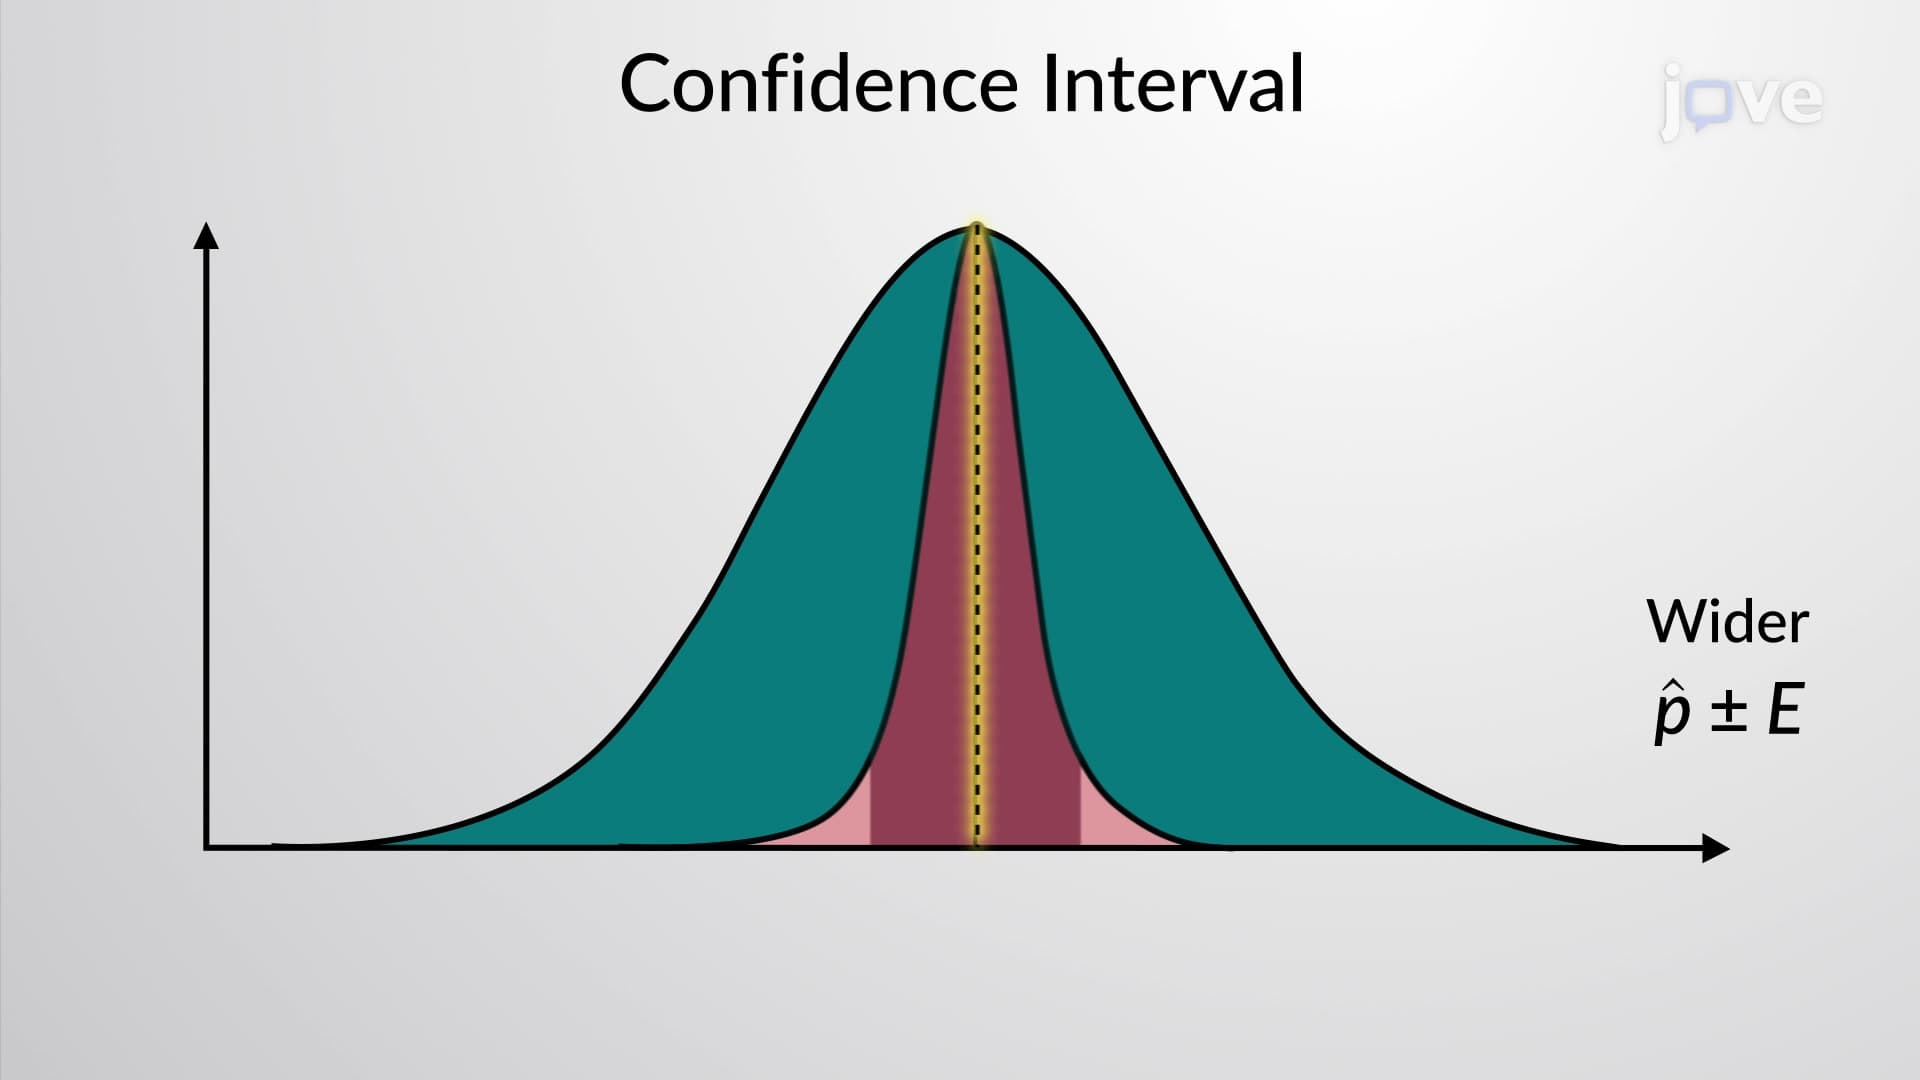
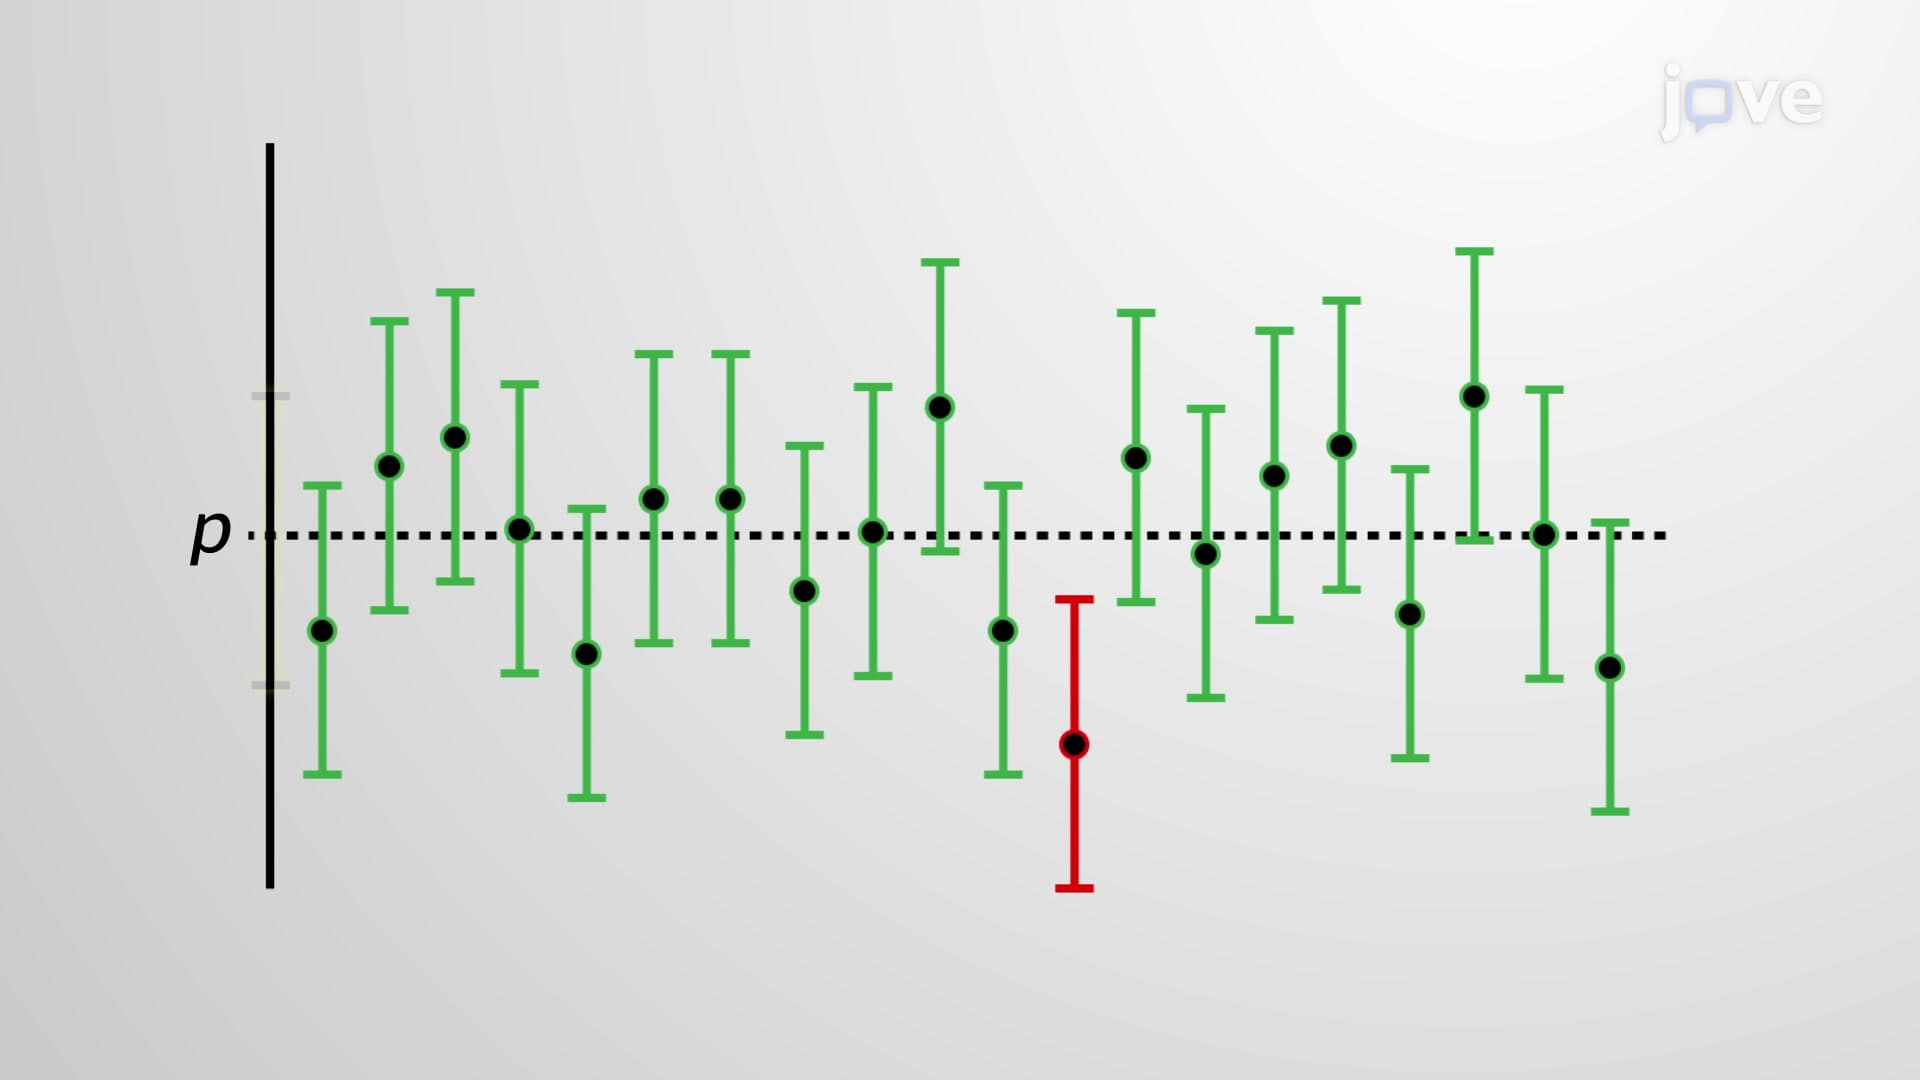
A 95% confidence level means that if researchers repeated their sampling process 100 times, approximately 95 of those intervals would contain the true population mean. This interpretation proves crucial for AP Statistics students and college statistics courses. Higher confidence levels (99% vs. 95%) create wider intervals, reflecting the trade-off between certainty and precision. The Consumer Confidence Index, published monthly by the Conference Board, exemplifies this principle in economic forecasting.
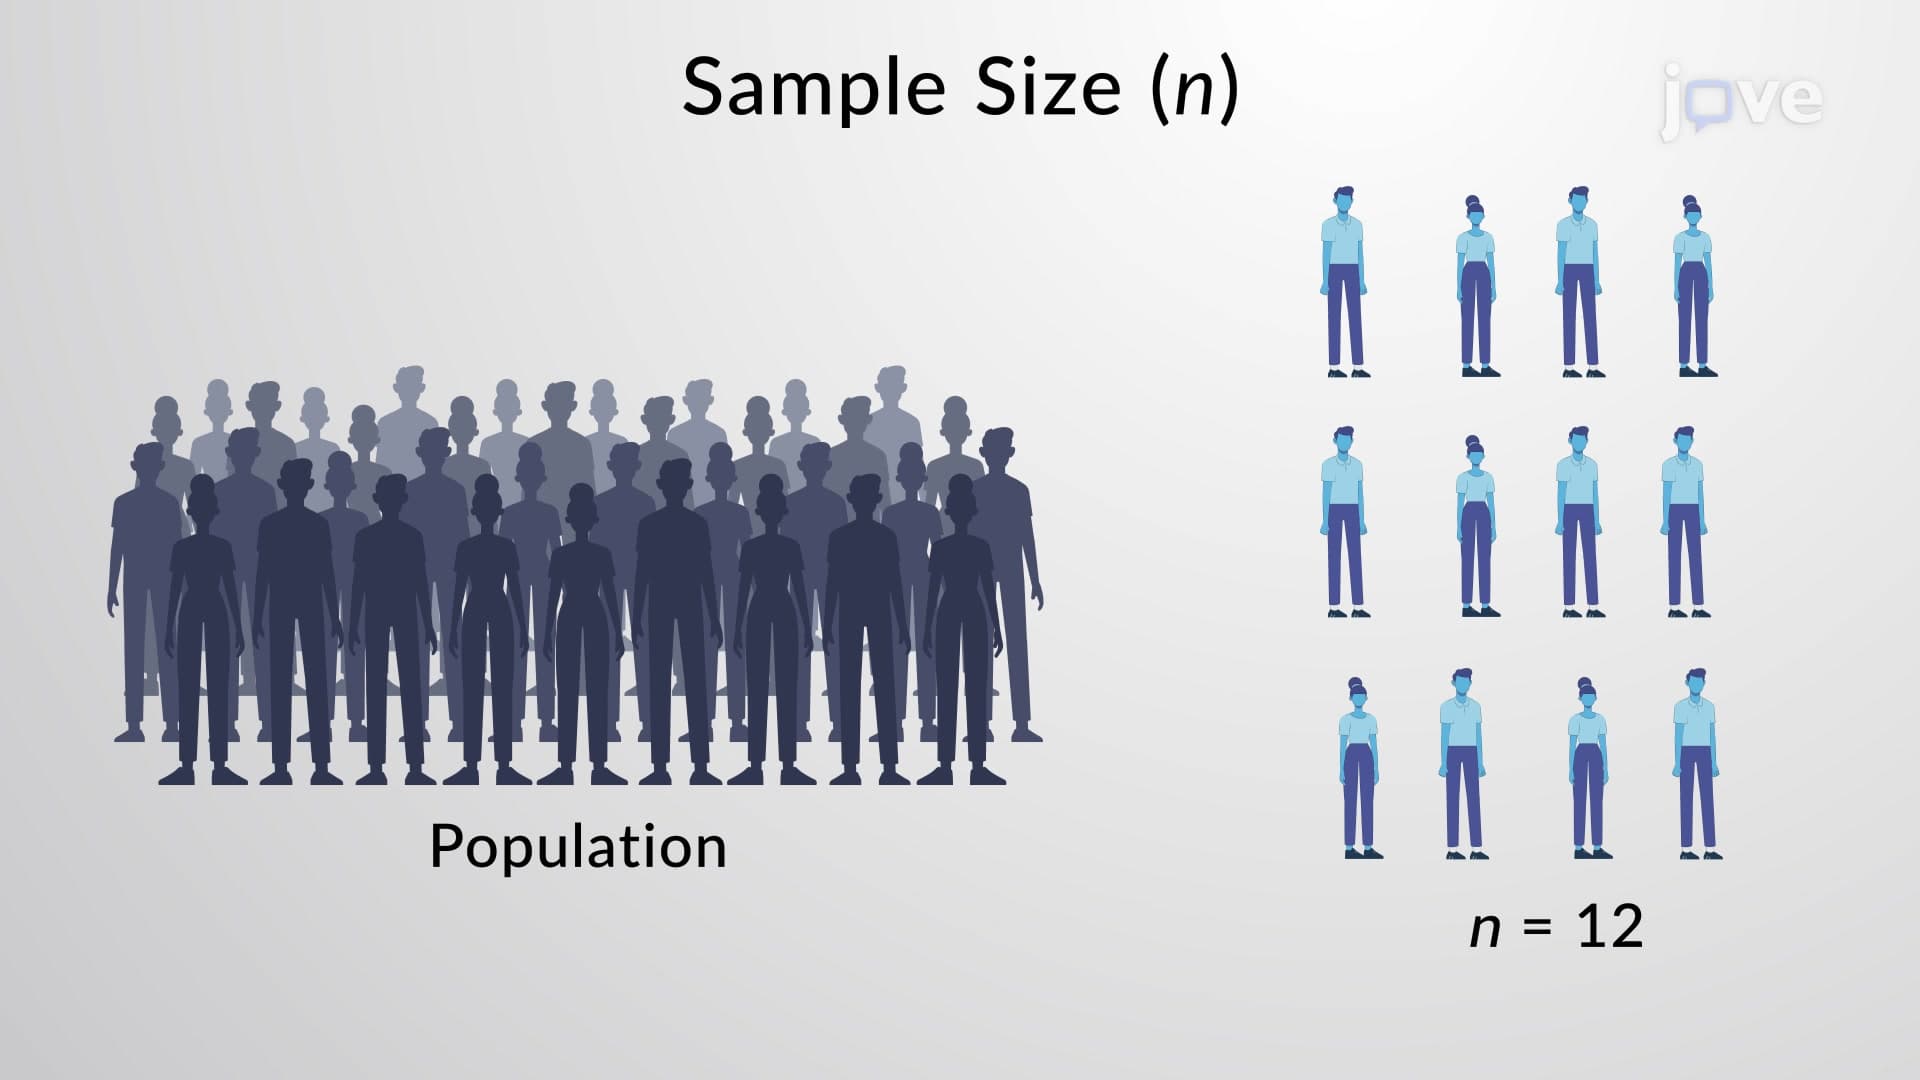
Quality control managers use confidence intervals to estimate mean product specifications, while healthcare administrators apply them to patient satisfaction scores. The SAT and MCAT frequently test these concepts through word problems involving pharmaceutical trials, manufacturing processes, and survey research. Understanding when sample sizes affect interval width helps students tackle complex exam scenarios confidently.
Related Micro-courses