Loading video…

 11 Concepts
 85.6K views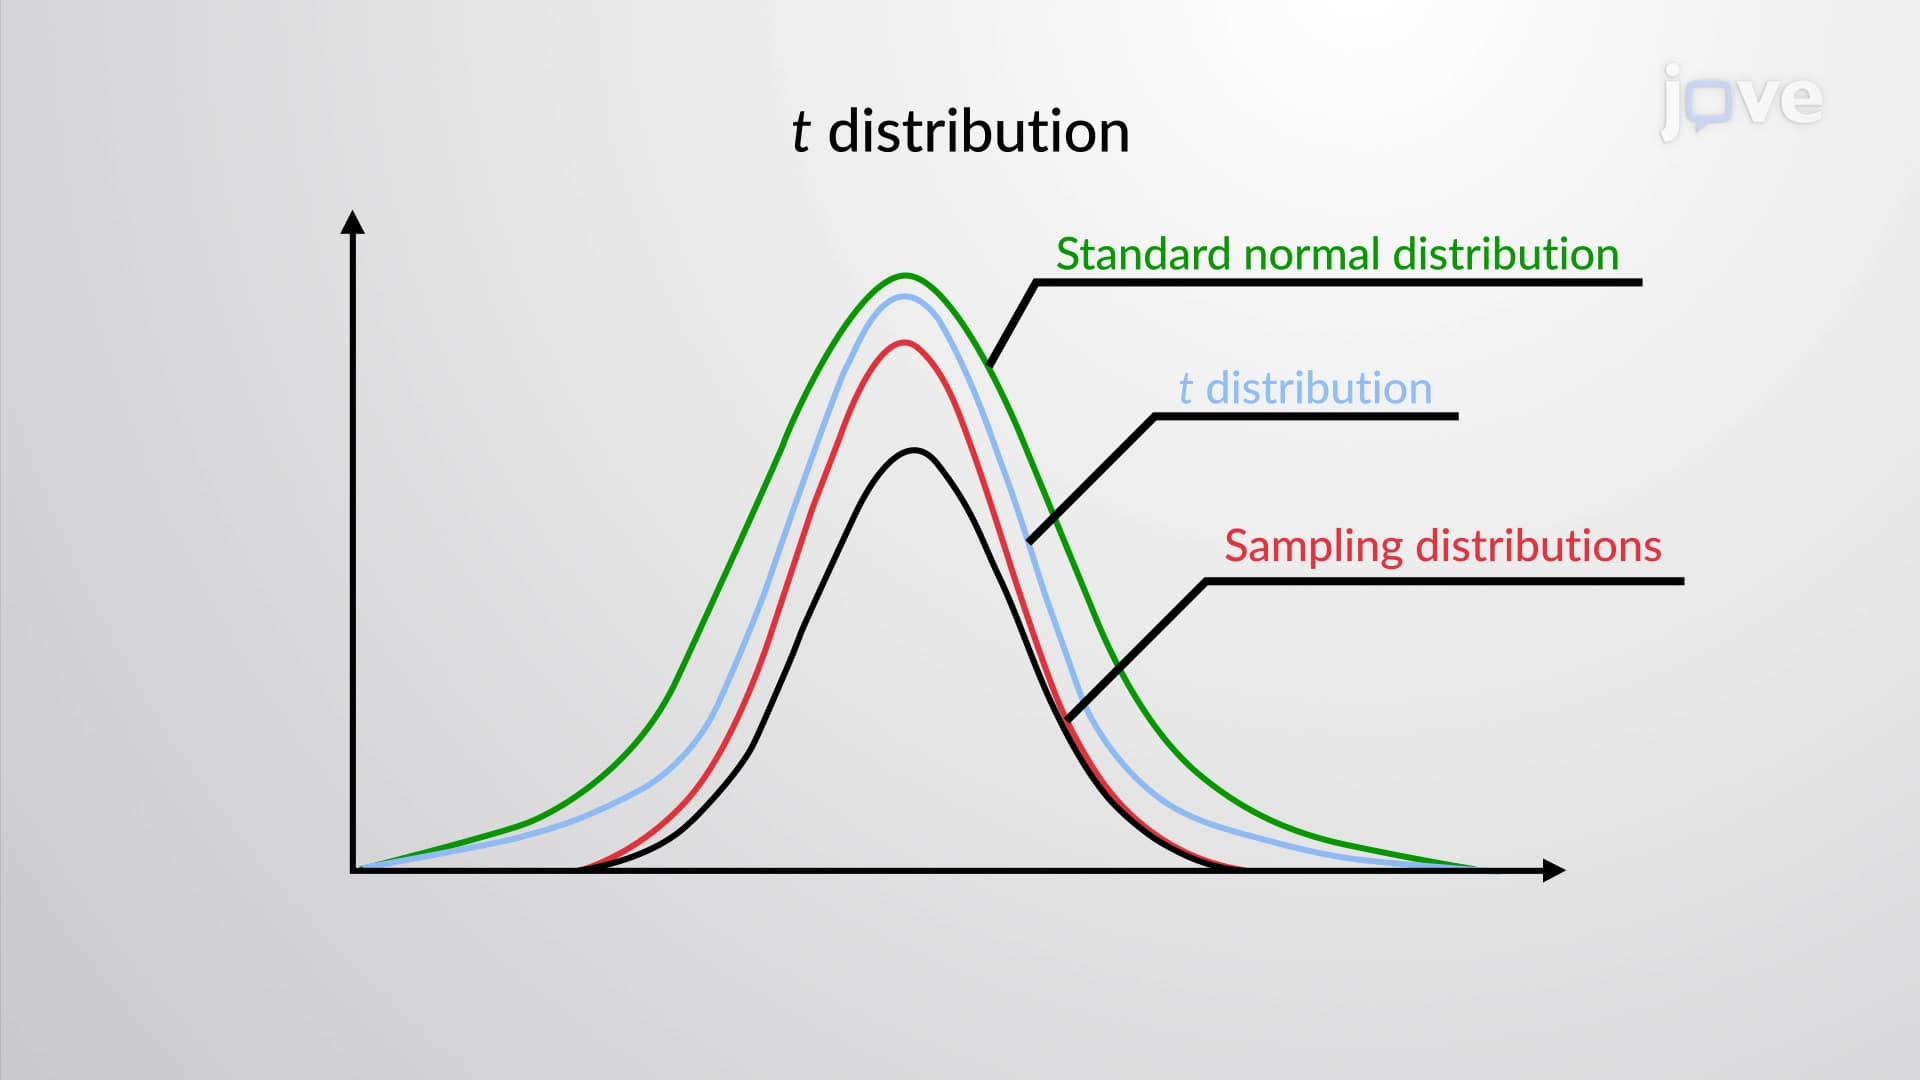

Video Summary: Estimating the Population Mean with Unknown Standard Deviation
Did you know that 90% of real-world statistical analysis involves estimating population parameters without knowing the true standard deviation? Estimating the population mean with unknown standard deviation is a fundamental skill that statisticians use daily, from analyzing SAT score distributions across US high schools to determining average housing prices in specific metropolitan areas. Unlike simpler cases where population parameters are known, this approach requires the t-distribution and sample standard deviation to create reliable confidence intervals. Watch the full video on JoVE Coach to master this concept with expert-led visuals and step-by-step explanations.
In most real-world statistical scenarios, we face a fundamental challenge: we want to estimate a population mean, but we don't know the population's true standard deviation. This situation is far more common than textbook examples suggest. Consider analyzing average ACT scores across all US high schools or determining mean household income in a specific state-the population standard deviation is rarely available.
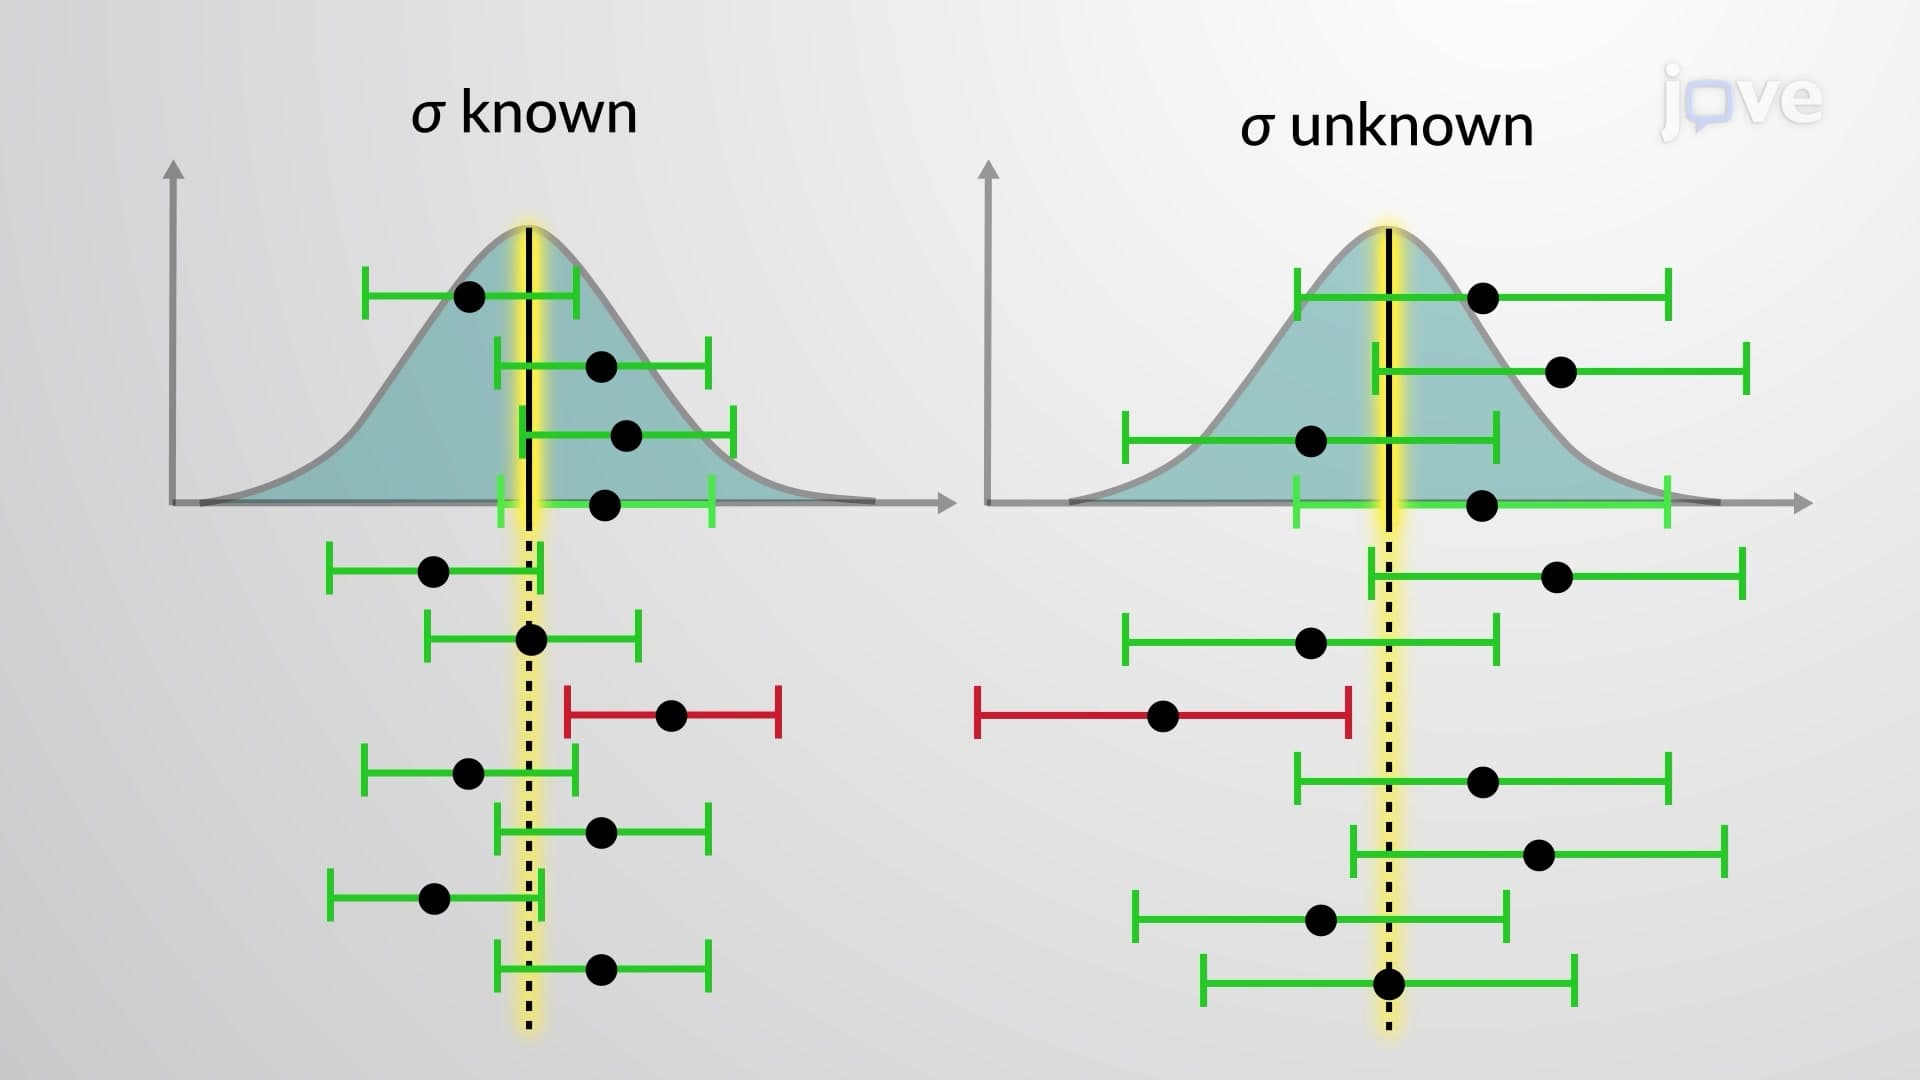
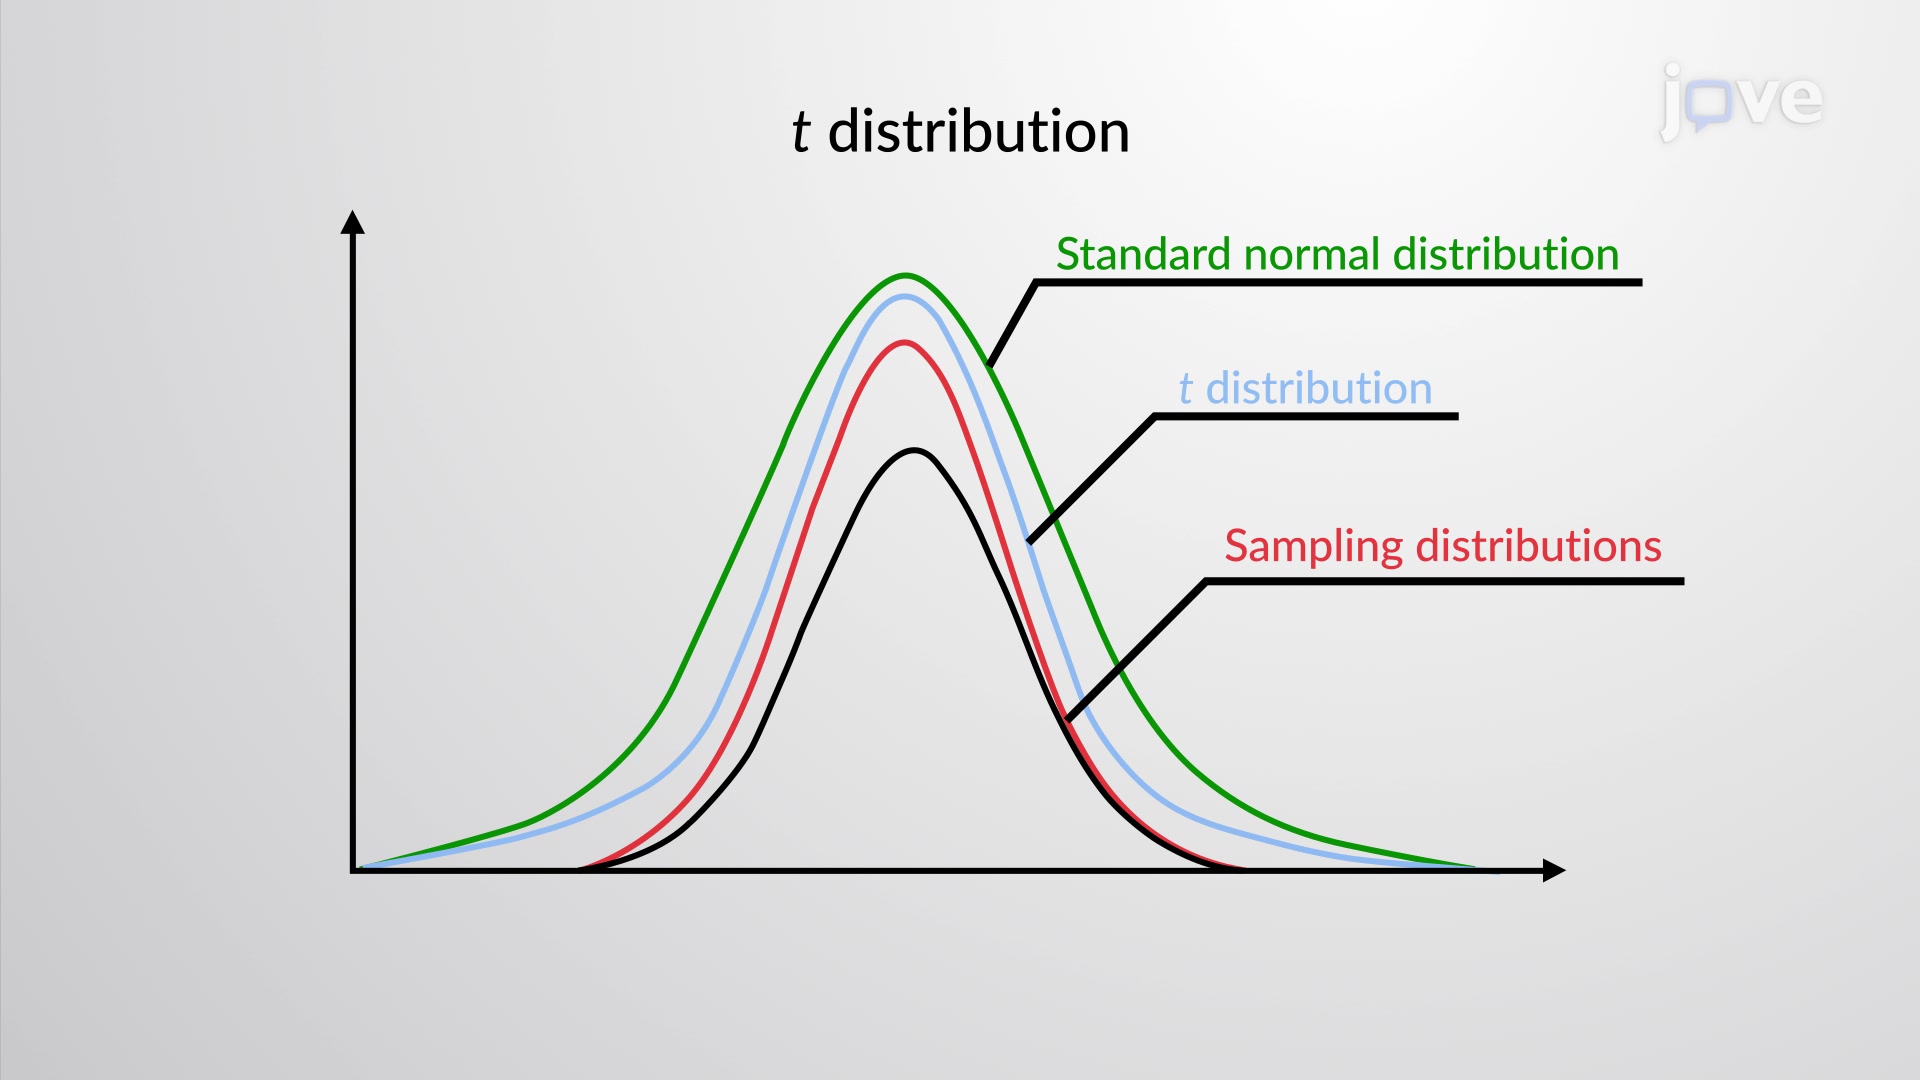
When estimating the population mean with unknown standard deviation, statisticians rely on the t-distribution instead of the standard normal (z) distribution. The t-distribution accounts for the additional uncertainty introduced when we estimate the population standard deviation using sample data. This distribution was developed by William Sealy Gosset in 1908 while working for Guinness Brewery, addressing practical quality control challenges.
The critical difference lies in the margin of error calculation. Instead of using a z-value with the known population standard deviation, we use a t-value with the sample standard deviation. The formula becomes: Margin of Error = t(α/2) × (s/√n), where s represents the sample standard deviation and t(α/2) is the critical t-value.
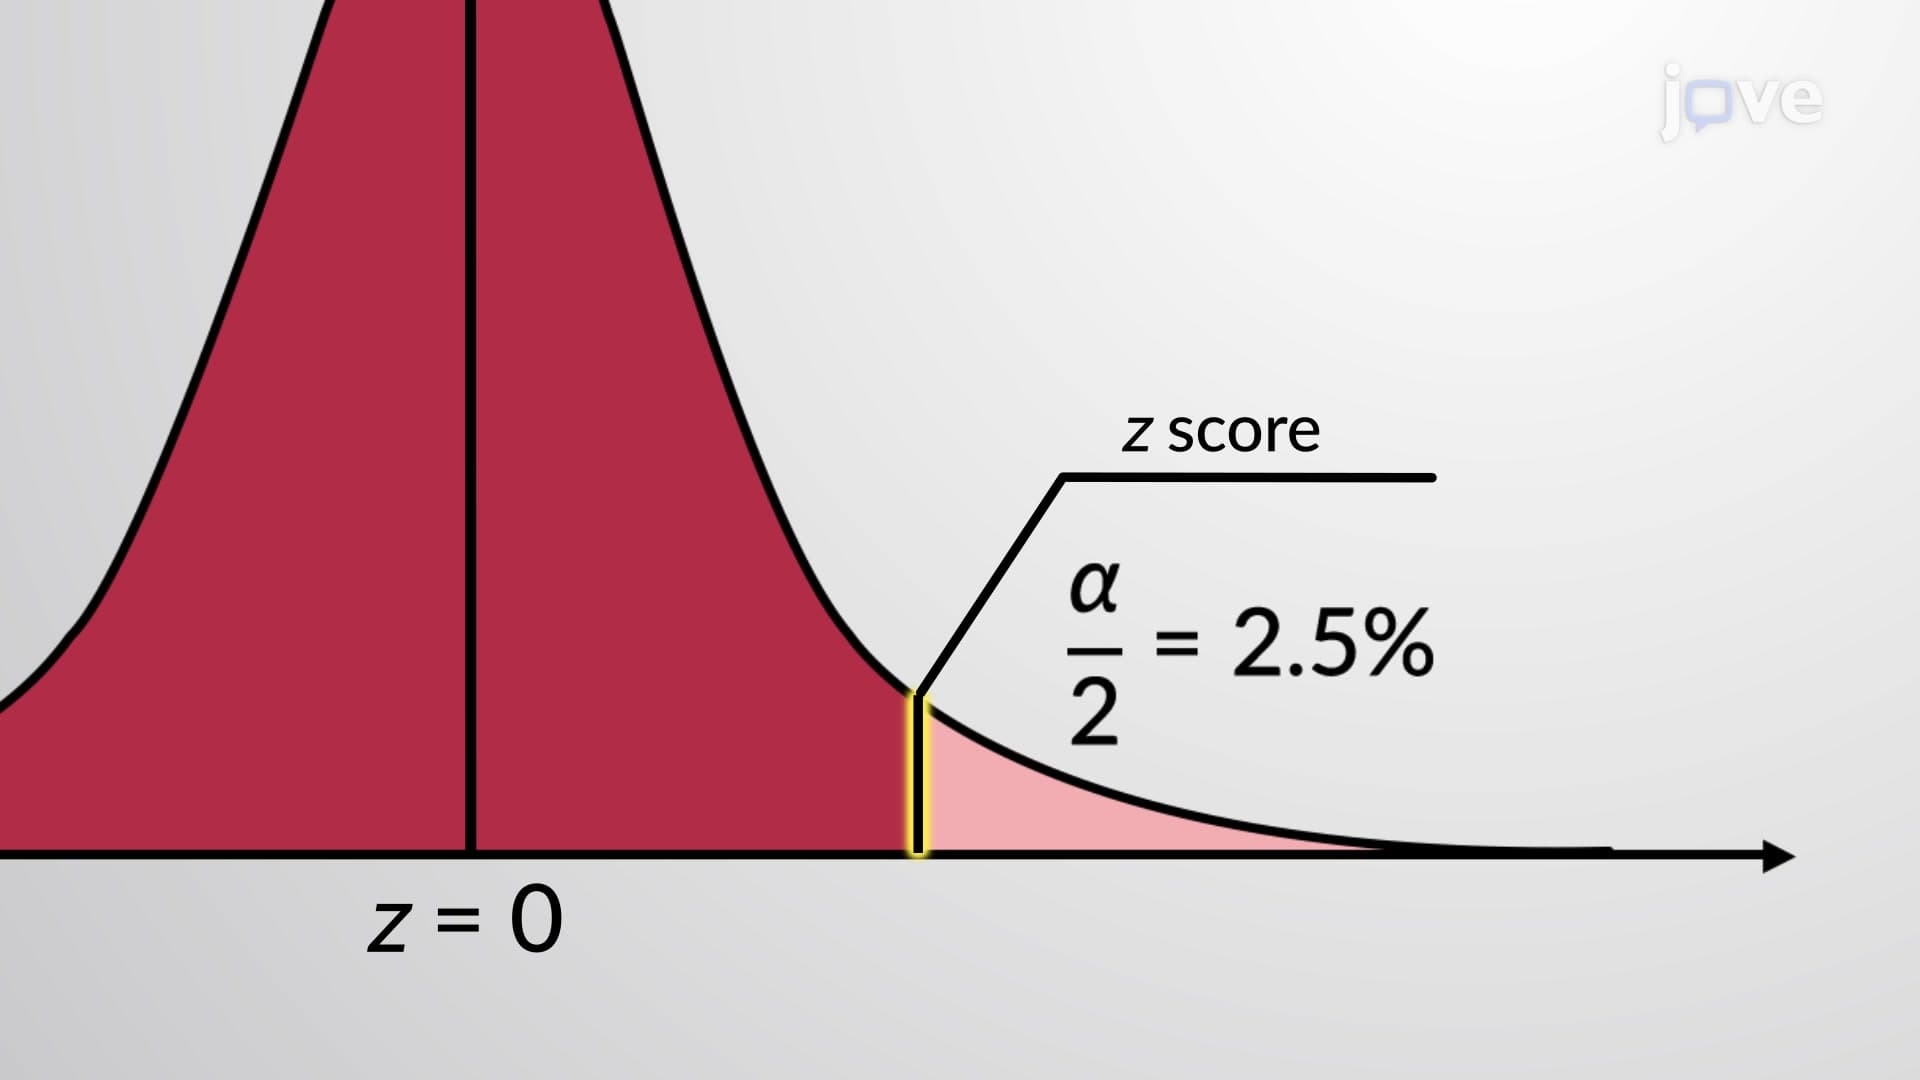
Unlike z-values, critical t-values vary with sample size through degrees of freedom (df = n-1). Smaller samples produce larger t-values, creating wider confidence intervals that reflect greater uncertainty. For instance, with a 95% confidence level and 10 degrees of freedom, the critical t-value is approximately 2.228, compared to the corresponding z-value of 1.96. This difference acknowledges that smaller samples provide less reliable estimates of population parameters.
This concept frequently appears on AP Statistics exams, college statistics courses, and standardized tests like the MCAT. Students often encounter problems involving quality control in manufacturing, medical research with limited sample sizes, or market research scenarios. For example, a pharmaceutical company testing a new drug's effectiveness on blood pressure might collect data from 25 patients, requiring t-distribution methods since the population standard deviation for blood pressure response is unknown.
The key assumptions for valid application include: sample data should be approximately normally distributed (especially important for smaller samples), observations must be independent, and while there's no strict minimum sample size, samples over 30 provide more reliable results due to the Central Limit Theorem.
Related Micro-courses