Loading video…


 11 Concepts
 85.6K views

Video Summary: Sample Proportion and Population Proportion Explained
Did you know that when Gallup polls just 1,000 Americans to predict presidential elections, they can accurately forecast outcomes for 250+ million eligible voters? Sample proportion and population proportion form the mathematical foundation behind this remarkable statistical power. Consider how Netflix determines viewer preferences from analyzing viewing patterns of select subscribers, then applies those insights across millions of users nationwide. Sample Proportion And Population Proportion Explained reveals how researchers transform limited data into reliable predictions about entire populations. Watch the full video on JoVE Coach to master this concept with expert-led visuals and step-by-step explanations.
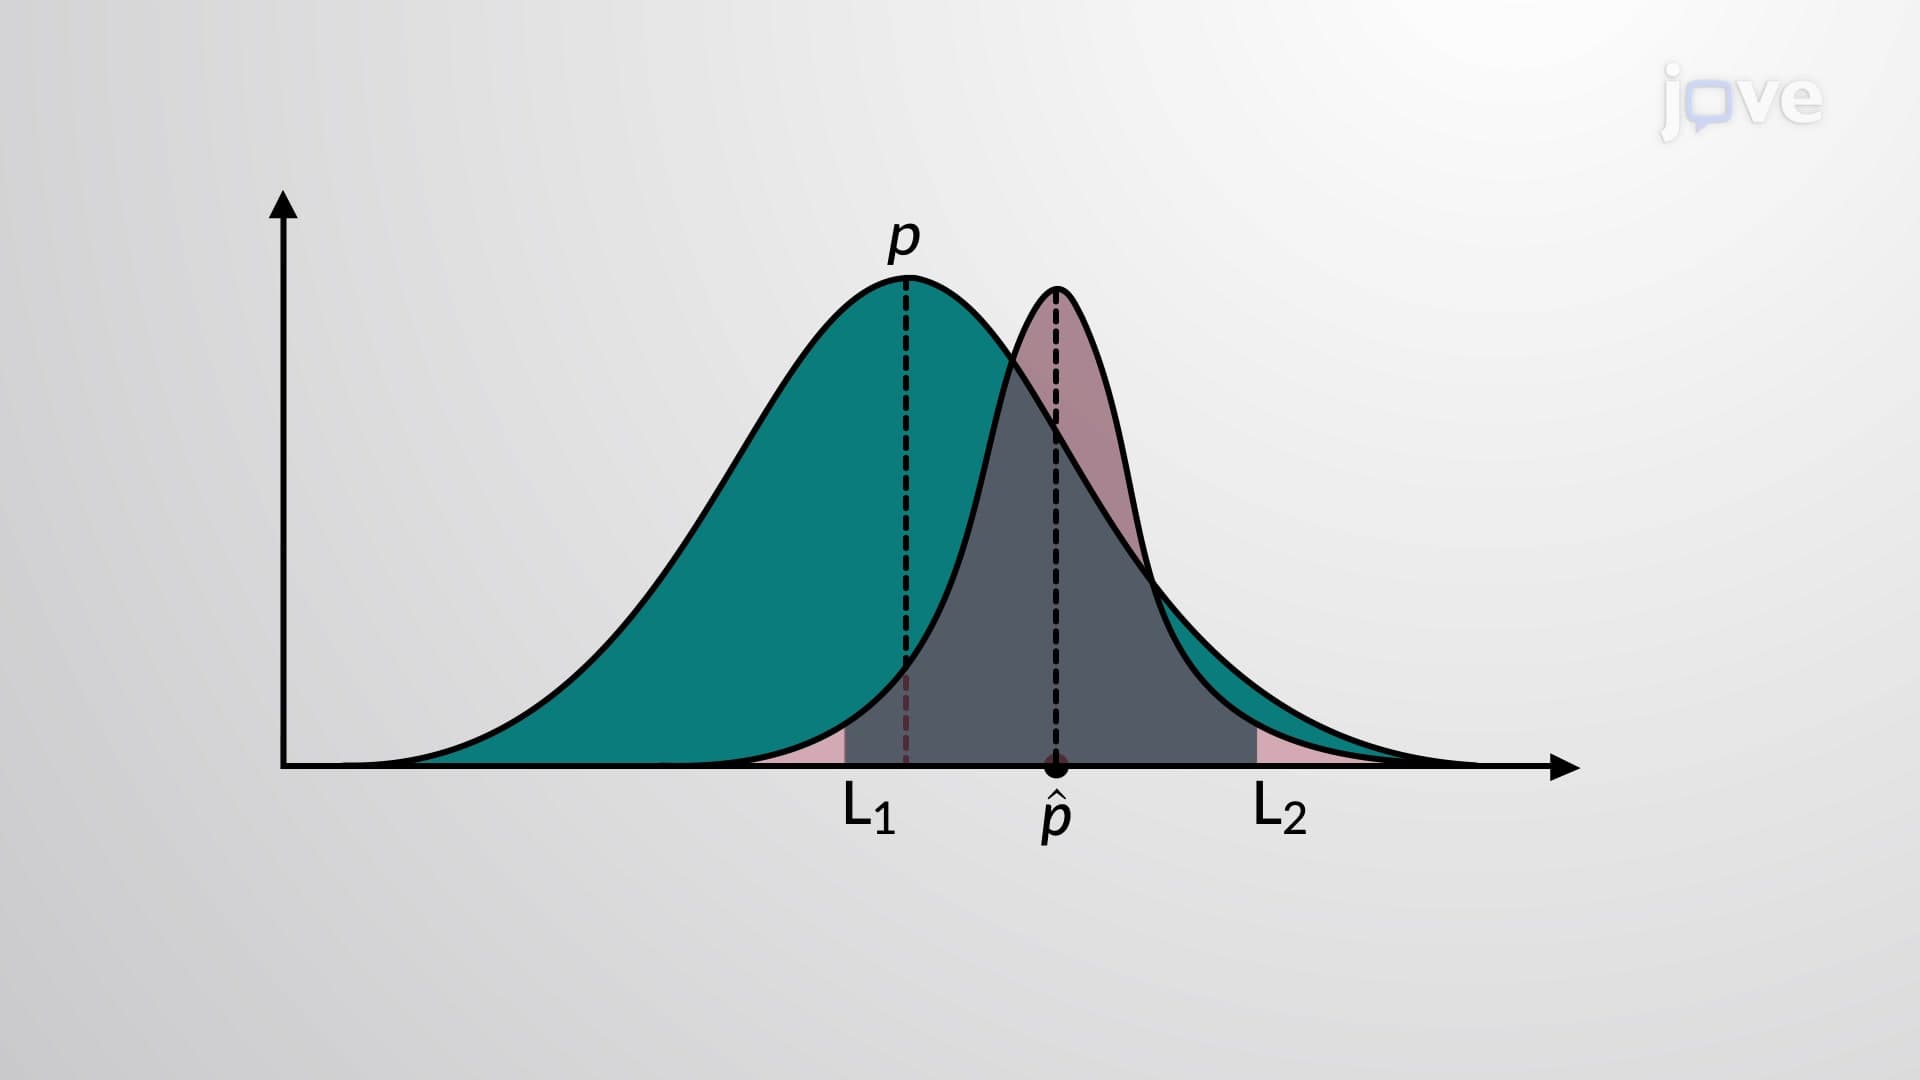
Sample proportion and population proportion represent one of statistics' most practical applications. The sample proportion (denoted as p̂, pronounced "p-hat") measures the fraction of individuals in a sample exhibiting a specific characteristic. The population proportion (denoted as p) represents the true fraction of individuals with that characteristic across the entire population.
Consider a concrete example: If 340 out of 500 randomly selected California high school students report using social media daily, the sample proportion equals 340/500 = 0.68 or 68%. This sample proportion serves as our best estimate for the population proportion of all California high school students who use social media daily.
Point estimation involves using a single sample statistic to estimate an unknown population parameter. The sample proportion serves as a point estimator for the population proportion because it provides our "best guess" based on available data. In AP Statistics courses, students learn that sample proportions are unbiased estimators, meaning they neither consistently overestimate nor underestimate the true population proportion.
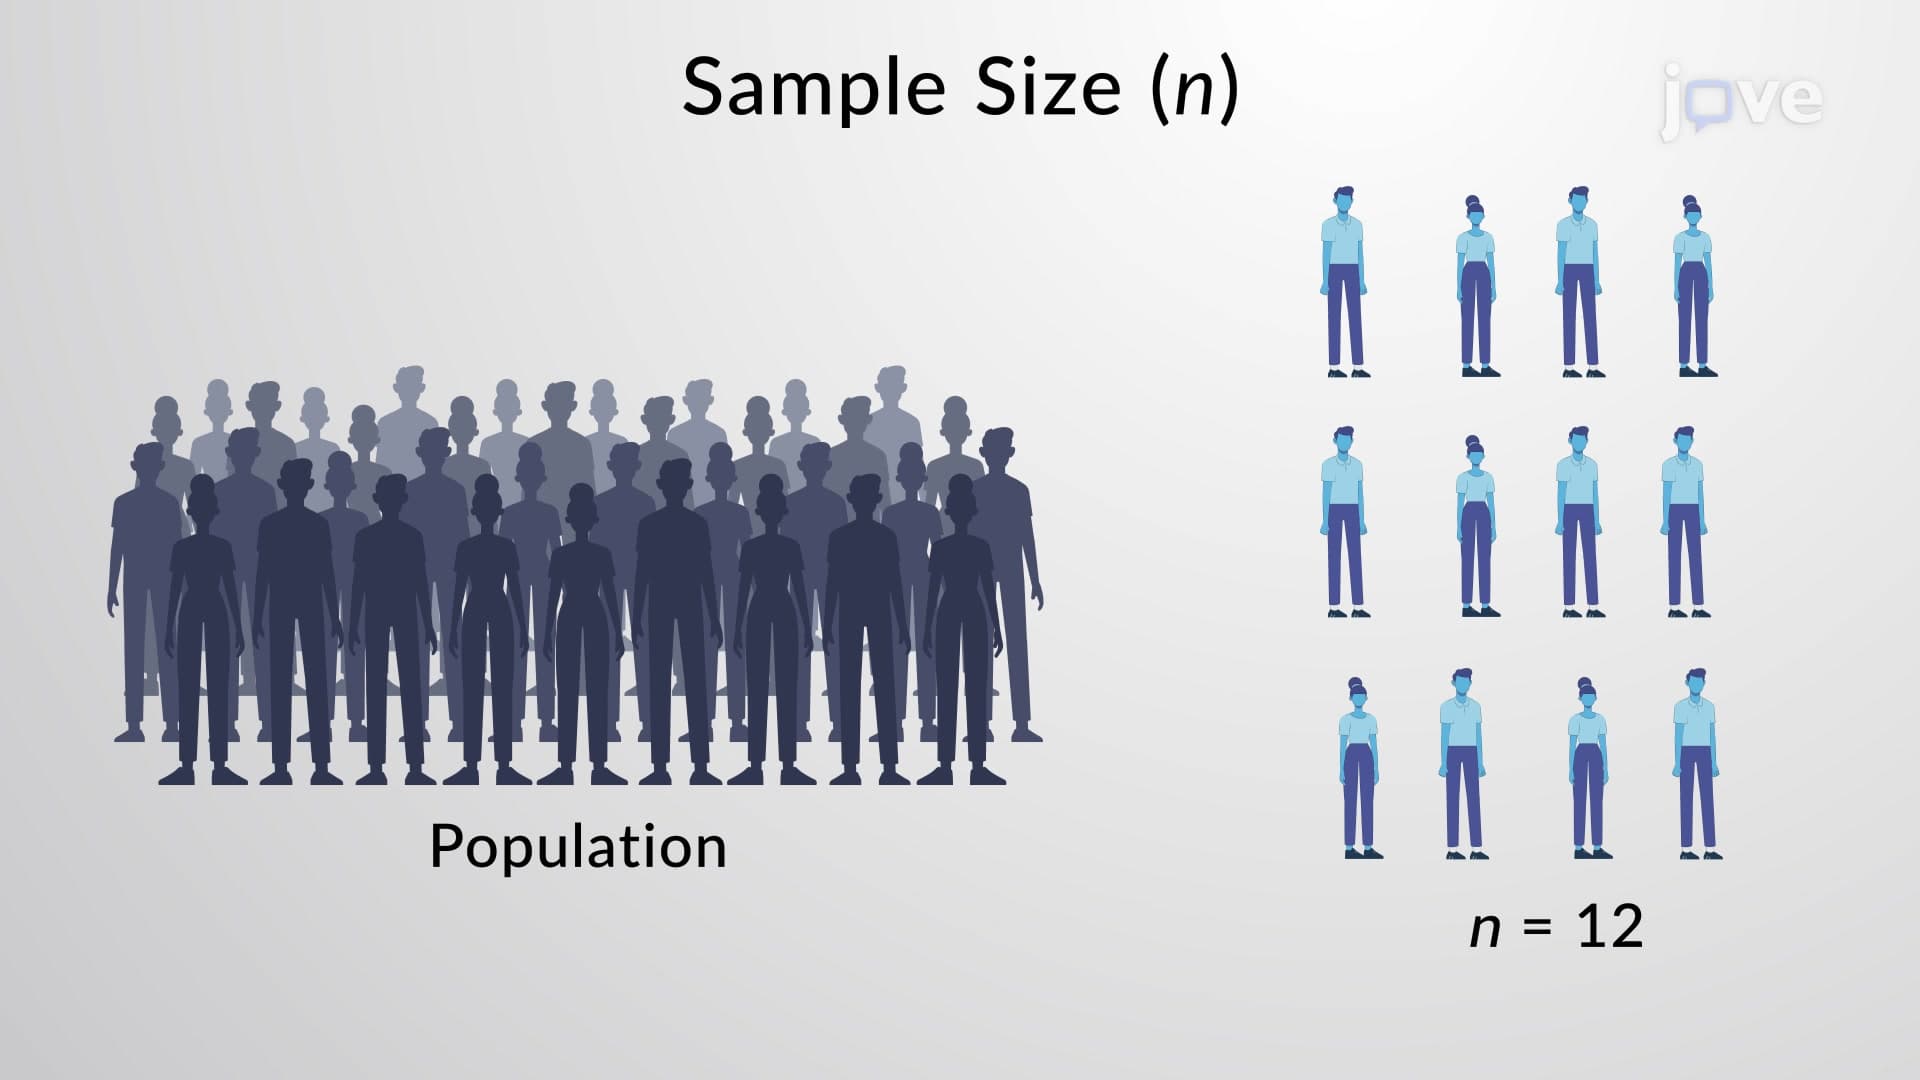
The accuracy of point estimates depends heavily on sample size and sampling methodology. Larger, randomly selected samples typically yield more reliable estimates. This principle explains why reputable polling organizations like Pew Research Center survey thousands of respondents rather than hundreds when gauging American public opinion.
Understanding how sample proportion and population proportion works proves essential for success in AP Statistics, college statistics courses, and standardized tests like the MCAT. Students encounter these concepts when analyzing everything from clinical trial success rates to consumer preference studies.
For instance, the FDA requires pharmaceutical companies to demonstrate drug effectiveness through clinical trials. If 180 out of 200 patients show improvement in a diabetes medication trial, the sample proportion (0.90) helps researchers estimate the drug's effectiveness across the broader diabetic population. This same logic applies to quality control in manufacturing, where companies test sample products to infer overall production quality.
Sample proportion and population proportion concepts become more complex when considering potential bias sources. Non-random sampling, response bias, or inadequate sample sizes can lead to misleading estimates. College statistics courses emphasize that representative sampling is crucial for valid inference.
Consider how political polling demonstrates these principles: A poll conducted exclusively via landline phones might underrepresent younger voters who primarily use cell phones, creating a biased sample proportion that poorly estimates the true population proportion of voter preferences.
Related Micro-courses