Loading video…

 11 Concepts
 85.6K views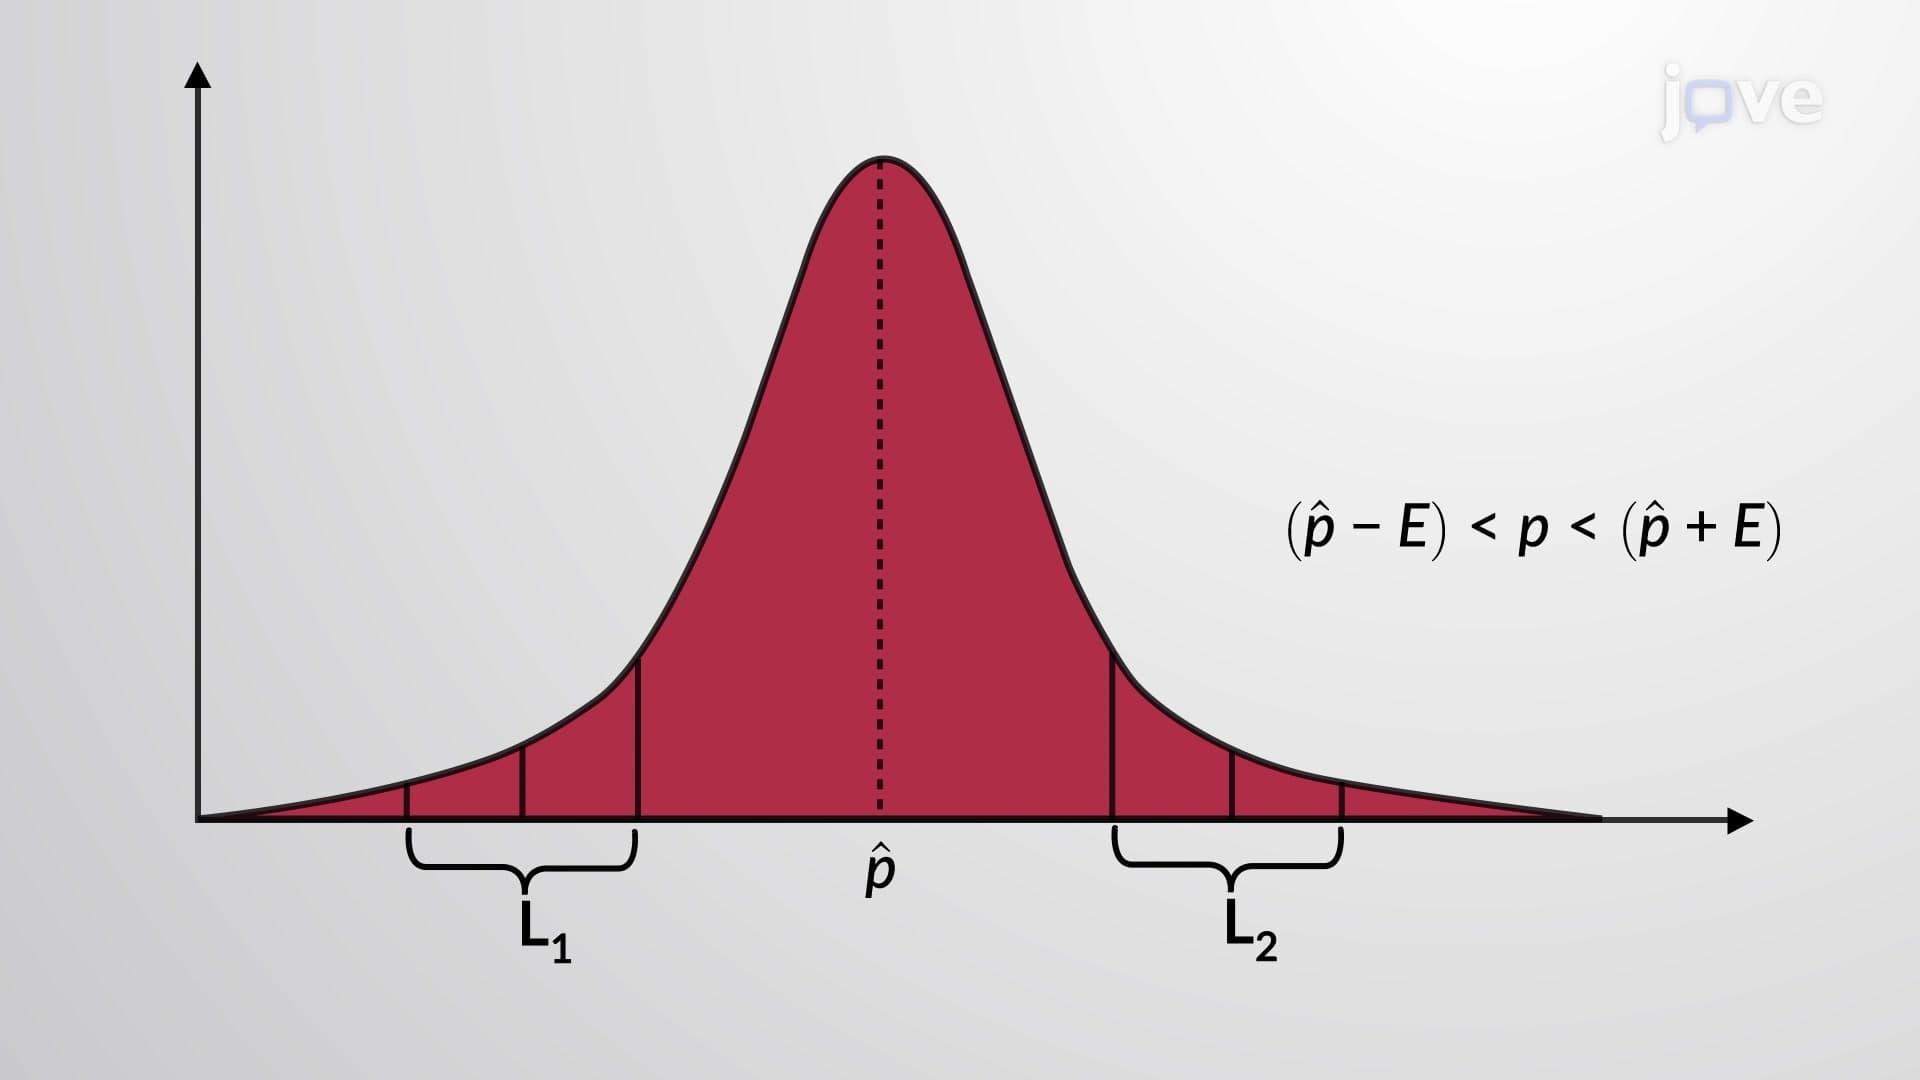

Video Summary: What Is Confidence Coefficient
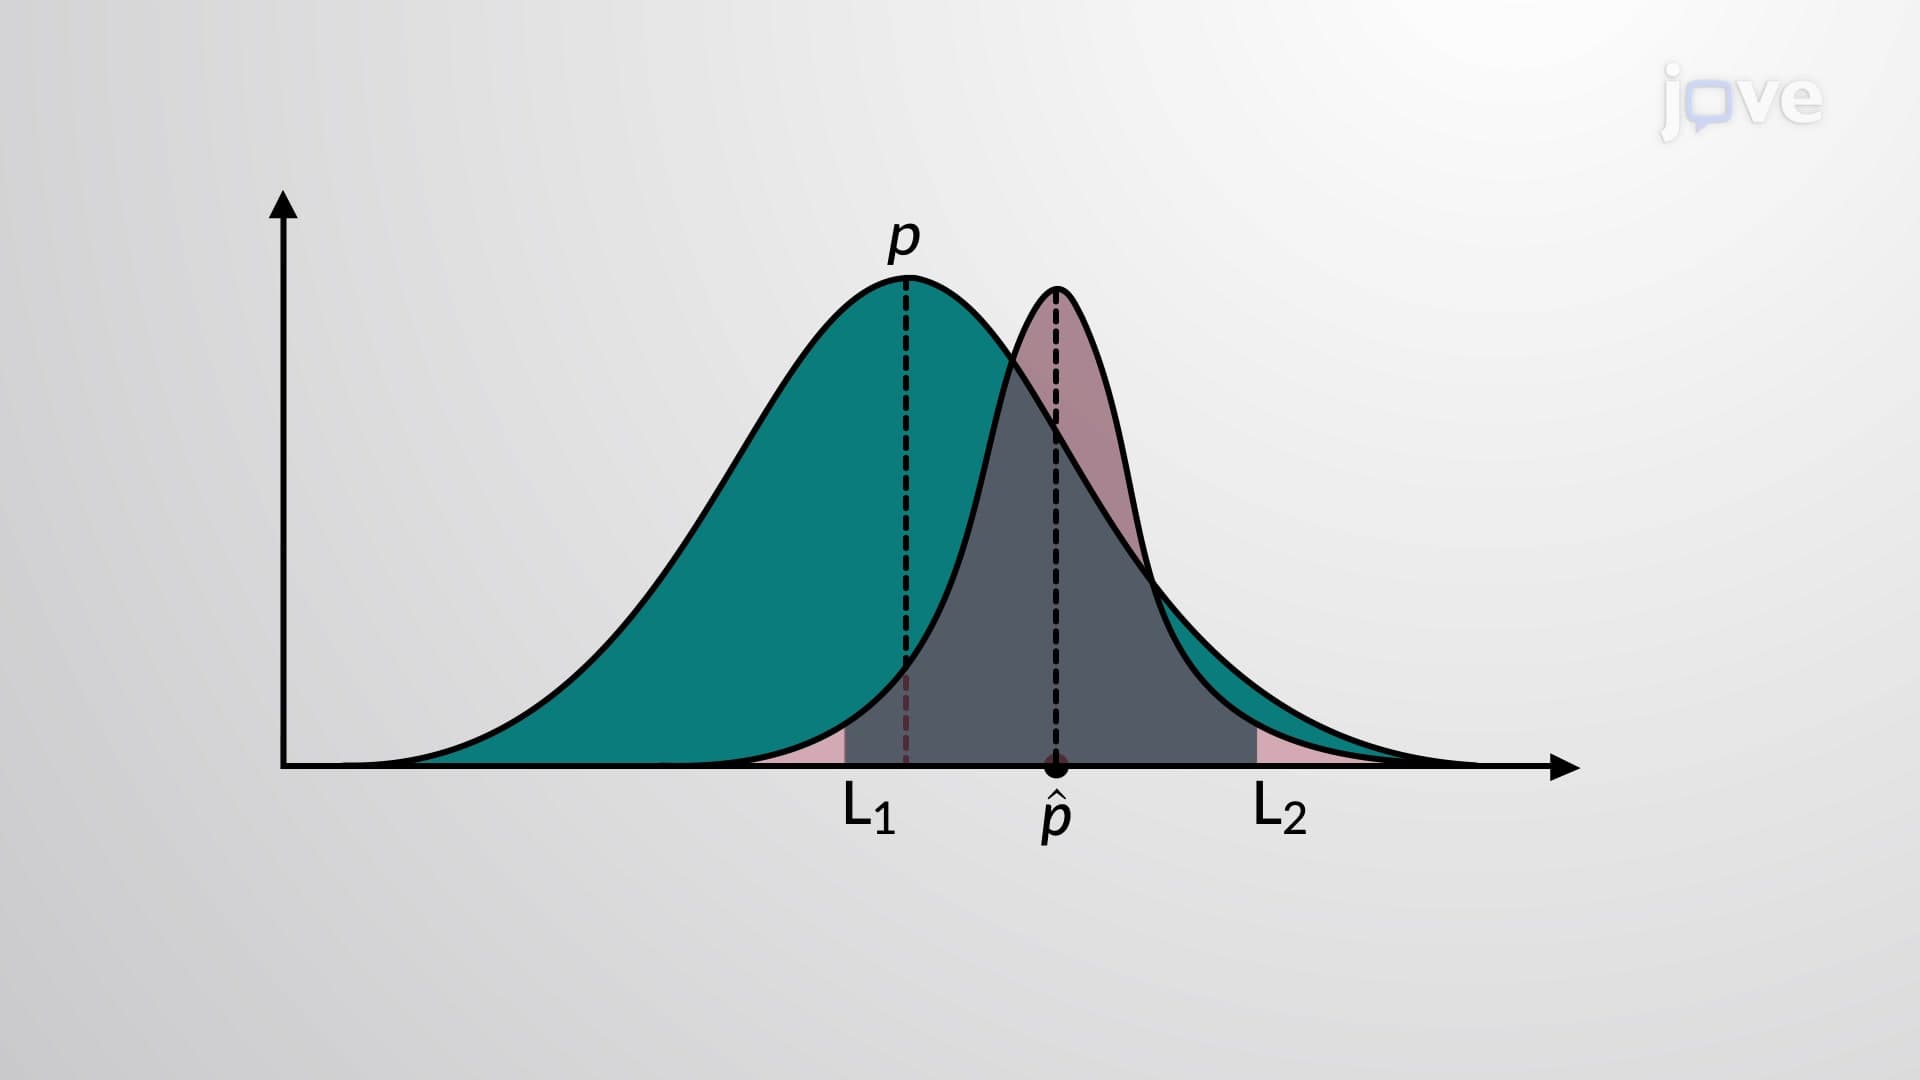
Ever wonder how pollsters predict election outcomes with such precision? The confidence coefficient is the statistical foundation that makes these predictions possible, representing the probability that calculated confidence intervals contain the true population parameter. For instance, when CNN reports a candidate leads by 5% with a 95% confidence level, that 95% is the confidence coefficient in action. This fundamental concept bridges theoretical statistics and real-world decision-making across fields from market research to medical trials. Watch the full video on JoVE Coach to master this concept with expert-led visuals and step-by-step explanations.
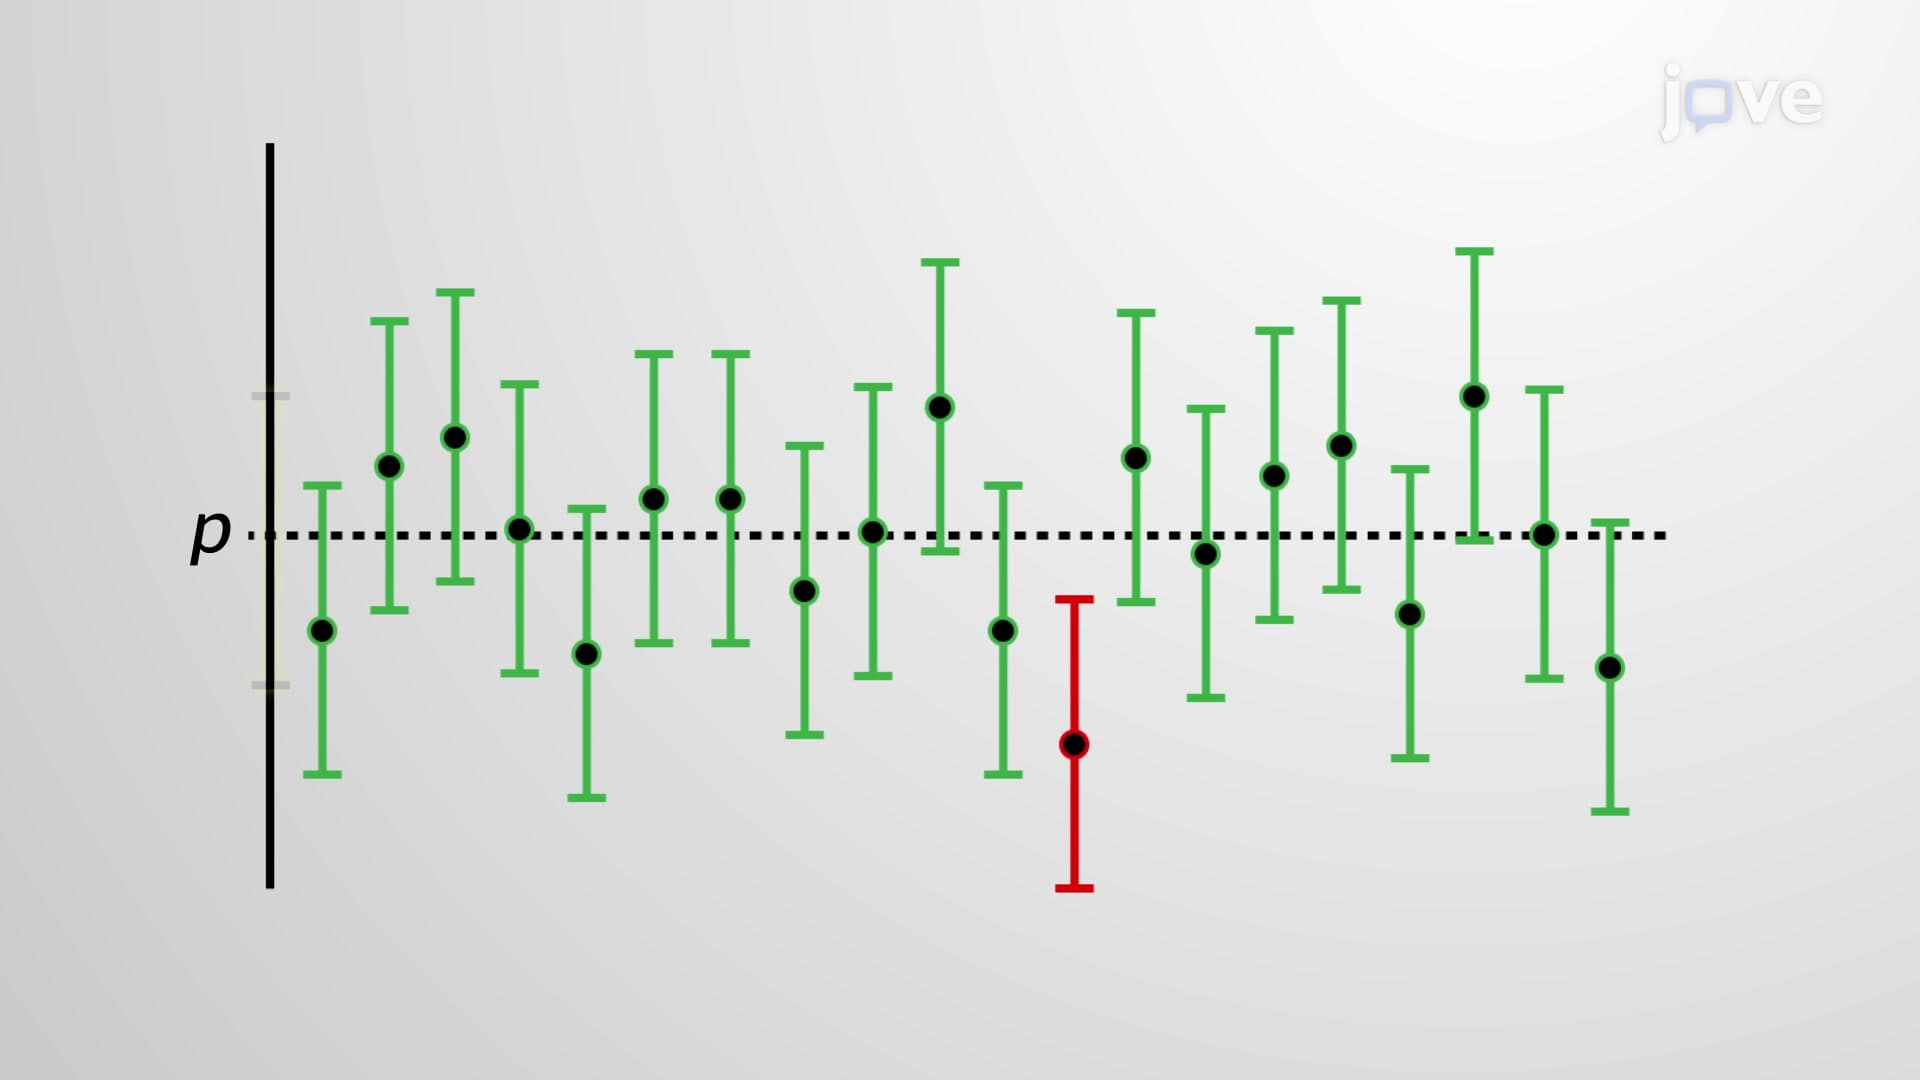
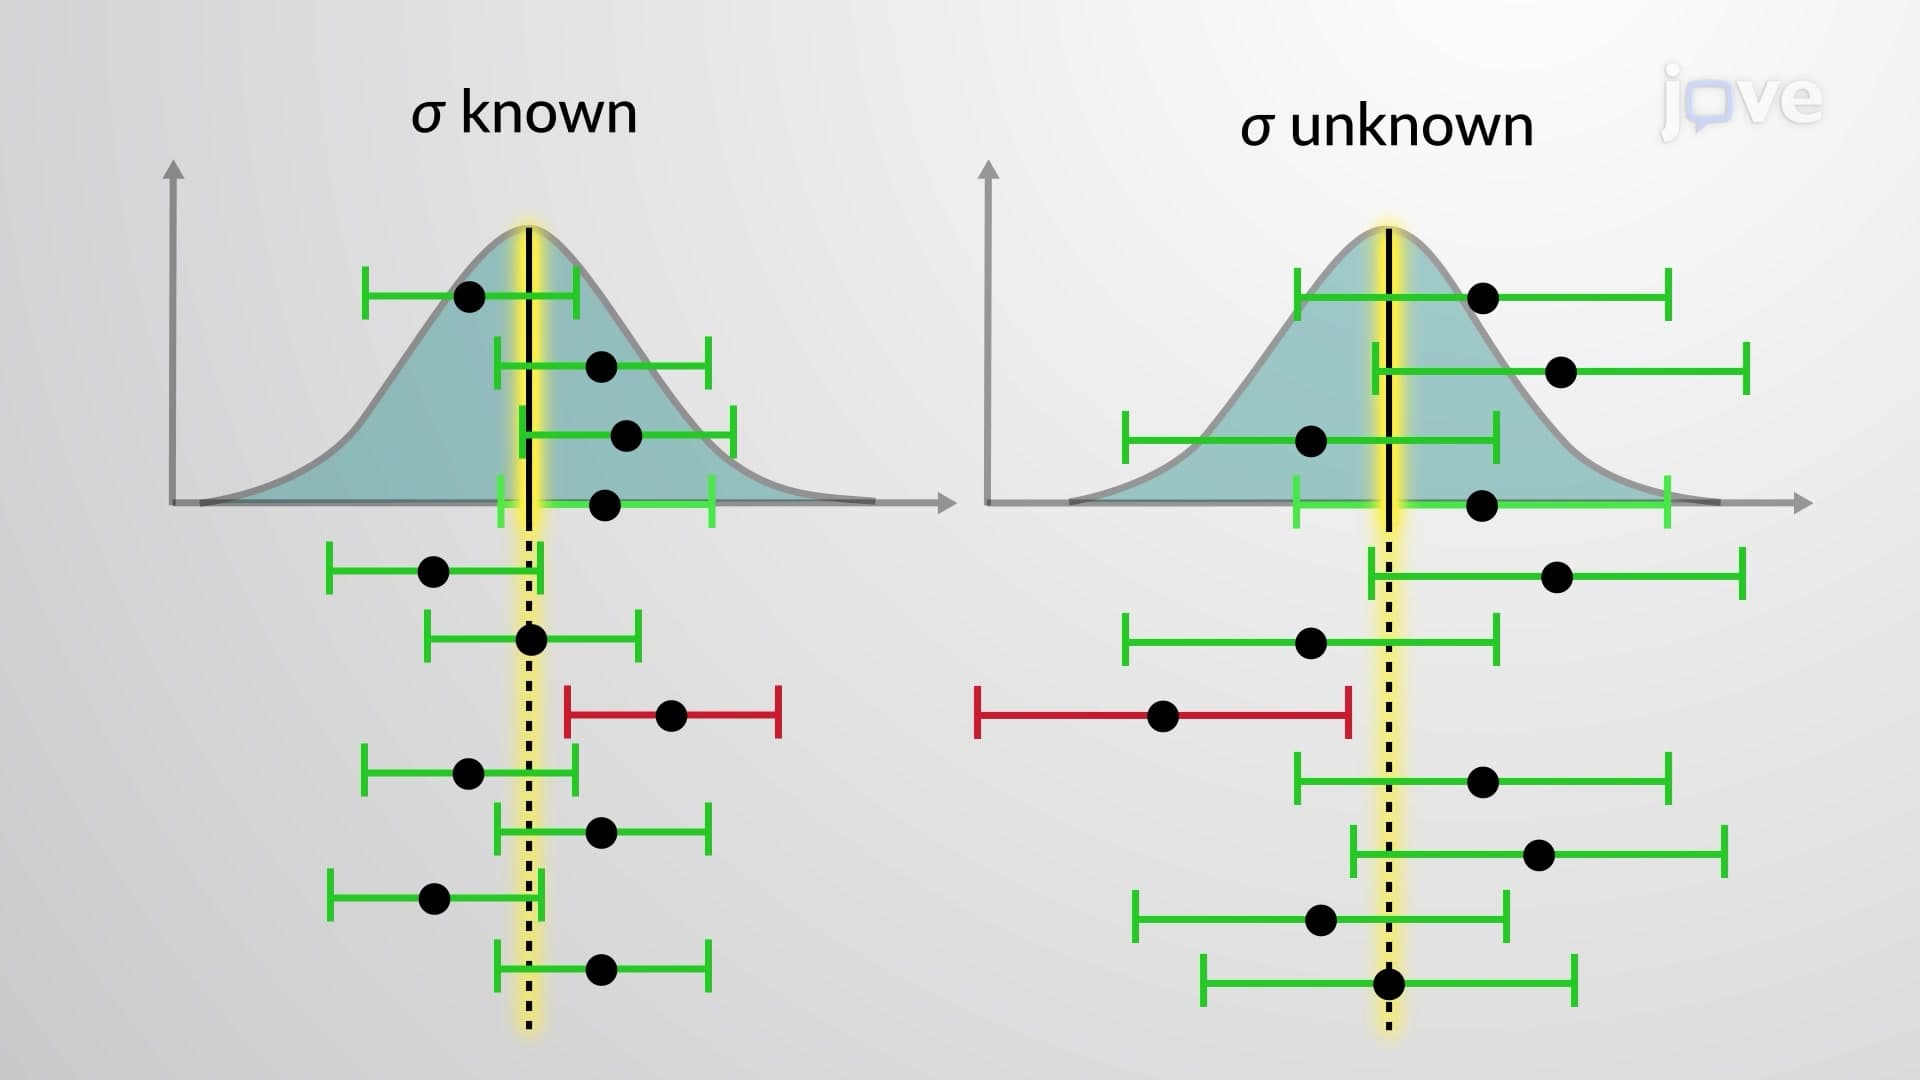
The confidence coefficient serves as the cornerstone of inferential statistics, quantifying our certainty about population parameters based on sample data. Unlike a simple percentage, the confidence coefficient represents a probability statement about the long-run behavior of confidence intervals. When we set a confidence coefficient of 0.95 (or 95%), we're stating that if we repeated our sampling process infinitely, 95% of the resulting confidence intervals would capture the true population parameter.
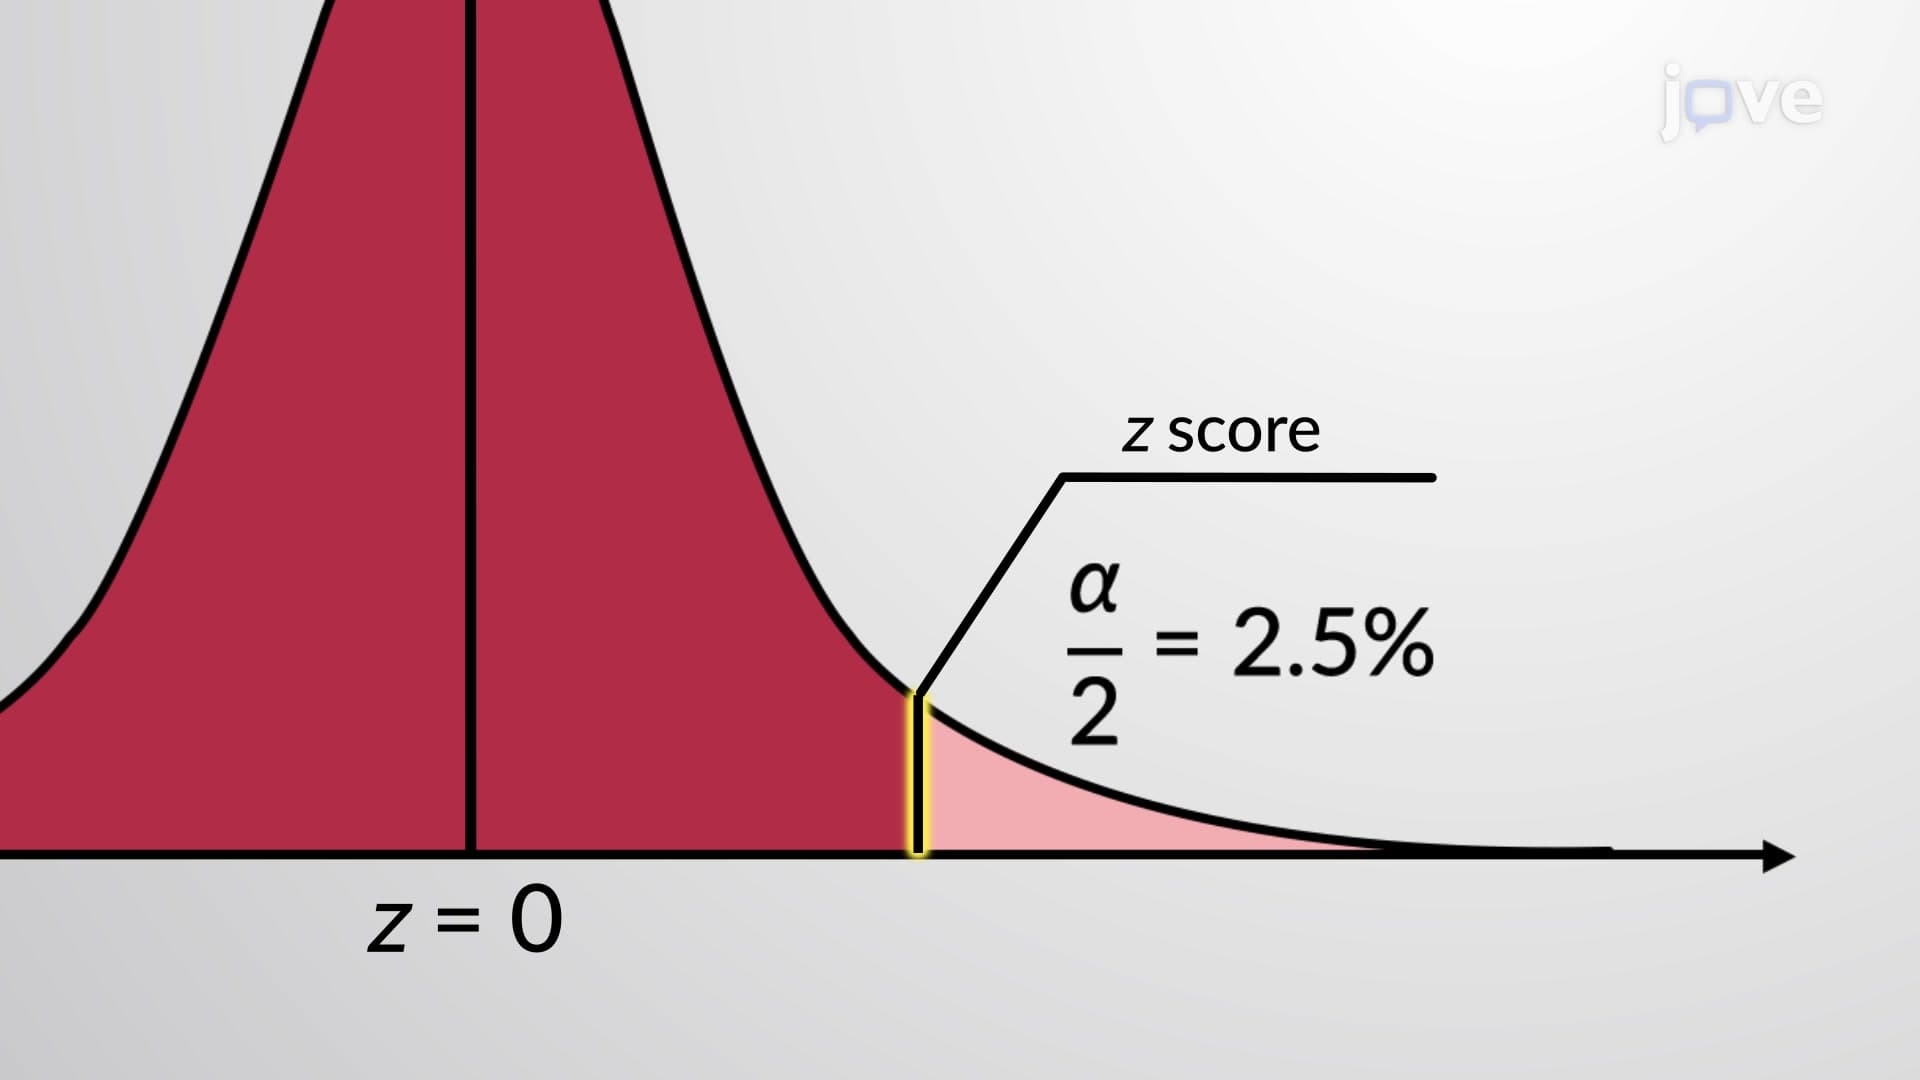
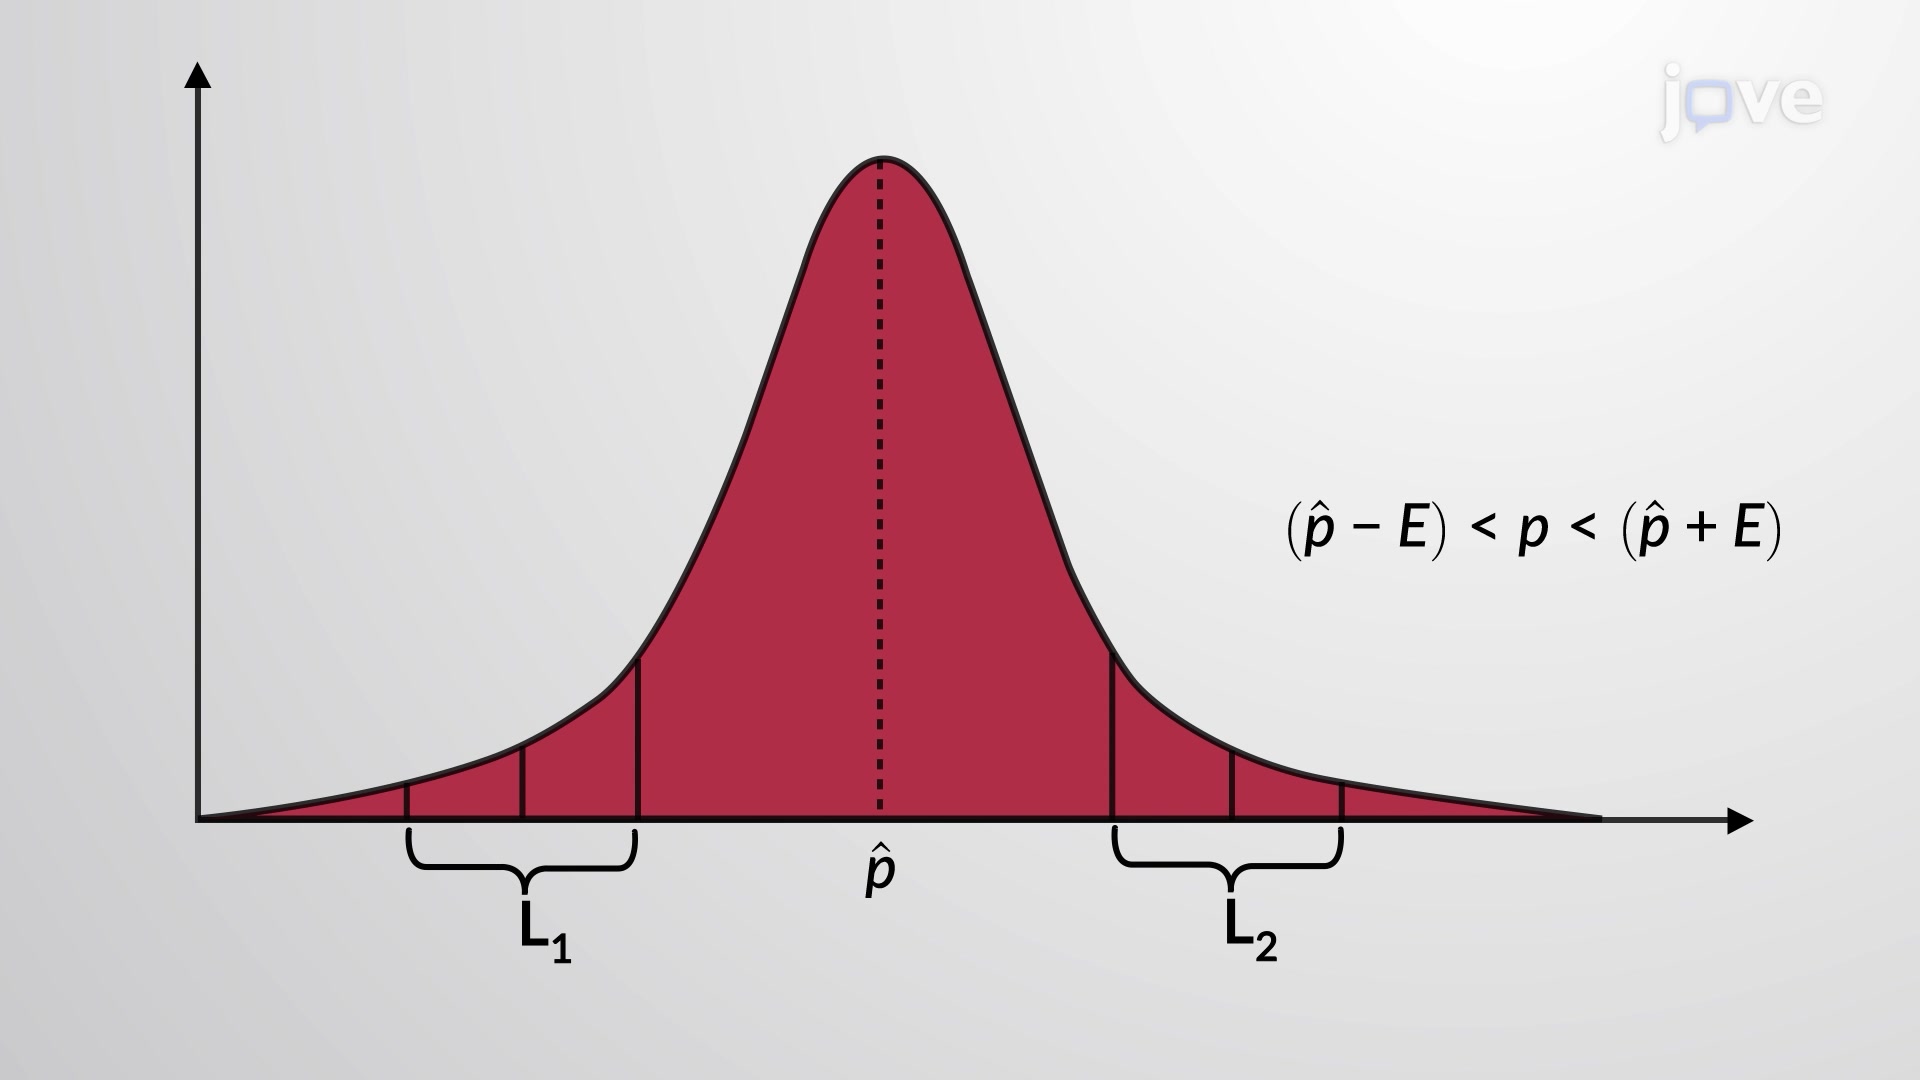
The confidence coefficient directly relates to the significance level (alpha) through the formula: Confidence Coefficient = 1 - α. This relationship reveals why a 95% confidence level corresponds to α = 0.05, distributing this 5% probability equally across both tails of the sampling distribution. This mathematical connection becomes crucial when students encounter AP Statistics problems or college-level hypothesis testing scenarios, where understanding this relationship helps interpret p-values and critical regions.
In real-world applications, confidence coefficient selection significantly impacts decision-making across industries. The FDA typically requires 95% or 99% confidence levels for drug efficacy trials, ensuring robust evidence before approving medications. Similarly, the U.S. Census Bureau employs various confidence coefficients when reporting population estimates, with higher coefficients used for critical demographic data. Market researchers conducting studies for Fortune 500 companies must balance confidence levels with cost constraints, often settling on 95% confidence as the industry standard.
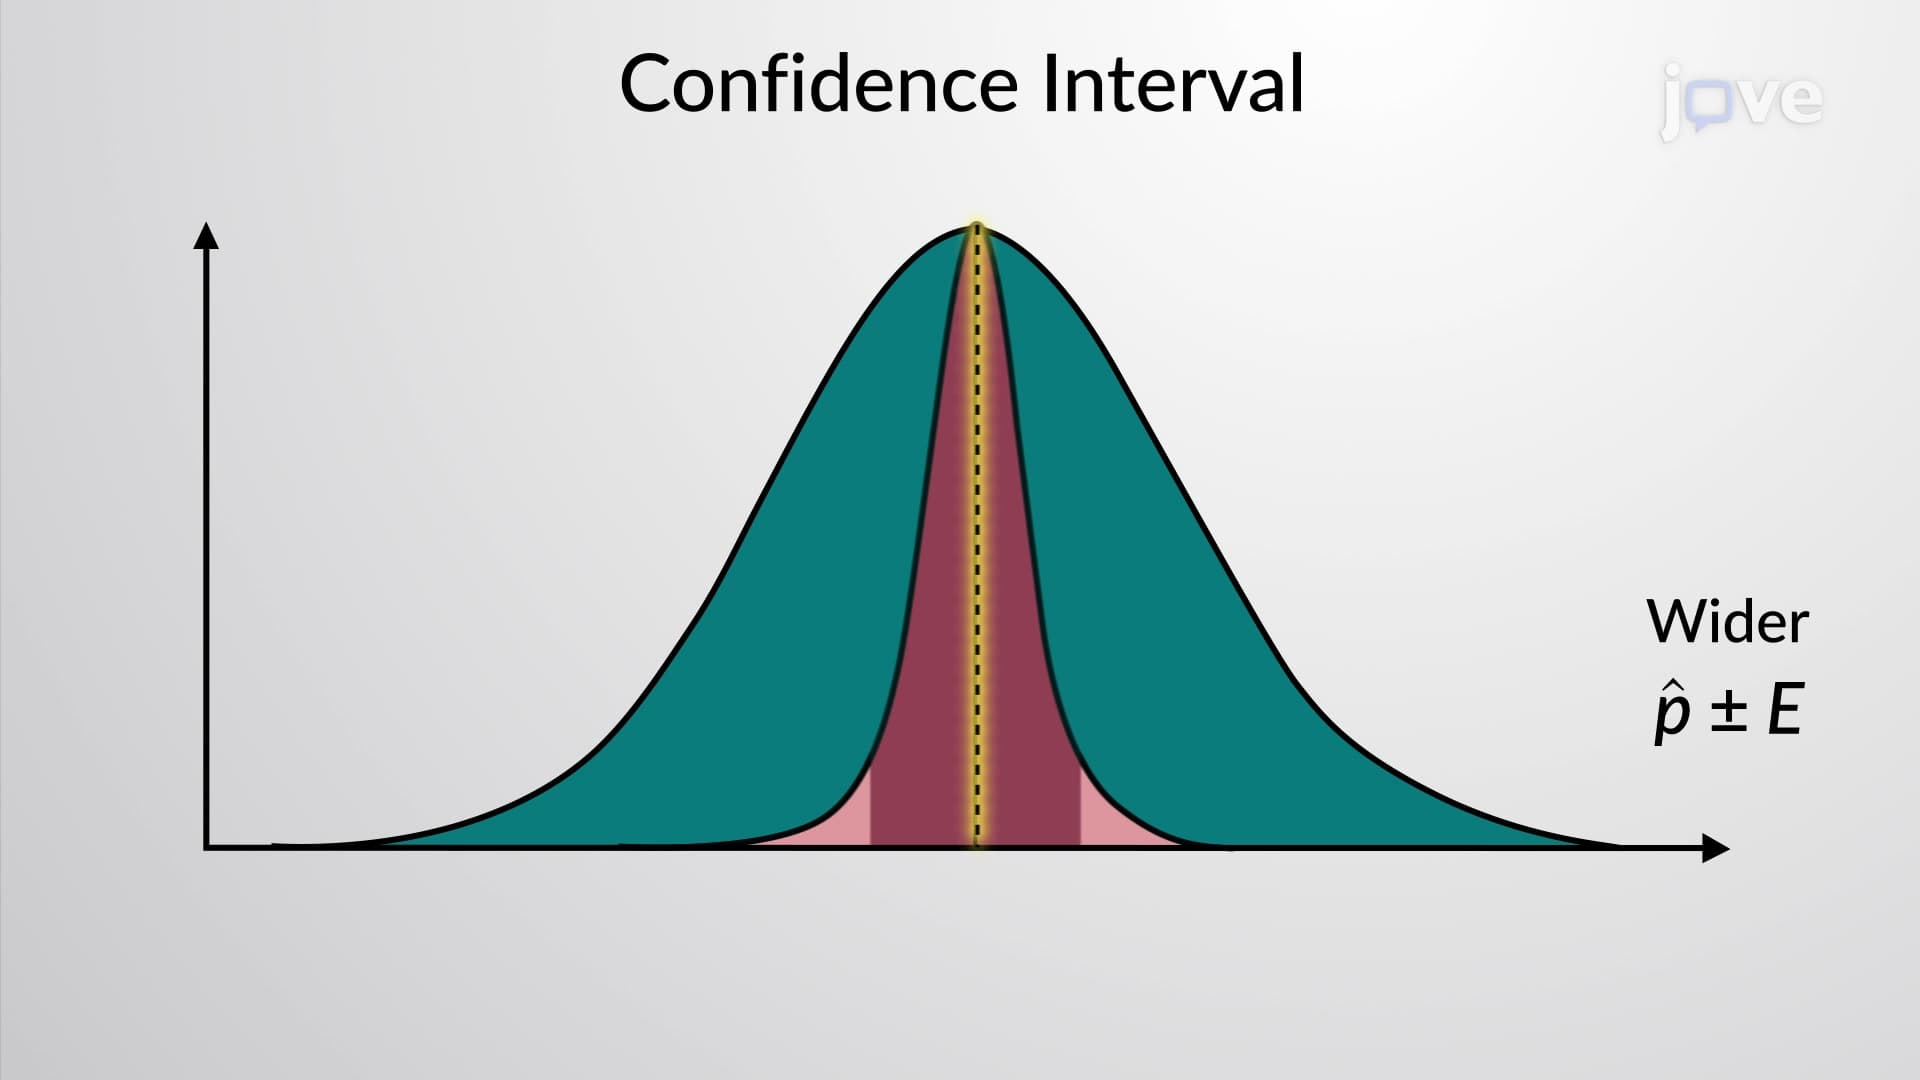
The selection of confidence coefficient involves strategic considerations beyond statistical requirements. Higher confidence coefficients (99% vs. 90%) produce wider confidence intervals, reducing precision while increasing certainty. This trade-off becomes particularly relevant in fields like quality control manufacturing, where companies must decide between tighter quality standards (requiring higher confidence) and operational efficiency. Students preparing for standardized tests like the MCAT or AP exams should recognize that context often dictates appropriate confidence coefficient selection, with medical applications typically demanding higher confidence than social science research.
Related Micro-courses