Loading…
Loading video…
85,600 views

Did you know that when CNN reports "52% of voters support Candidate X with a ±3% margin of error," that tiny number determines whether the race is truly competitive or already decided? The margin of error quantifies how much a sample statistic might differ from the true population value due to random sampling variation. For example, if 1,200 registered voters across Texas were surveyed about healthcare policy preferences, the margin of error tells us the range where the actual population opinion likely falls. Watch the full video on JoVE Coach to master this concept with expert-led visuals and step-by-step explanations.
The margin of error represents the maximum expected difference between a sample statistic and the true population parameter, given a specific confidence level. Think of it as a "buffer zone" that accounts for the inherent uncertainty when we use a sample to estimate something about an entire population. This concept is fundamental in inferential statistics and appears frequently on AP Statistics exams, college statistics courses, and standardized tests like the MCAT.
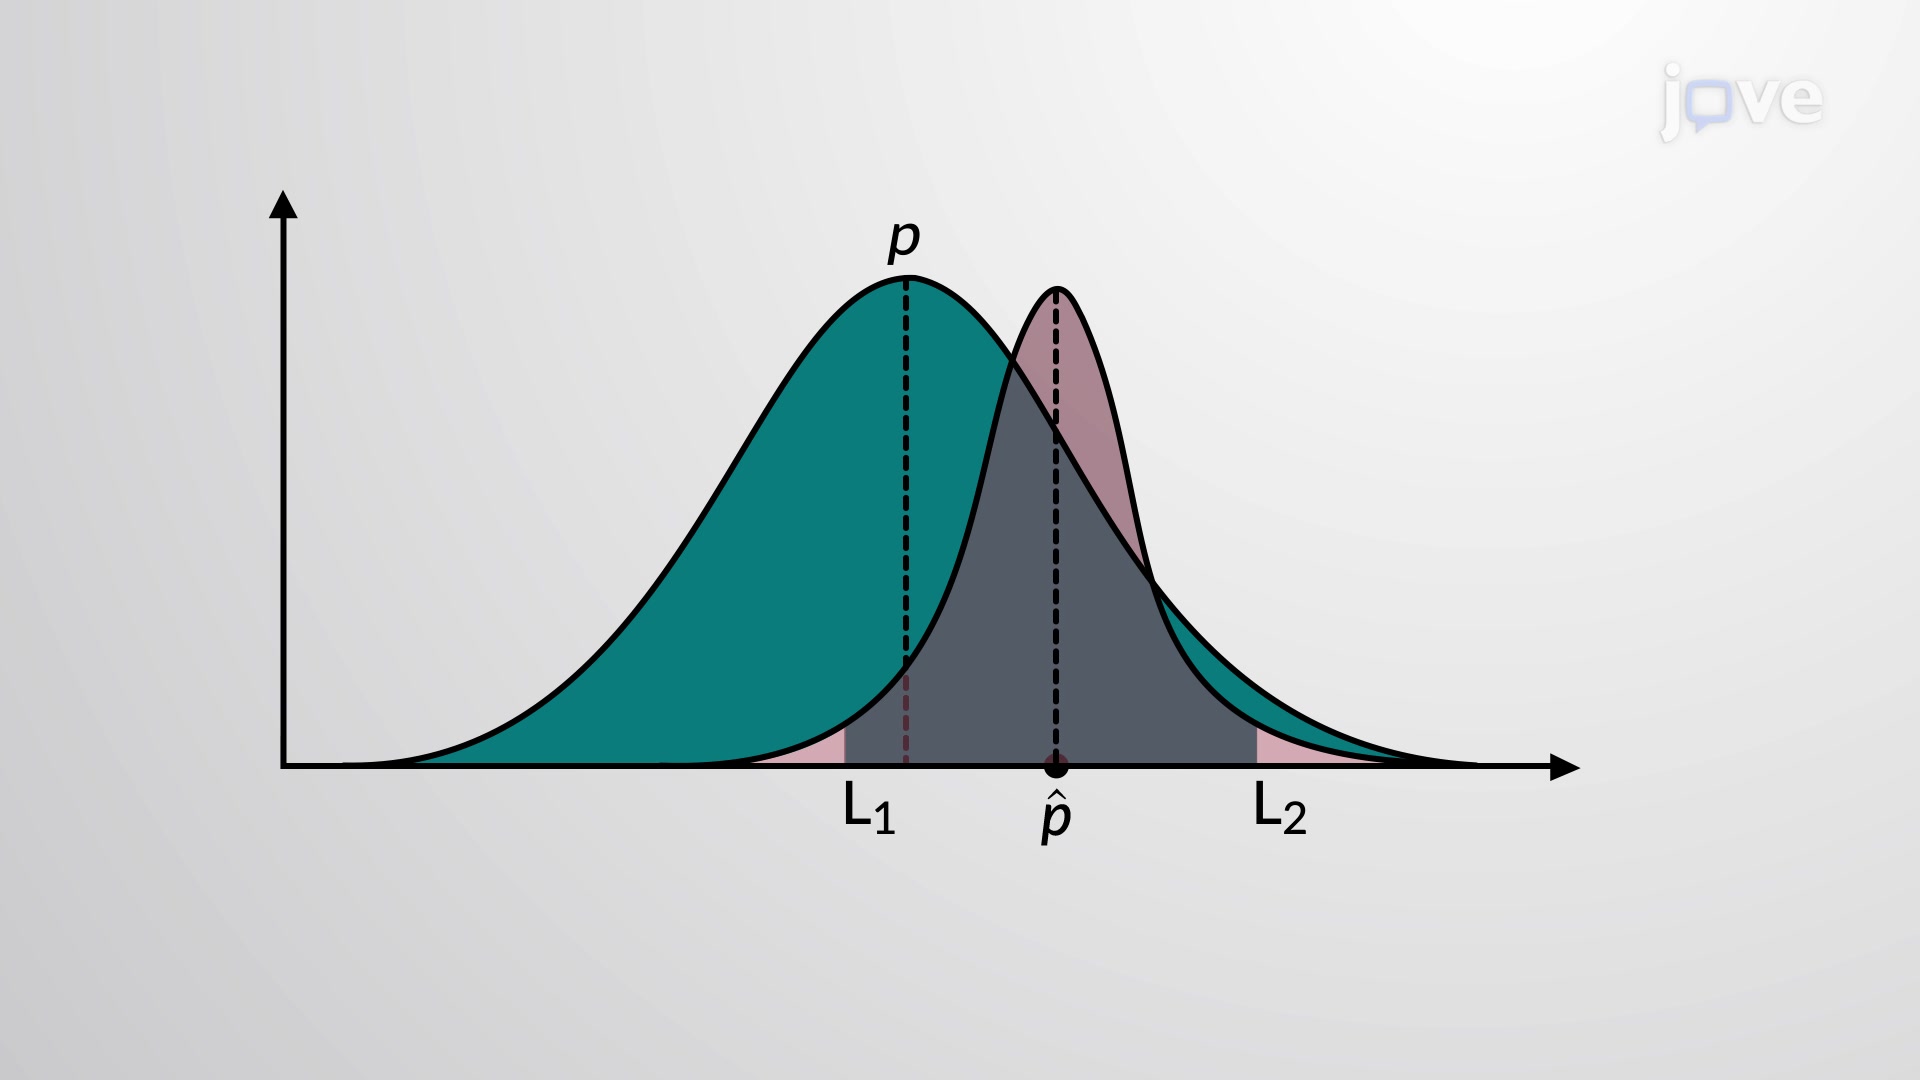
The margin of error for a population proportion follows the formula: E = z(α/2) × √[p̂(1-p̂)/n], where z(α/2) is the critical value, p̂ is the sample proportion, and n is the sample size. The critical value depends on your chosen confidence level—1.96 for 95% confidence, 1.645 for 90% confidence, and 2.576 for 99% confidence. For example, if a Gallup poll surveys 1,000 Americans about climate change concerns and finds 67% express worry, the 95% margin of error would be approximately ±2.9%.
Margin of error appears everywhere in American society. The U.S. Census Bureau uses it to report demographic estimates, pharmaceutical companies rely on it during FDA drug trials, and Nielsen ratings use it to measure television viewership. When the Bureau of Labor Statistics reports unemployment rates, the margin of error helps economists understand the precision of these critical economic indicators. A smaller margin of error indicates more precise estimates but typically requires larger, more expensive samples.
Three primary factors influence margin of error size. Sample size has an inverse square root relationship—quadrupling the sample size halves the margin of error. Confidence level increases margin of error; higher confidence requires wider intervals to capture the true parameter. Population variability also matters; when studying proportions, margins of error are largest when the true proportion is near 50% and smallest near 0% or 100%. Understanding these relationships helps students tackle AP Statistics free-response questions and college exam problems involving survey design and statistical inference.
Frequently Asked Questions
Margin of error quantifies the uncertainty inherent in sample-based estimates, telling us how close our sample statistic likely is to the true population value. It's crucial for making informed decisions based on survey data, clinical trial results, and research findings. Understanding margin of error helps you interpret polls, scientific studies, and business market research with appropriate skepticism and precision.
AP Statistics frequently tests margin of error in free-response questions involving confidence intervals and survey design. Expect problems asking you to calculate margins of error, interpret confidence intervals, or determine required sample sizes. College statistics courses often include similar applications plus more advanced scenarios involving different population parameters and sampling distributions.
MCAT questions often present medical research scenarios where you must interpret confidence intervals or evaluate study reliability based on margin of error. You might see questions about pharmaceutical efficacy studies, epidemiological surveys, or diagnostic test accuracy where understanding margin of error helps assess clinical significance versus statistical significance.
The Federal Reserve uses margin of error when reporting economic surveys, hospitals apply it in quality improvement studies, and companies like Apple use it for customer satisfaction research. Political campaigns rely on polling margins of error to allocate resources, while academic researchers at institutions like Stanford and MIT use it to determine if their findings are statistically meaningful.
Not at all—margin of error requires only basic algebra and understanding of square roots. The conceptual understanding is more important than computational complexity. Most statistics courses provide z-tables and calculators, focusing on interpretation rather than hand calculation. If you're comfortable with basic algebra and can work with formulas, you can master margin of error concepts.
Practice interpreting confidence intervals from real news articles and research papers, then work backward to understand the underlying margin of error. Create flashcards linking confidence levels to critical values, and solve problems involving sample size determination. Focus on connecting the mathematical formula to practical interpretation—this dual approach helps with both multiple-choice and free-response questions.
Margin of error provides the foundation for hypothesis testing, power analysis, and experimental design—core concepts in advanced statistics. It introduces you to the fundamental trade-off between precision and confidence that appears throughout statistical inference. Mastering margin of error now makes concepts like Type I/II errors, effect sizes, and statistical power much more intuitive later.
Related Micro-courses
Related Subjects


