Loading video…

 6 Concepts
 1.3K views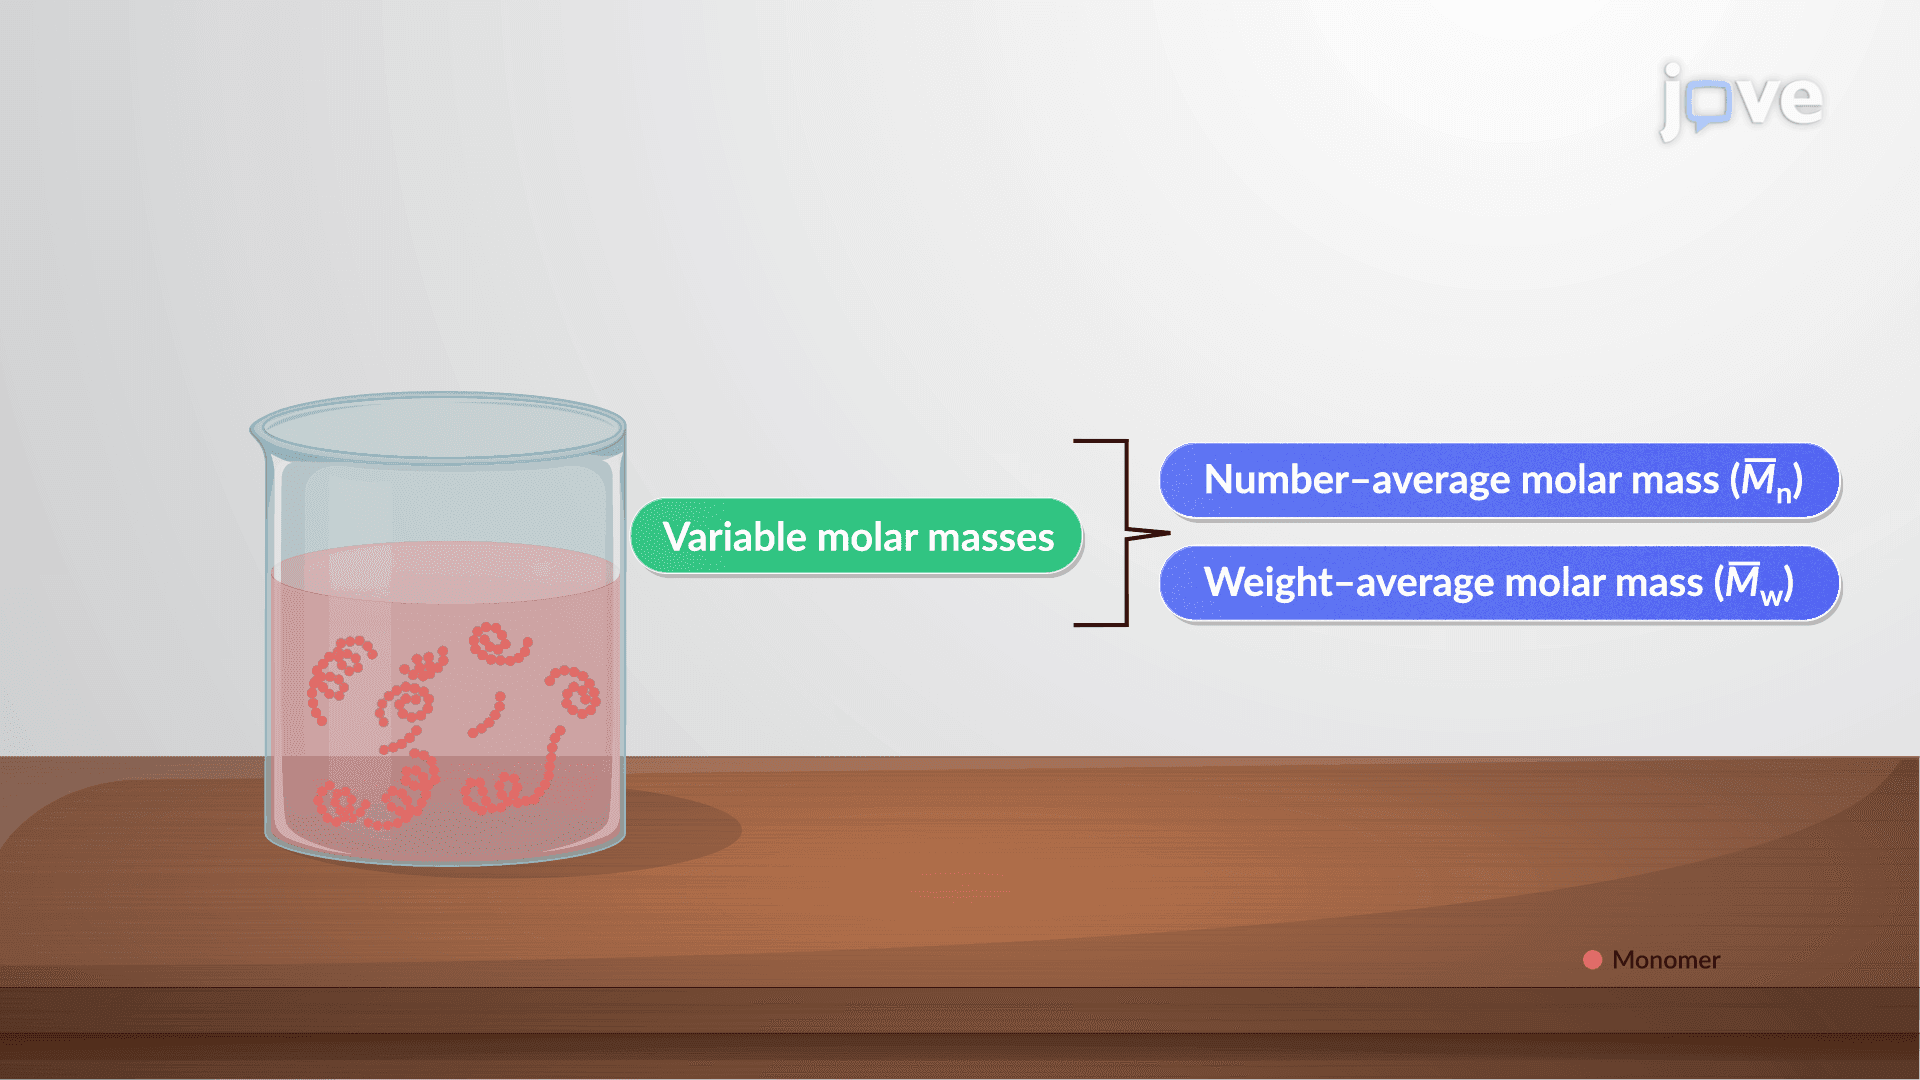

Video Summary: Determination of Molar Masses of Polymers Ii Explained
Why does one plastic bottle stay rigid while another bends easily, even when both are made of "the same" polymer? The answer lies in molar mass distribution. Determination of Molar Masses of Polymers II covers viscosity-average molar mass, the Mark-Houwink equation, and gel permeation chromatography (GPC), techniques used by materials scientists at companies like DuPont to characterize real polymer samples. Watch the full video on JoVE Coach to master this concept with expert-led visuals and step-by-step explanations.
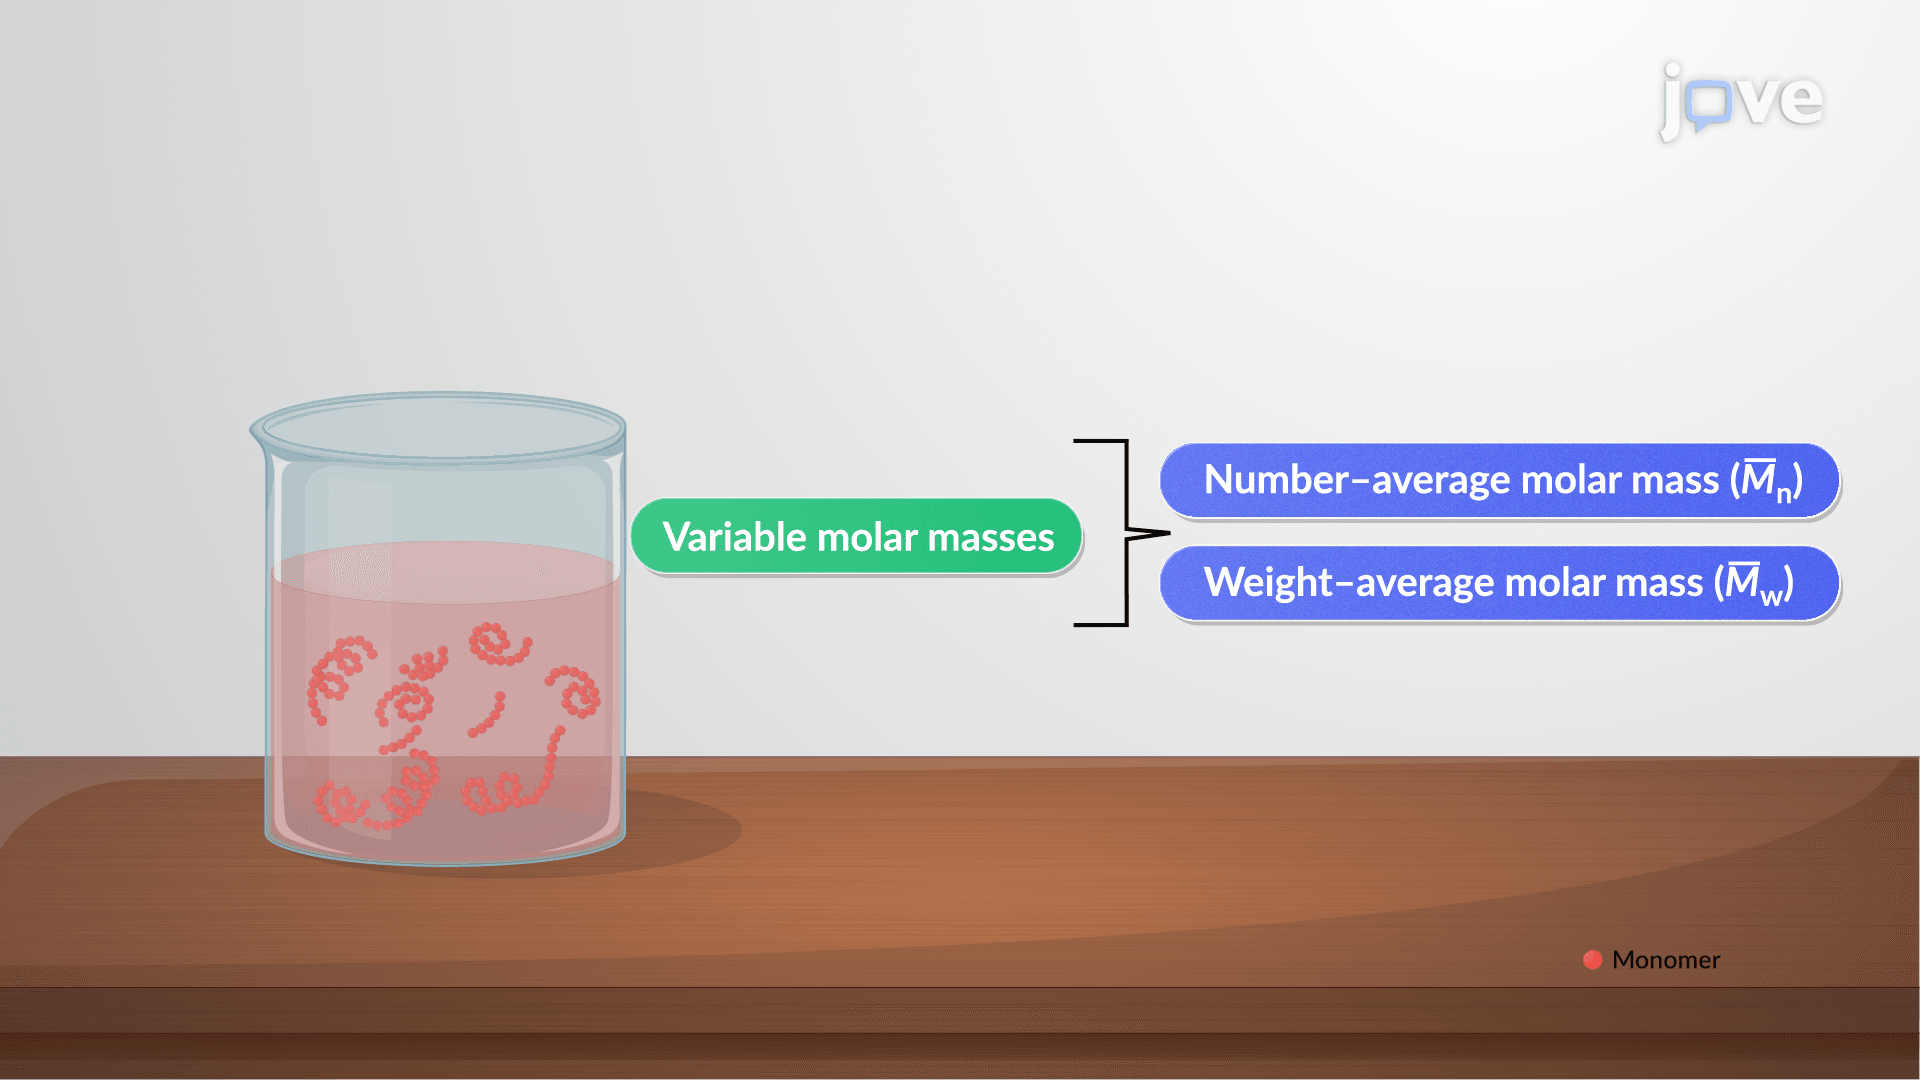
When chemists first describe a polymer sample, they often report number-average or weight-average molar mass. But neither of those values fully captures how a polymer *behaves* in solution, which is critical for applications ranging from drug delivery hydrogels to industrial adhesives. Determination of Molar Masses of Polymers II introduces two powerful tools, viscometry and gel permeation chromatography, that give a more complete picture of molecular weight distribution.
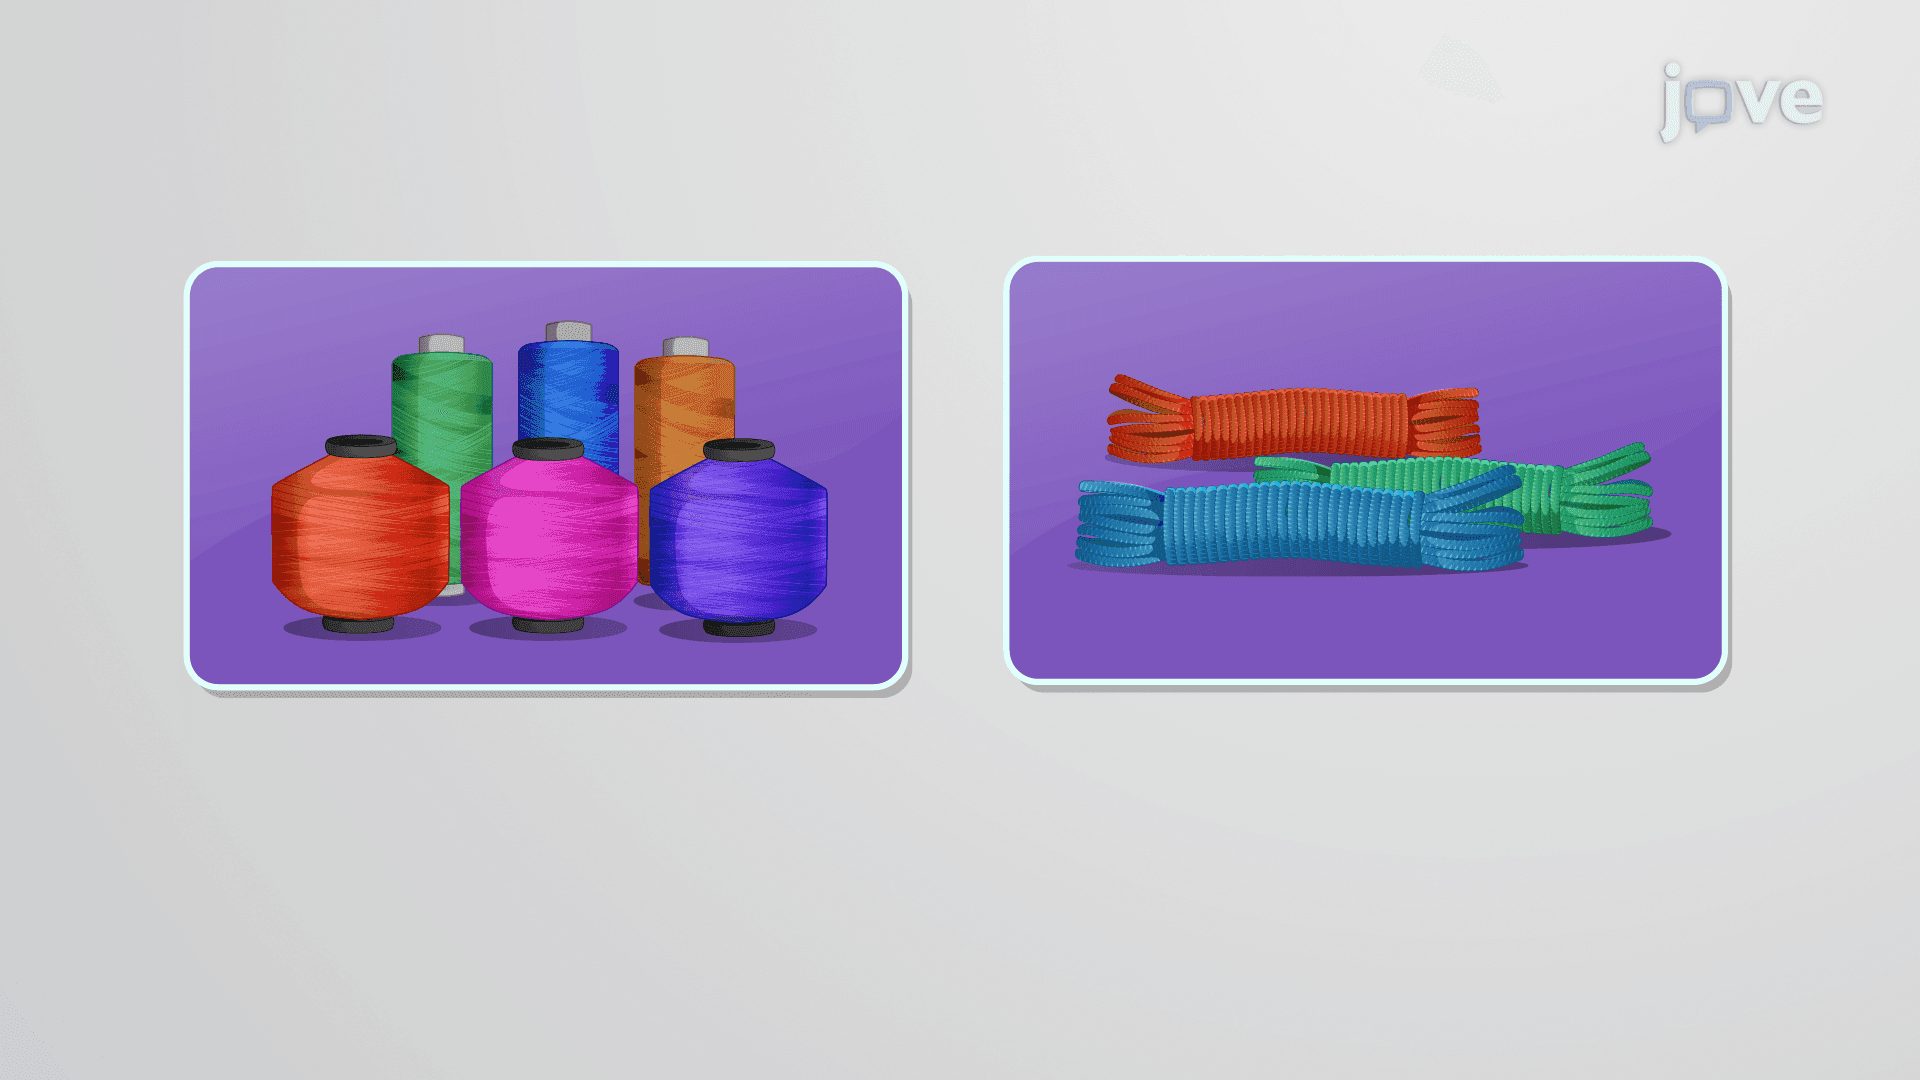
Polymers dissolved in solution form coiled chains. The size and shape of those coils directly affect how the solution resists flow, that is, its viscosity. The viscosity-average molar mass (M̄v) captures this relationship. Unlike the number-average, M̄v weights larger chains more heavily, because longer chains create larger coils that restrict fluid movement more dramatically. This makes M̄v especially useful for predicting mechanical and flow properties in processed polymer materials, like the nylon fibers manufactured by companies such as Invista in the United States.
The bridge between measurable viscosity and molar mass is the Mark-Houwink equation:
[η] = K × M^a
Here, [η] is the intrinsic viscosity, measured by progressively diluting a polymer solution and extrapolating specific viscosity to zero concentration using a viscometer. The constant K reflects how strongly the polymer interacts with its solvent (for example, polystyrene behaves very differently in toluene versus cyclohexane). The exponent a describes chain conformation: values near 0.5 indicate a compact, theta-condition coil, while values approaching 0.8 or higher suggest an expanded, rod-like chain in a good solvent. Both K and a are tabulated for common polymer-solvent pairs and are widely referenced in undergraduate polymer chemistry courses across US universities.
No single average fully describes a real polymer sample. Gel permeation chromatography (GPC), also called size exclusion chromatography (SEC), provides the entire molecular weight distribution curve. In GPC, a polymer solution is pumped through a column packed with porous beads of controlled pore size. Large chains cannot enter the pores and travel through the column quickly, eluting first. Smaller chains diffuse into the pores, taking longer to exit. A detector (typically refractive index or UV) records signal over time, which is converted to a full distribution of chain lengths.
GPC is a standard technique in US industrial and academic labs. Materials scientists at research universities and companies like 3M use GPC data to ensure batch-to-batch consistency in polymer products. In college coursework, particularly organic chemistry II, polymer science, and materials science, students are expected to interpret GPC traces and calculate polydispersity index (PDI = M̄w / M̄n), a measure of how broad or narrow the distribution is.
On the MCAT, polymer concepts appear in the context of biochemical macromolecules and solution behavior. In AP Chemistry, molecular weight distribution supports understanding of colligative properties and macromolecule structure. In college, GPC and viscometry labs are common in advanced organic and physical chemistry courses. These concepts also connect naturally to block copolymers, supramolecular chemistry, and self-assembling macromolecules, areas where controlling molecular weight distribution is essential for designing functional nanomaterials and liquid crystal systems.
Related Micro-courses