Loading video…


 19 Concepts
 13.4K views

Video Summary: Primary Data Collection Methods Ii Guide
When businesses face critical decisions about market expansion or product launches, primary data collection methods become the foundation for strategic success. Companies like Walmart leverage sophisticated primary data collection methods to optimize inventory, track consumer purchasing patterns, and drive billion-dollar supply chain decisions. Understanding primary data collection methods explained through quantitative research-including surveys, panel studies, scanner data, and experimental approaches-enables executives to transform raw market intelligence into competitive advantage. Watch the full video on JoVE Coach to master this concept with expert-led visuals and step-by-step explanations.
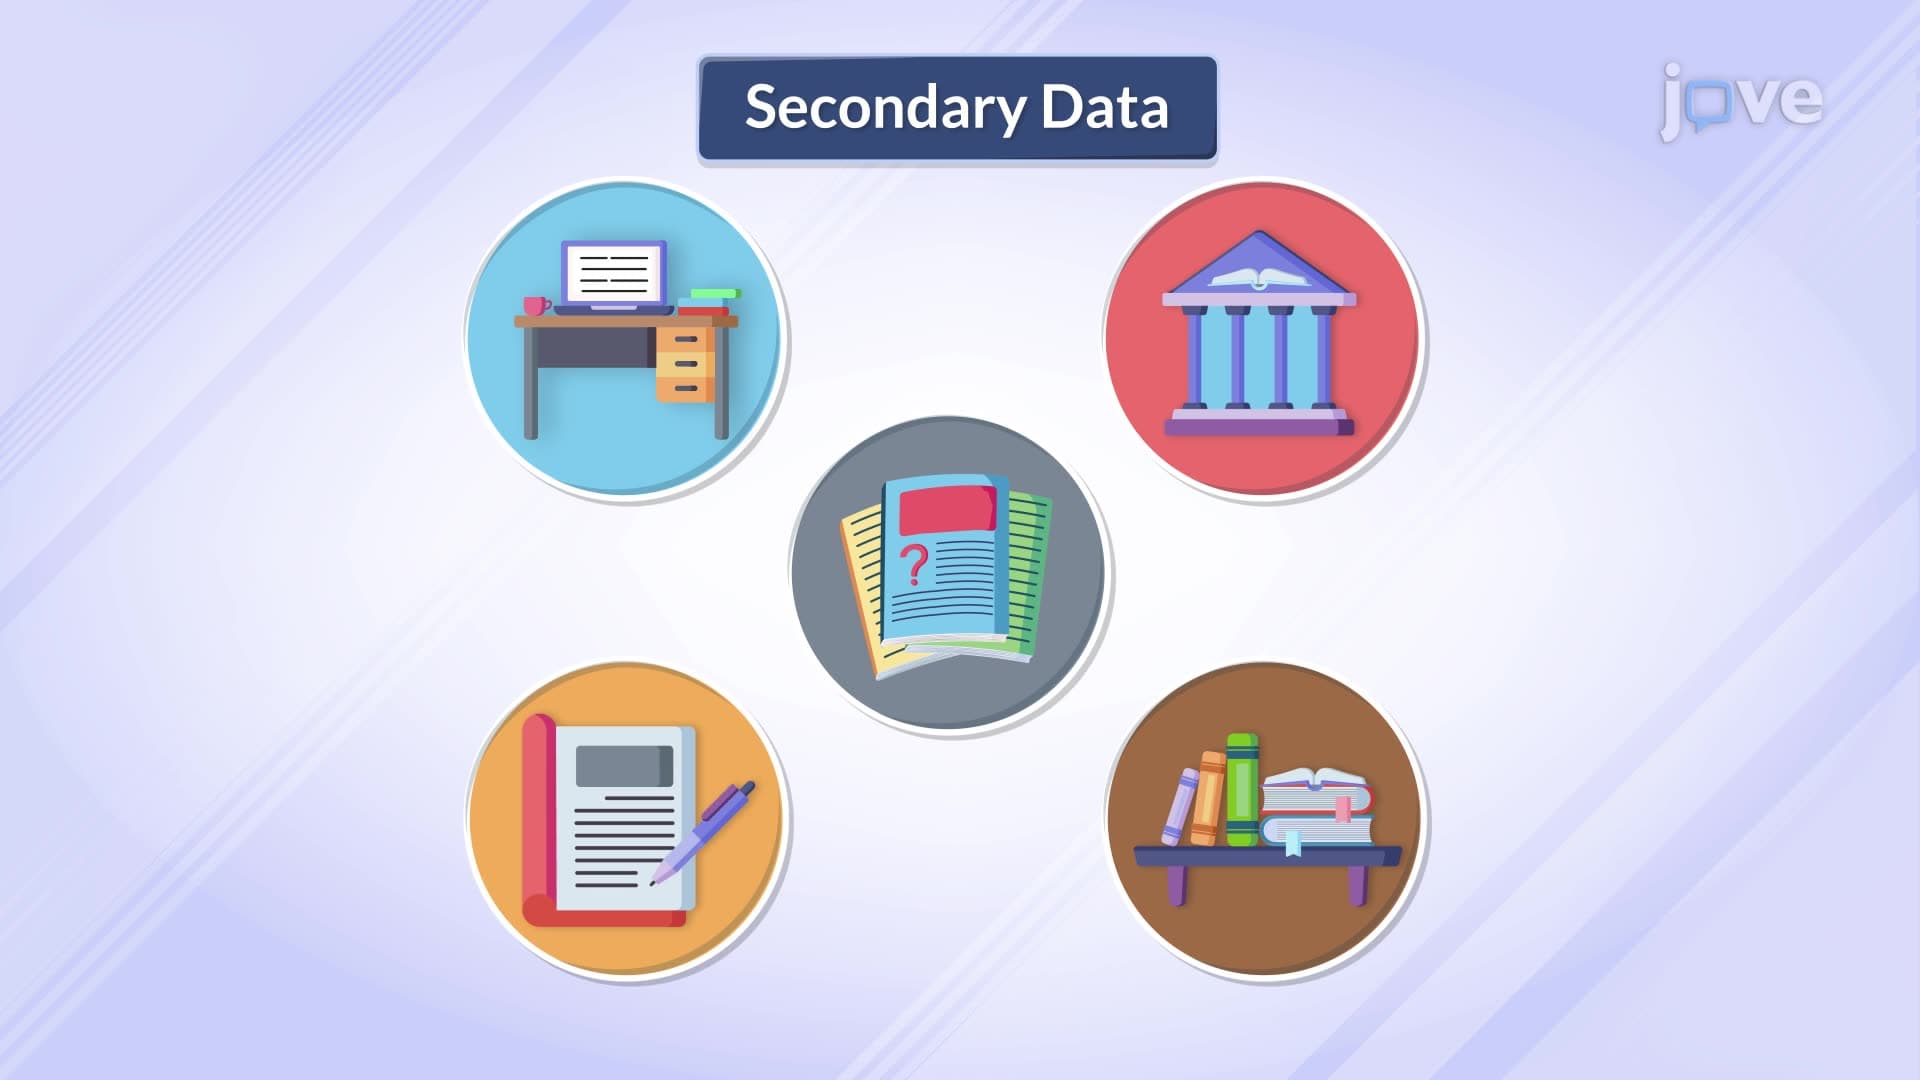
When Netflix decides to invest $15 billion in original content or when Target restructures its store layouts nationwide, these decisions rely heavily on primary data collection methods. Unlike secondary data from third-party sources, primary data provides organizations with proprietary insights directly from their target markets, enabling competitive differentiation and informed strategic planning.
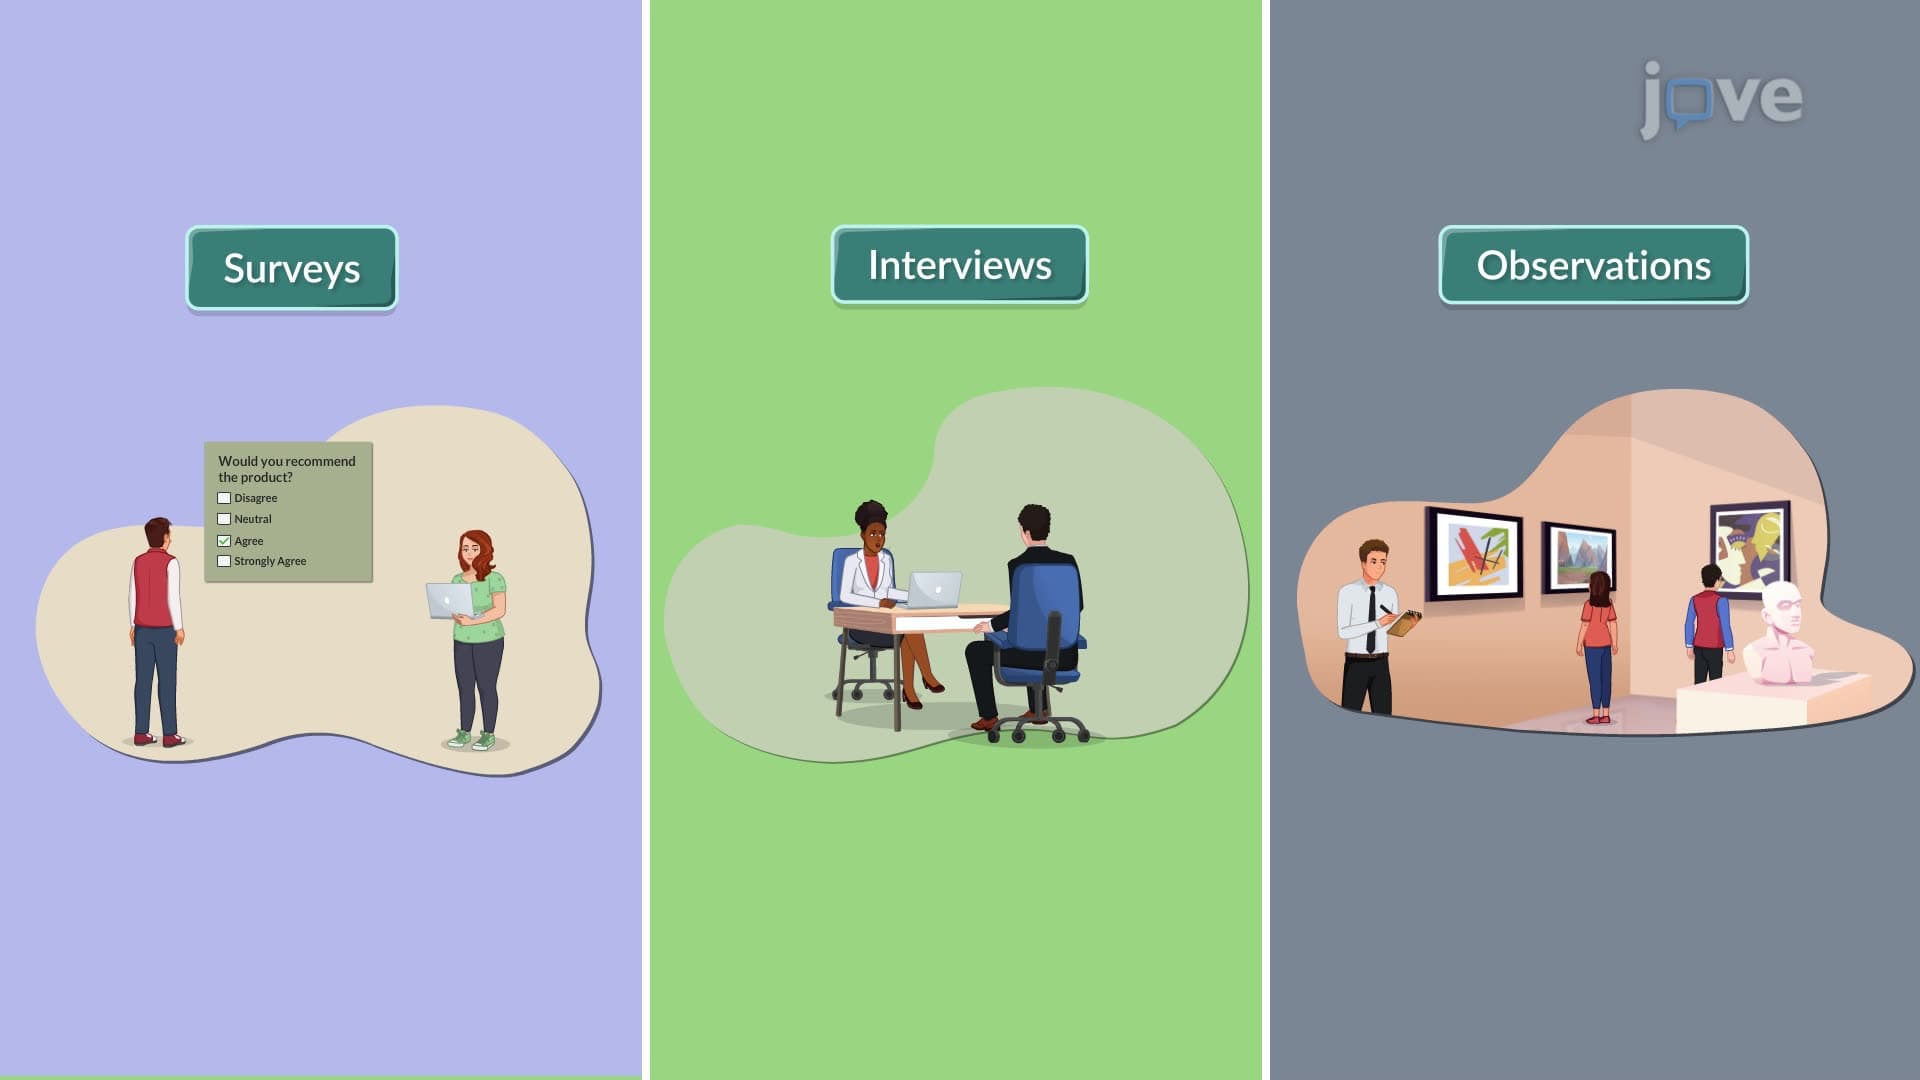
Survey-based primary data collection serves as the backbone of modern business intelligence. Companies like American Express deploy sophisticated online and mobile survey platforms to gather structured feedback from millions of cardholders, enabling real-time adjustments to rewards programs and service offerings. The key advantage lies in standardized data collection that produces quantifiable metrics-customer satisfaction scores, purchase intent ratings, and brand preference rankings-that translate directly into board-ready presentations and P&L forecasts.
Professional survey design requires balancing response quality with completion rates. Close-ended questionnaires ensure data consistency while minimizing analysis complexity, crucial when presenting findings to C-suite executives who need actionable insights, not research methodology explanations.
Panel research represents one of the most powerful primary data collection methods for tracking market evolution. Nielsen's consumer panels, which monitor purchasing behaviors across thousands of households, provide CPG companies like Procter & Gamble with longitudinal data sets that reveal emerging trends months before they appear in sales reports. This temporal dimension enables proactive strategy adjustments rather than reactive market responses.
The business value of panel data compounds over time. Initial investments in panel recruitment and maintenance pay dividends through trend identification, seasonal pattern recognition, and competitive benchmarking that inform everything from manufacturing capacity planning to advertising spend allocation.
Scanner-based data collection transforms every checkout transaction into strategic intelligence. Home Depot's integration of RFID and barcode scanning generates millions of data points daily, enabling inventory optimization, demand forecasting, and regional preference analysis that directly impacts gross margins and customer satisfaction metrics.
Experimental research methodologies allow businesses to test hypotheses before committing significant resources. A/B testing platforms enable companies like Uber to experiment with pricing models, user interface changes, and service offerings while measuring impact on key performance indicators before full-scale implementation.
Related Micro-courses