Loading subject page…
- Math Fundamentals
- Trigonometry
- Graphs of Trigonometric Functions
Micro-course: Trigonometry
641 views
Learn key concepts and earn your certificate.



Graphs of Trigonometric Functions

00:00
01:29
Video Summary: What are Graphs of Trigonometric Functions
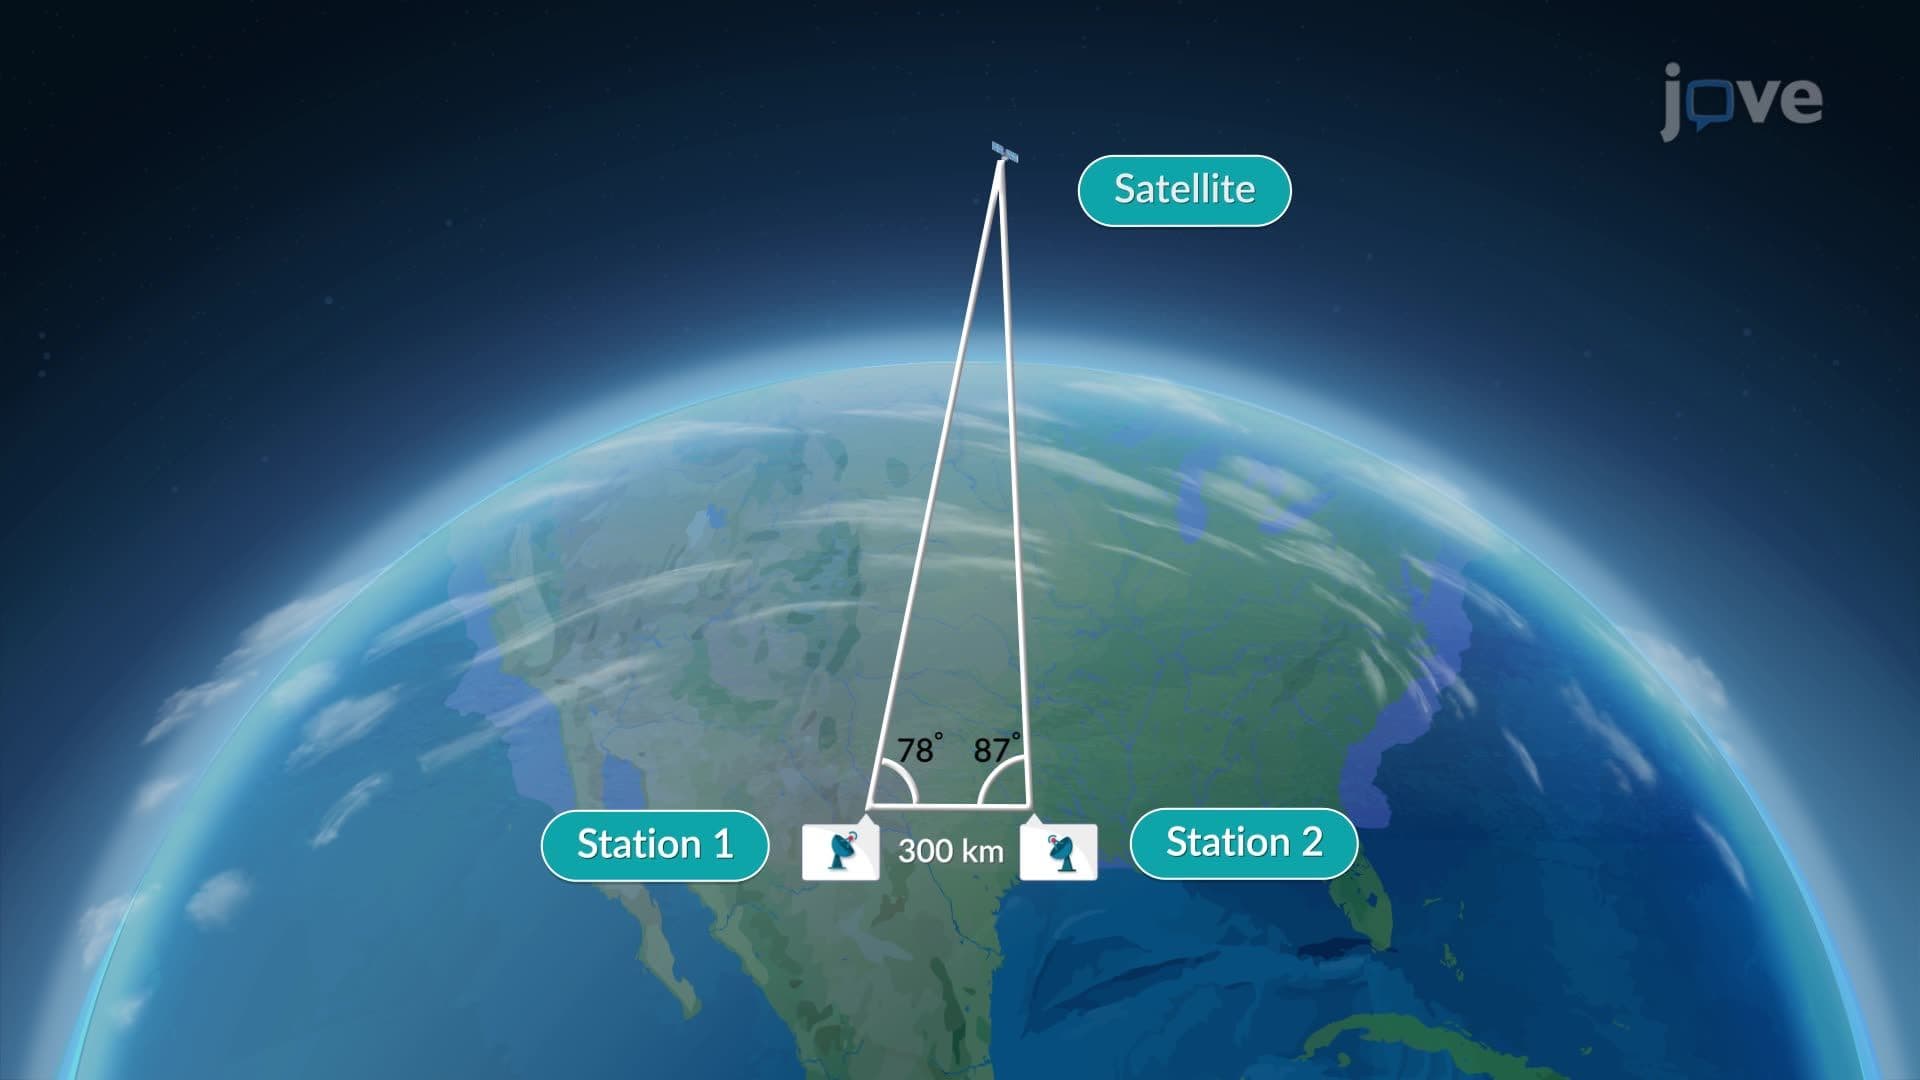
Ever wondered how NASA engineers predict satellite orbits or how architects design the curves of roller coasters? Graphs of trigonometric functions are the mathematical foundation behind these calculations, transforming circular motion into wave patterns we can analyze and predict. These powerful visual representations connect the unit circle to periodic phenomena throughout our world, from the oscillations of a guitar string to the seasonal temperature changes in Chicago. Understanding what are graphs of trigonometric functions unlocks the ability to model everything from sound waves to economic cycles. Watch the full video on JoVE Coach to master this concept with expert-led visuals and step-by-explanations.
- Understand what are graphs of trigonometric functions and how they relate to the unit circle through point projections and geometric relationships
- Identify the six primary trigonometric function graphs (sine, cosine, tangent, cotangent, secant, cosecant) and their distinctive characteristics
- Analyze key properties of each graph including domain, range, period, and points of discontinuity
- Compare sine and cosine functions with their reciprocal functions (cosecant and secant) to understand amplitude and asymptotic behavior
- Recognize periodic patterns in trigonometric graphs and how they repeat at specific intervals
- Apply trigonometric graphing concepts to model real-world periodic phenomena like seasonal patterns and mechanical oscillations
- Evaluate where functions are undefined and identify vertical asymptotes in tangent, cotangent, secant, and cosecant graphs
- Explore the connection between circular motion and wave functions through unit circle projections
Understanding Graphs of Trigonometric Functions Through the Unit Circle
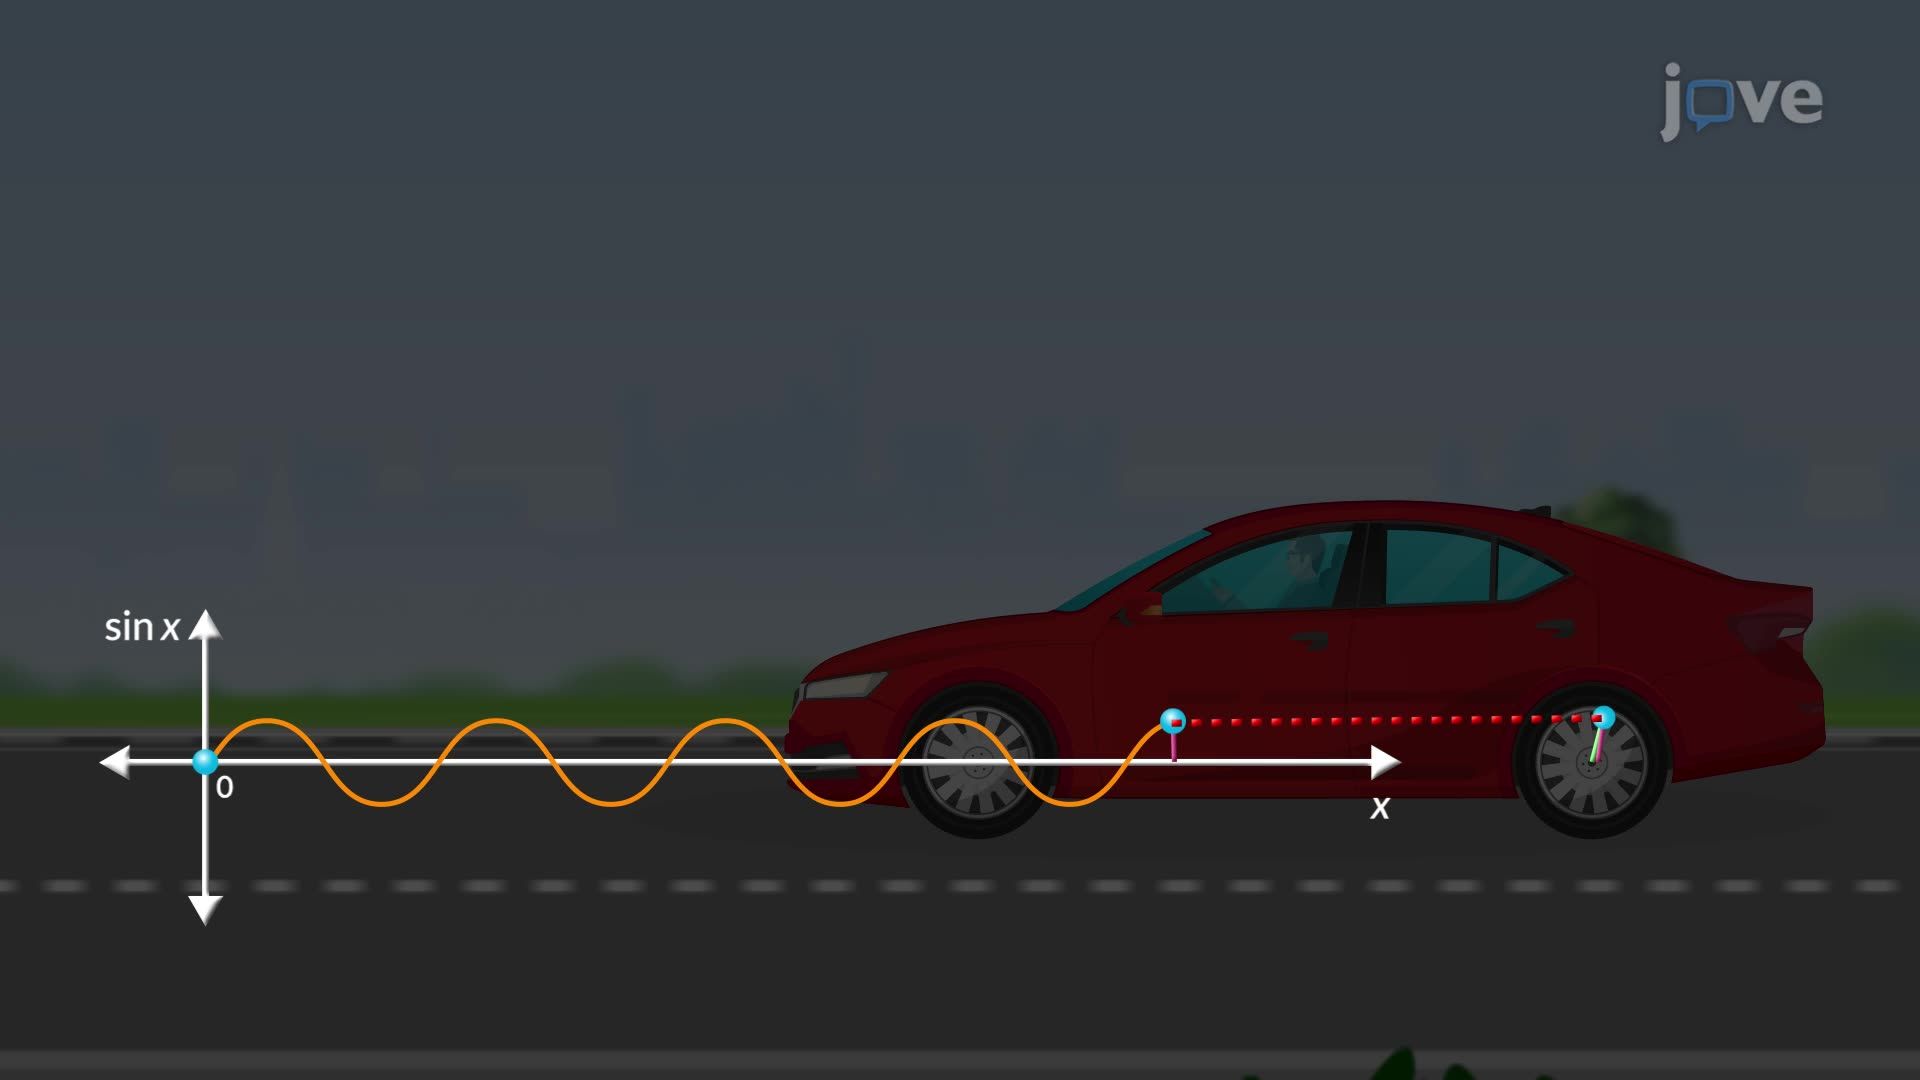
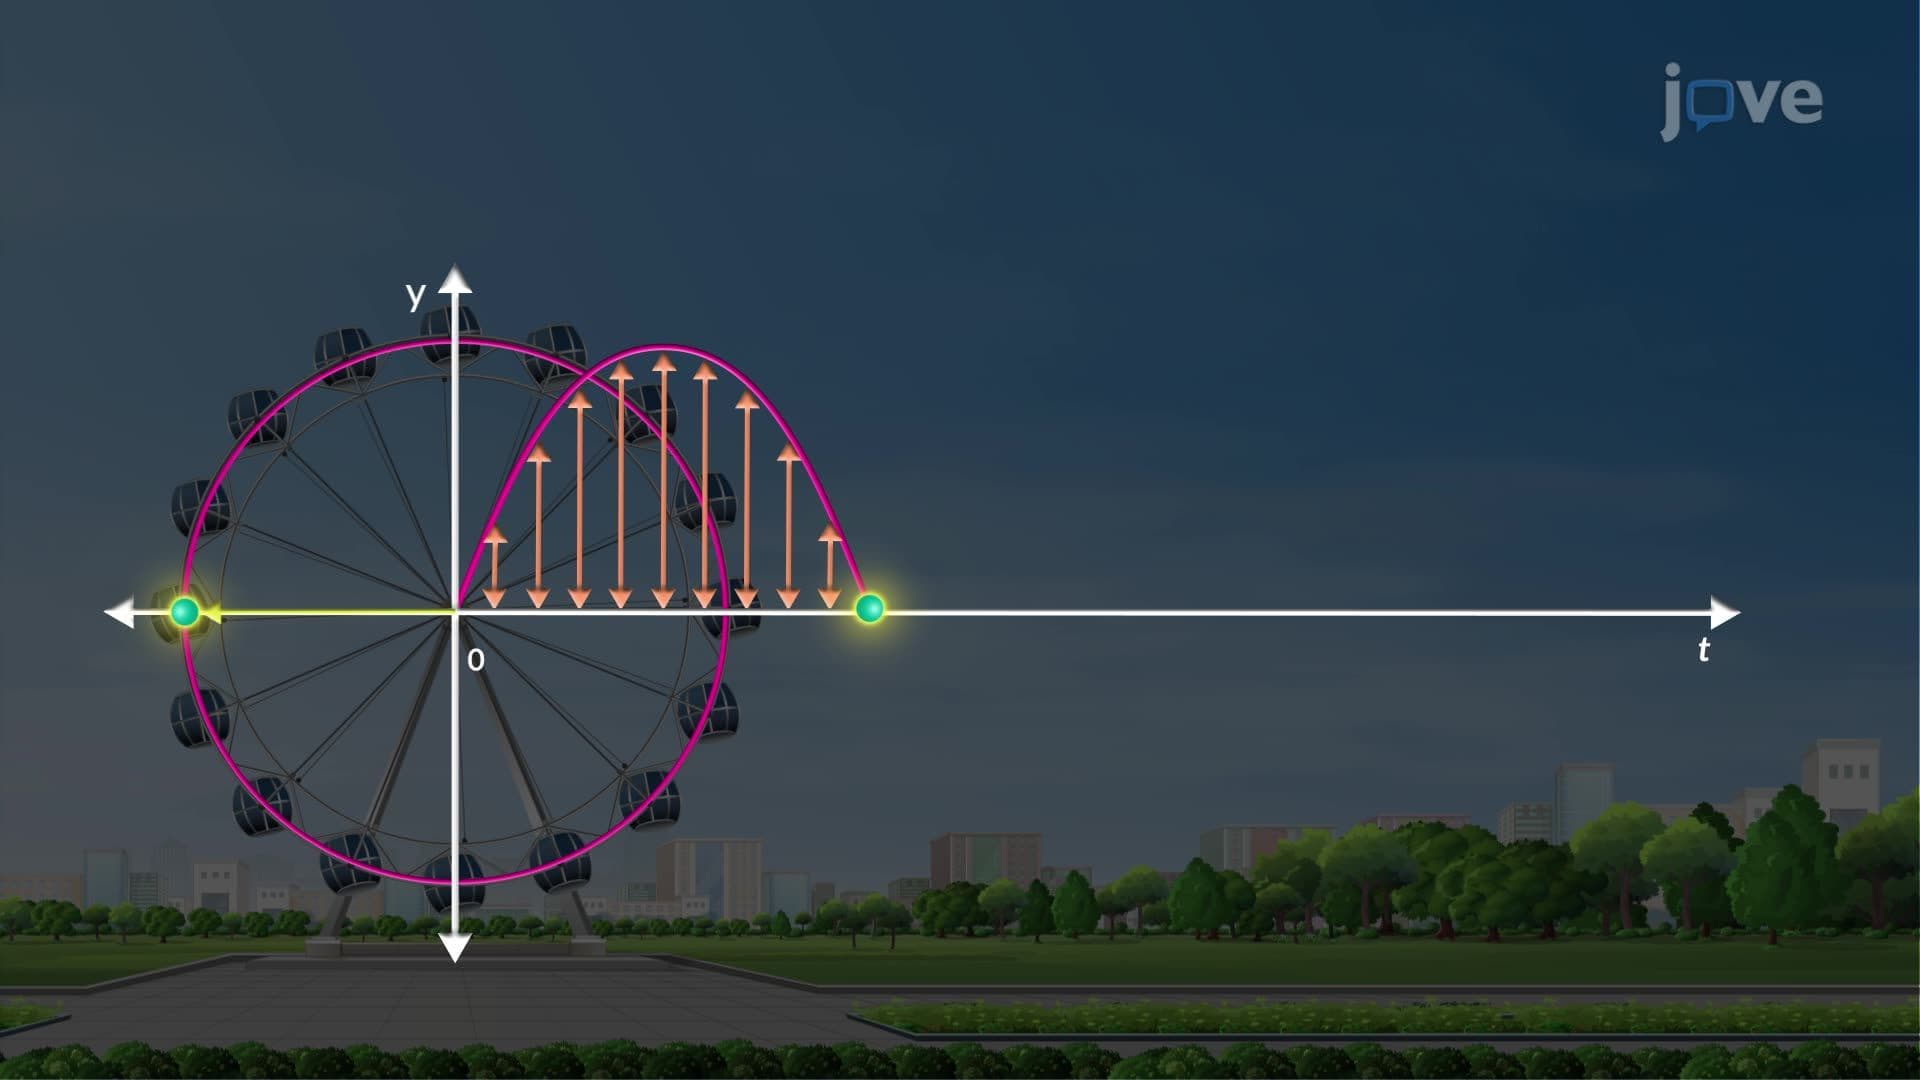
Graphs of trigonometric functions emerge from the elegant relationship between circular motion and linear wave patterns. When we trace a point moving counterclockwise around the unit circle, its vertical and horizontal coordinates create the foundation for all trigonometric graphing. This connection transforms abstract circular relationships into concrete visual representations that students encounter throughout high school mathematics and college calculus courses.
Primary Trigonometric Function Graphs: Sine and Cosine
The sine and cosine functions represent the most fundamental types of graphs of trigonometric functions. As a point travels around the unit circle, its y-coordinate traces the sine wave while its x-coordinate creates the cosine wave. Both functions share identical properties: a period of 2π, a domain spanning all real numbers, and a range restricted to [-1, 1]. These characteristics make sine and cosine graphs essential for AP Calculus AB/BC students and appear frequently on SAT Subject Tests in Mathematics Level 2.
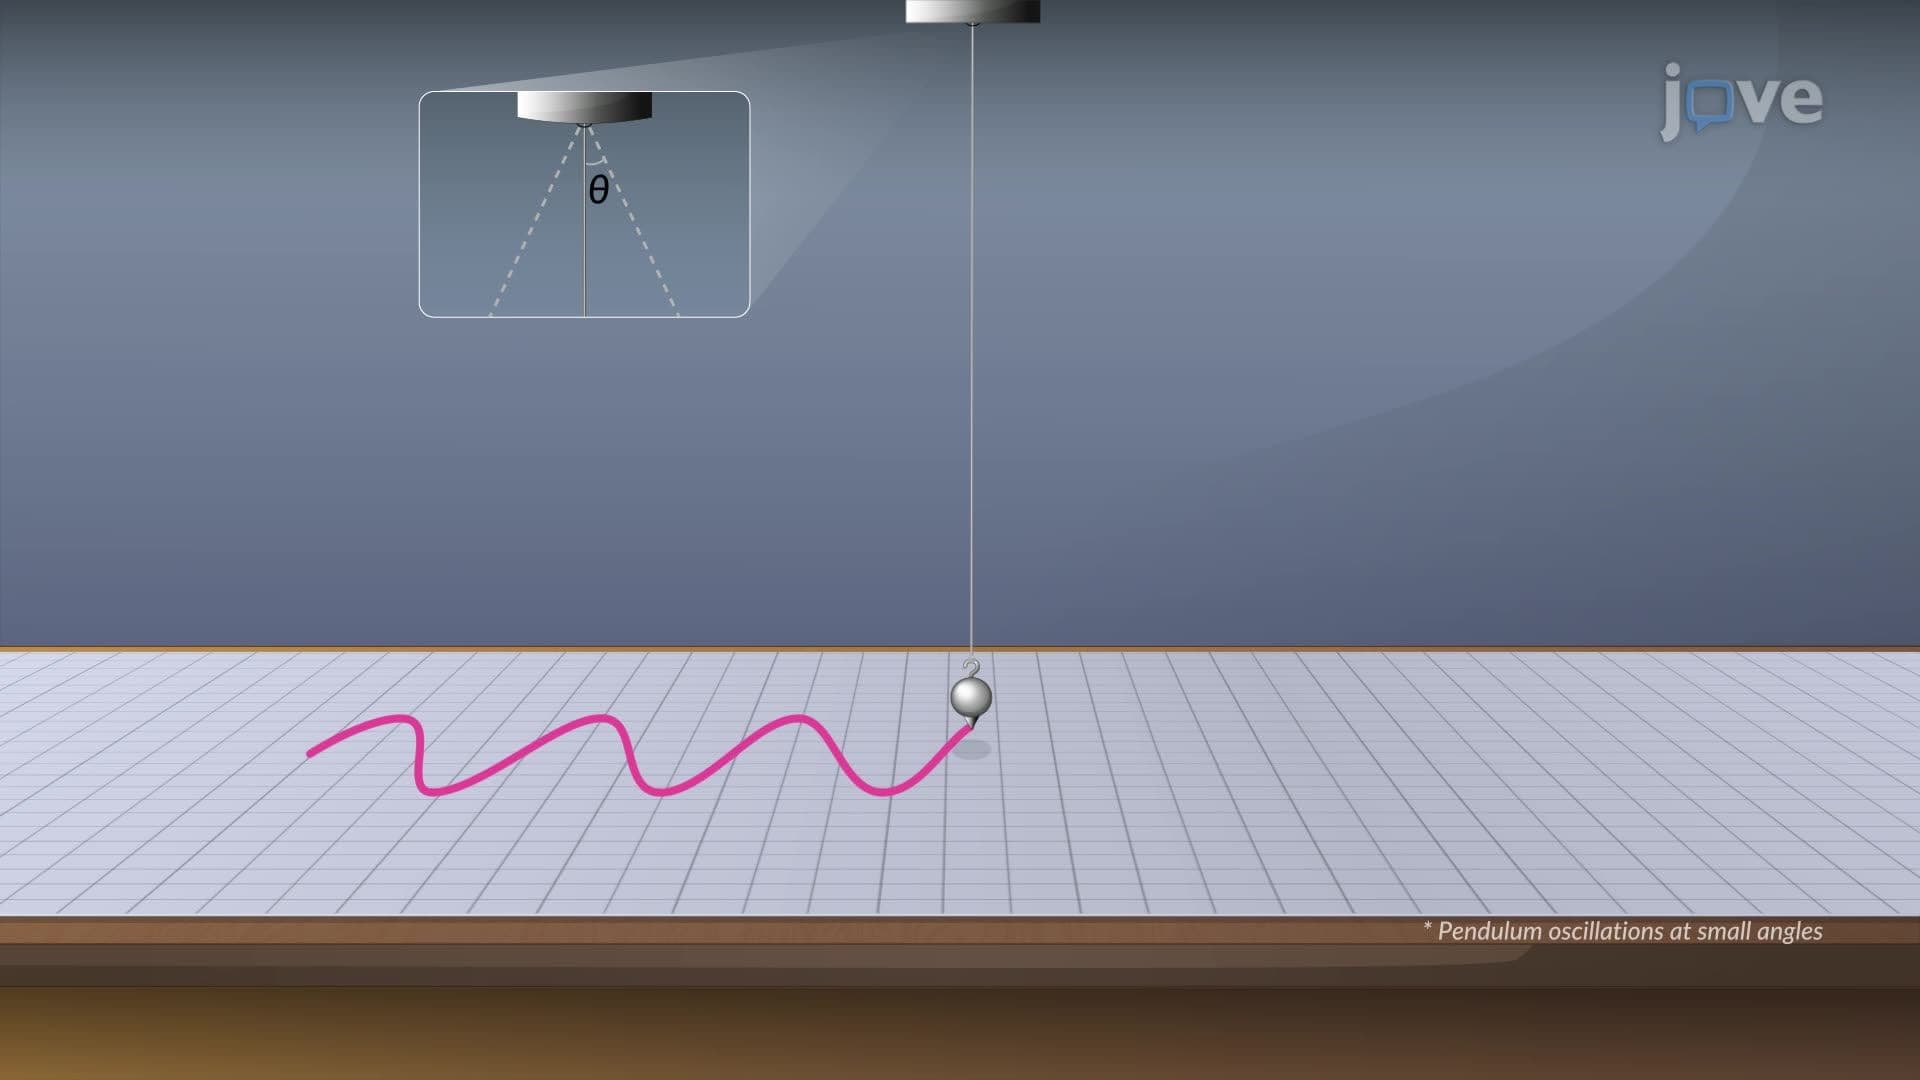
In practical applications, engineers at Boeing use sine and cosine graphs to model aircraft wing vibrations, while meteorologists employ these functions to predict seasonal temperature variations across the United States. The predictable wave pattern helps students understand why these functions excel at modeling cyclical phenomena.
Reciprocal Function Graphs: Secant and Cosecant
The secant and cosecant functions represent reciprocals of cosine and sine, respectively, creating graphs of trigonometric functions with dramatically different characteristics. Both functions maintain the same 2π period as their parent functions but exhibit vertical asymptotes wherever their denominators equal zero. The secant function becomes undefined when cosine equals zero (at π/2, 3π/2, etc.), while cosecant becomes undefined when sine equals zero (at 0, π, 2π, etc.).
These reciprocal relationships create graphs with ranges of (-∞, -1] ∪ [1, ∞), meaning their values never fall between -1 and 1. Students preparing for college trigonometry courses must master identifying these asymptotes and understanding how reciprocal functions behave near their undefined points.
Tangent and Cotangent: Functions with Infinite Range
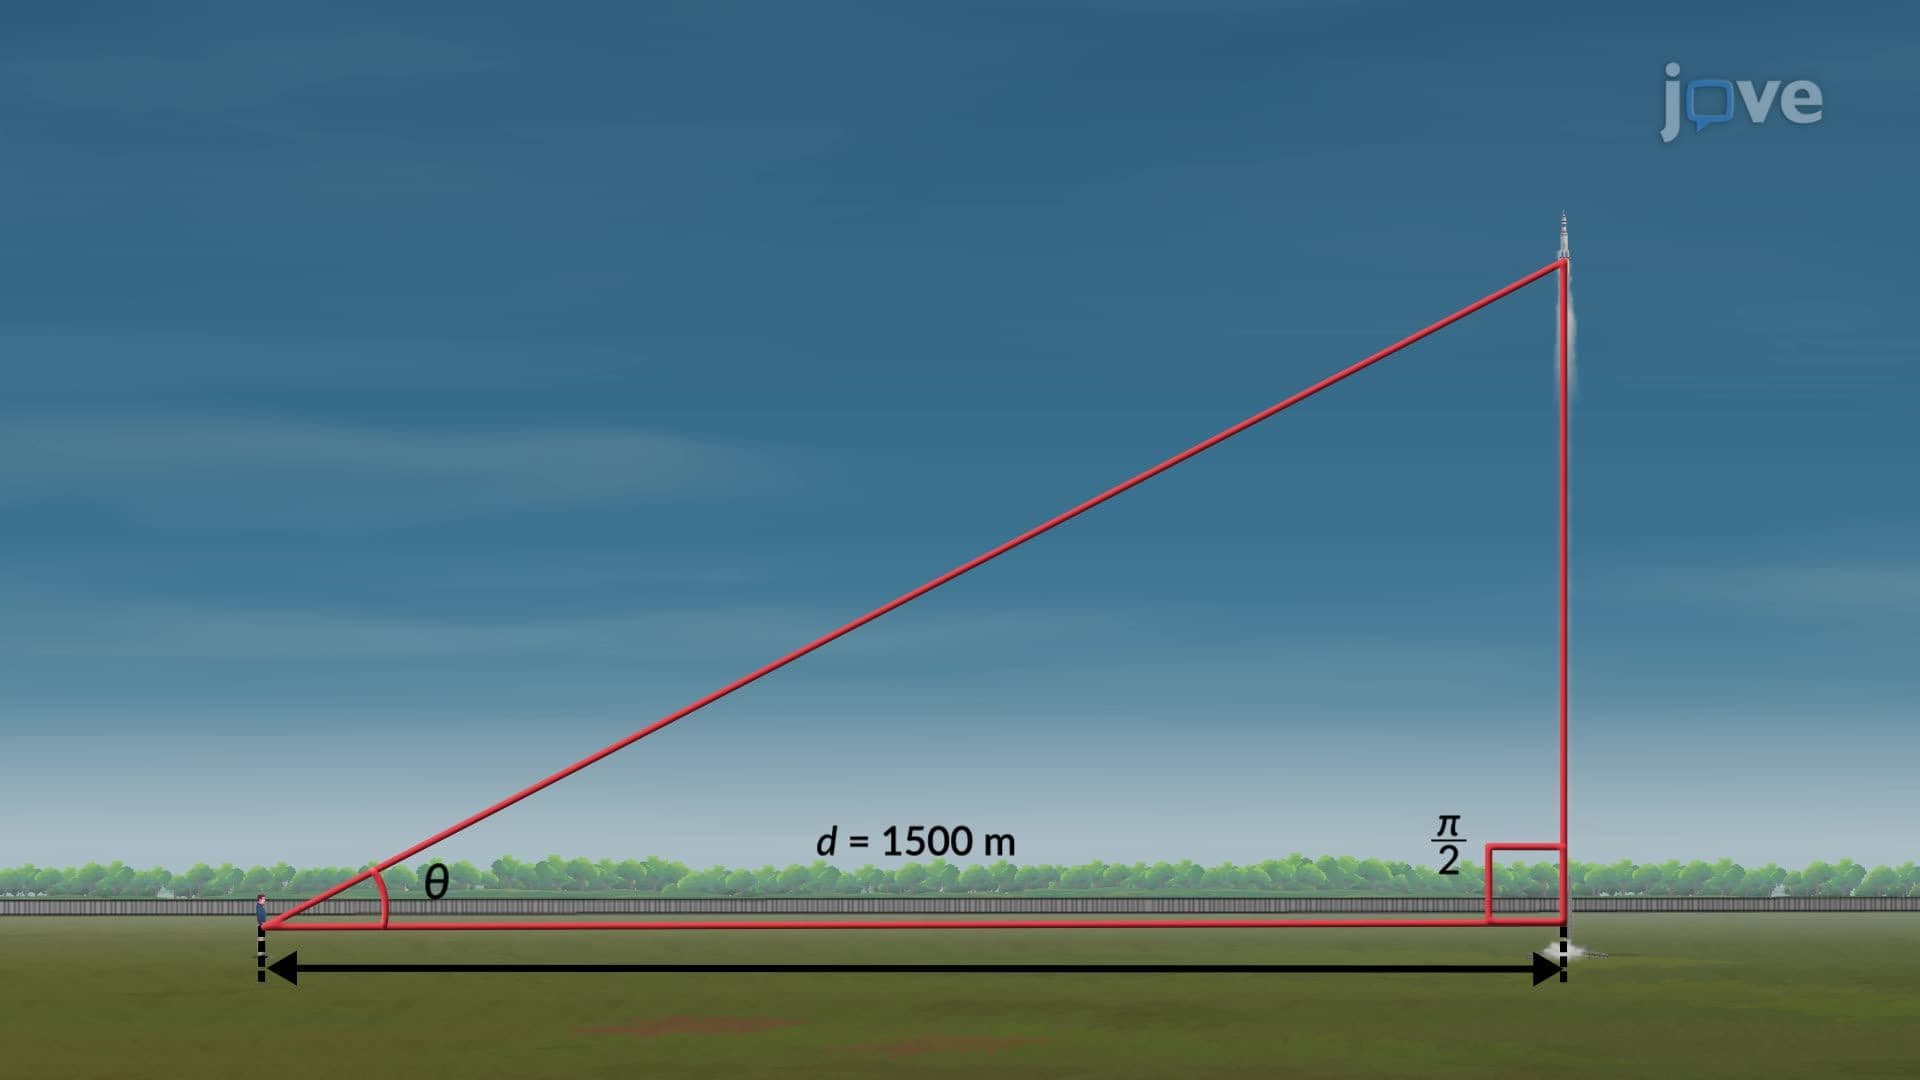
Tangent and cotangent graphs complete the family of types of graphs of trigonometric functions with their unique properties. The tangent function, defined as sine divided by cosine, creates vertical asymptotes wherever cosine equals zero and maintains a period of π rather than 2π. Its range encompasses all real numbers, making it invaluable for modeling phenomena with unlimited growth potential.
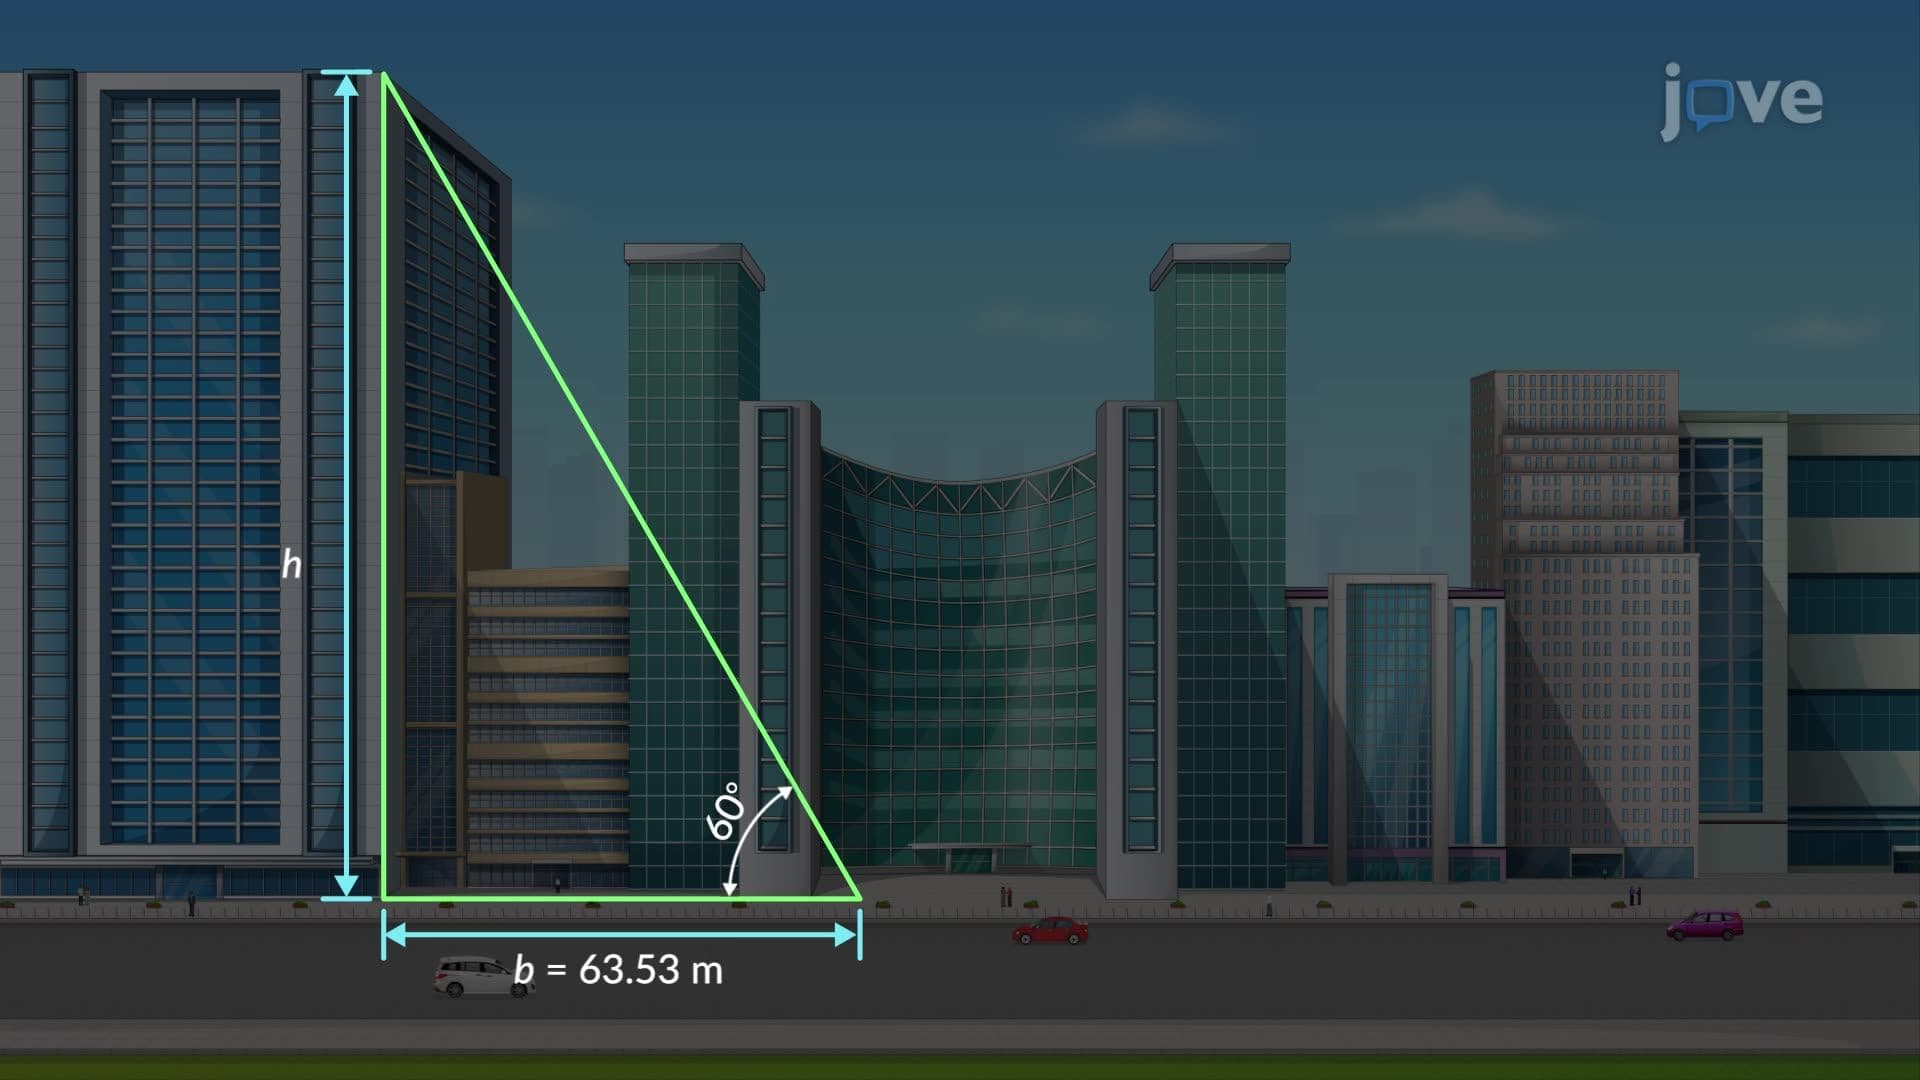
Students encounter these concepts extensively in precalculus courses and standardized tests. Understanding how tangent graphs model real-world scenarios-such as the angle of elevation for constructing wheelchair ramps or calculating shadow lengths throughout the day-helps solidify the practical importance of trigonometric graphing in engineering and architecture applications.
Frequently Asked Questions
Graphs of trigonometric functions are visual representations of how trigonometric ratios change as angles vary, created by tracking coordinate projections of points moving around the unit circle. As a point travels counterclockwise around the circle, its vertical position creates the sine wave and its horizontal position generates the cosine wave. This geometric relationship transforms circular motion into the familiar wave patterns students learn to analyze and apply.
The AP Calculus AB and BC exams primarily focus on sine, cosine, and tangent function graphs, along with their transformations and derivatives. You'll need to identify key features like amplitude, period, phase shifts, and vertical shifts in these graphs. Additionally, understanding how to find maximum and minimum values, points of inflection, and intervals of increase/decrease becomes crucial for free-response questions involving trigonometric functions.
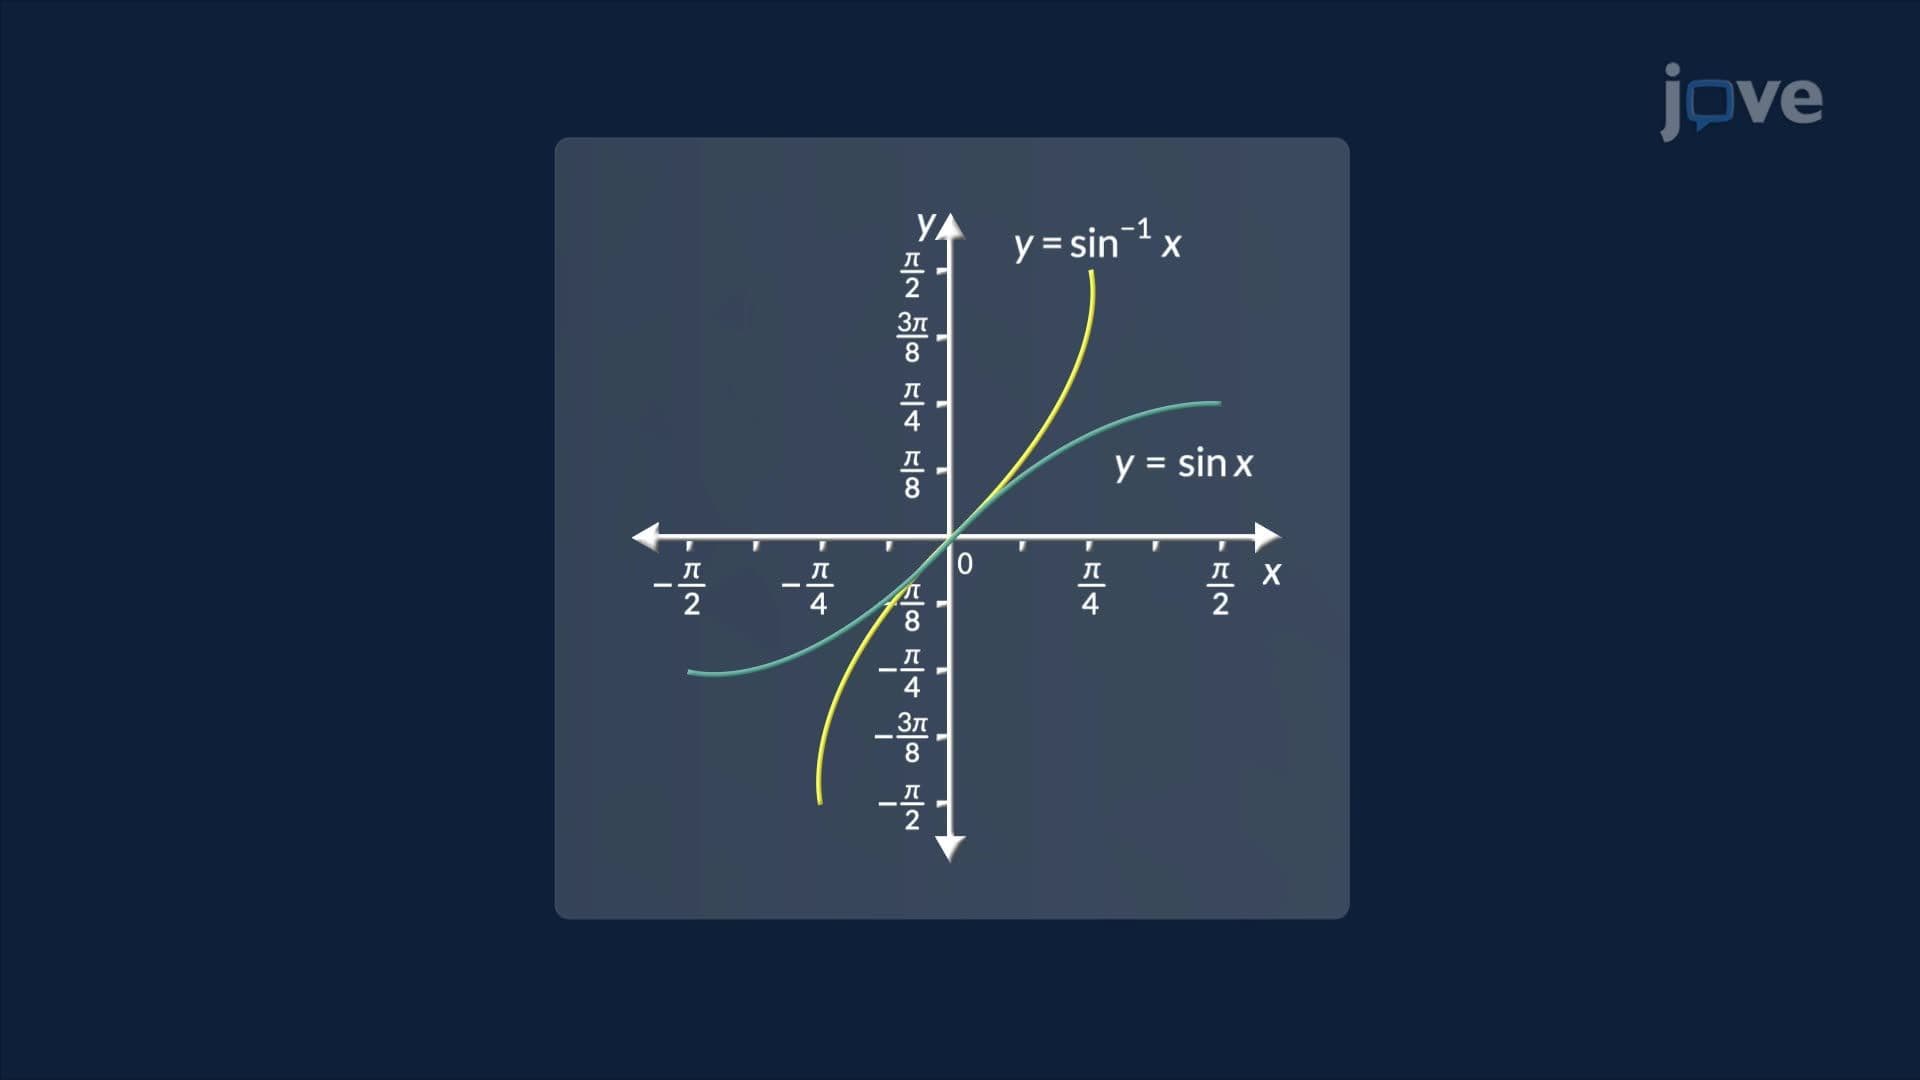
The SAT Subject Test in Mathematics Level 2 includes questions about all six trigonometric function graphs, their properties, and transformations. You'll encounter problems requiring identification of amplitude, period, domain, range, and asymptotes. The test also covers inverse trigonometric functions and their graphs, making comprehensive understanding of trigonometric graphing essential for achieving high scores.
Engineers at NASA use trigonometric graphs to model satellite orbital patterns and predict communication windows with ground stations. Acoustic engineers designing concert halls like those at Lincoln Center apply sine and cosine functions to optimize sound wave propagation. Additionally, economists use trigonometric models to analyze seasonal business cycles, while biomedical researchers employ these functions to study circadian rhythms and heart rate variability patterns.
Students with solid Algebra 2 foundations can successfully master trigonometric function graphs through systematic practice and visual learning approaches. The key lies in understanding the unit circle first, then connecting circular motion to wave patterns. Most high school students find these concepts manageable when they focus on memorizing key angle values and practicing transformation techniques regularly.
Create comparison charts listing domain, range, period, and asymptotes for each function type, then practice sketching graphs from memory daily. Use mnemonic devices like "SOH-CAH-TOA" and connect each function to its unit circle definition. Additionally, work through transformation problems systematically, starting with basic parent functions before adding amplitude changes, period modifications, and phase shifts.
Progress to trigonometric identities and their graphical representations, followed by inverse trigonometric functions and their restricted domains. Advanced students should explore parametric equations involving trigonometric functions and their applications in calculus, particularly related rates problems and optimization scenarios. These concepts prepare you for multivariable calculus and differential equations courses in college mathematics programs.
Related Micro-courses
4 Concepts

8 Concepts
7 Concepts