Loading subject page…


18,577 views

Video Summary: Stress Strain Diagram Ductile Materials Guide
Ever wonder why a steel bridge can bend during an earthquake without collapsing? The stress strain diagram ductile materials concept reveals how materials like structural steel used in San Francisco's Golden Gate Bridge respond predictably to forces. This diagram maps the relationship between applied stress and resulting deformation, showing distinct phases from elastic behavior through plastic deformation to ultimate failure. Understanding these material responses is crucial for engineering safe structures and predicting failure points. Watch the full video on JoVE Coach to master this concept with expert-led visuals and step-by-step explanations.
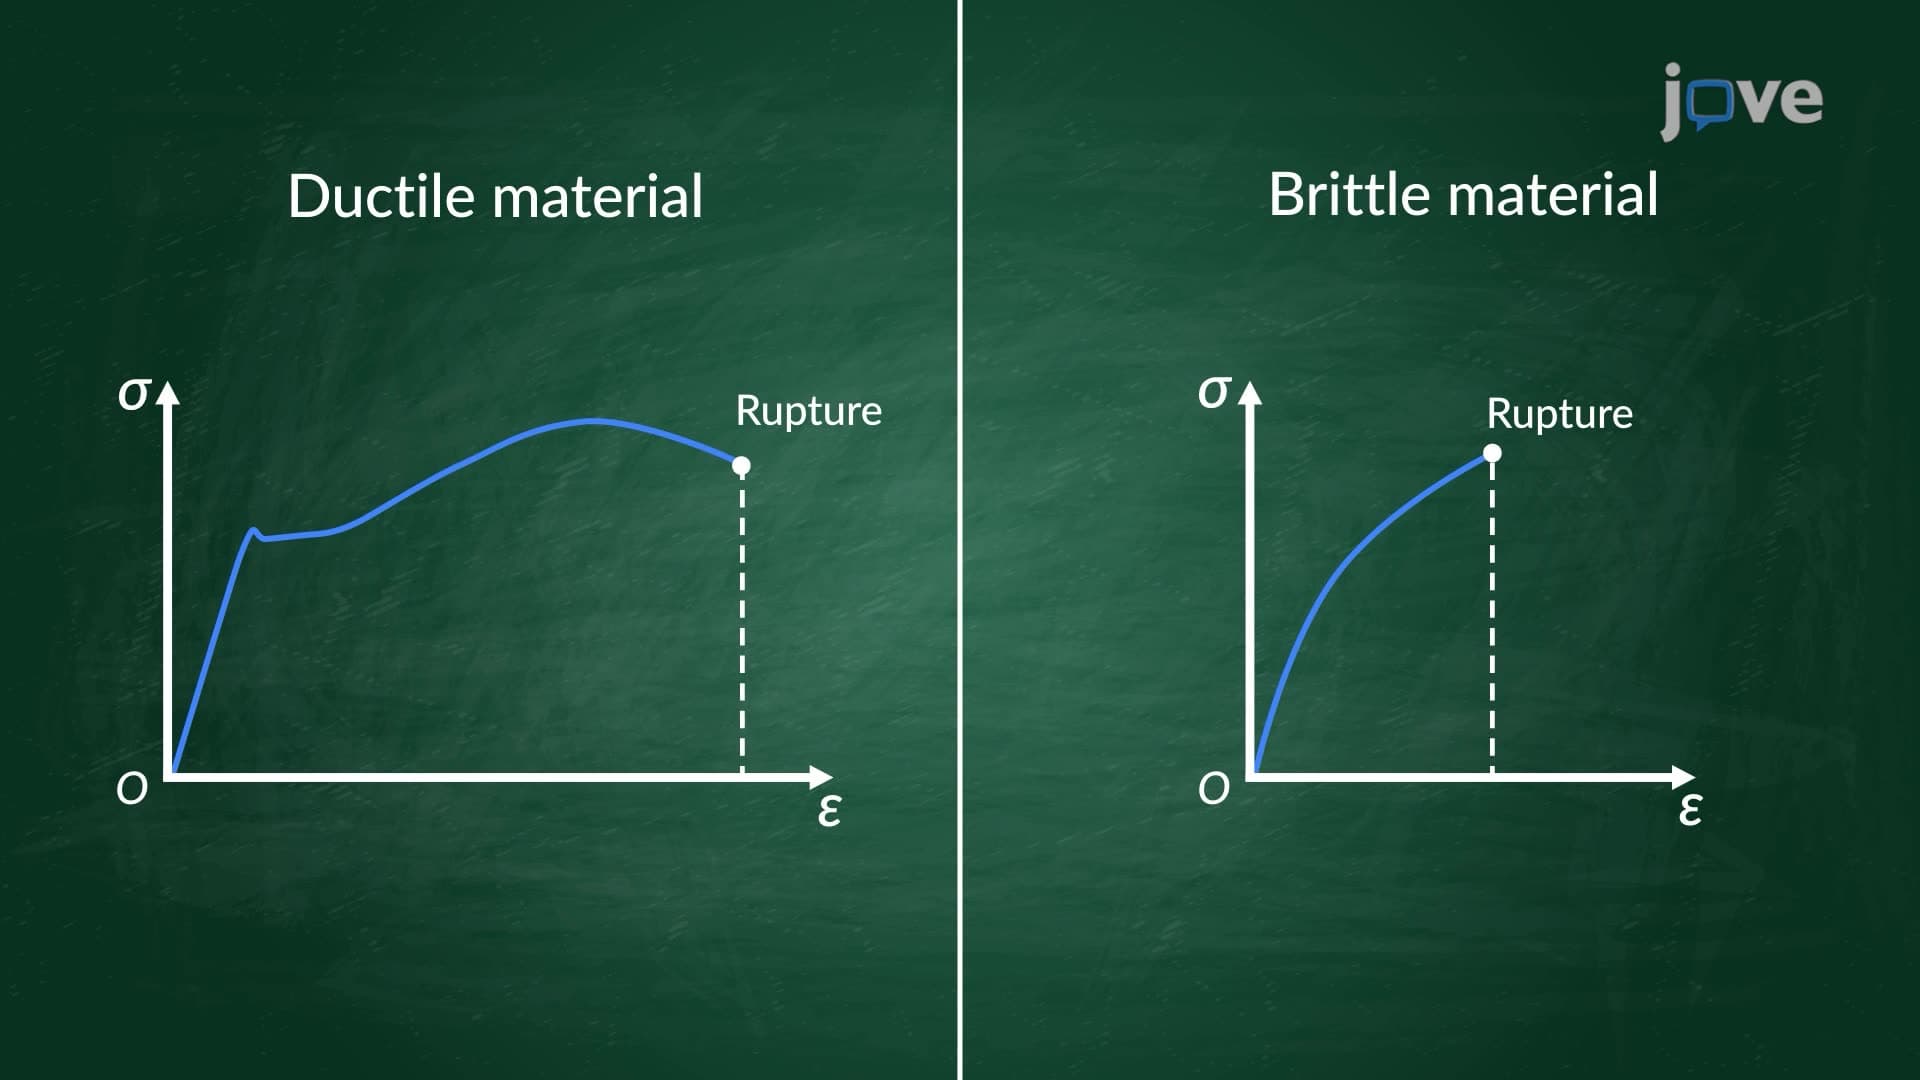
The stress strain diagram ductile materials concept provides engineers with a roadmap for predicting how materials behave under load. Unlike brittle materials that fracture suddenly, ductile materials like steel, aluminum, and copper undergo significant plastic deformation before failure, making them invaluable for structural applications.
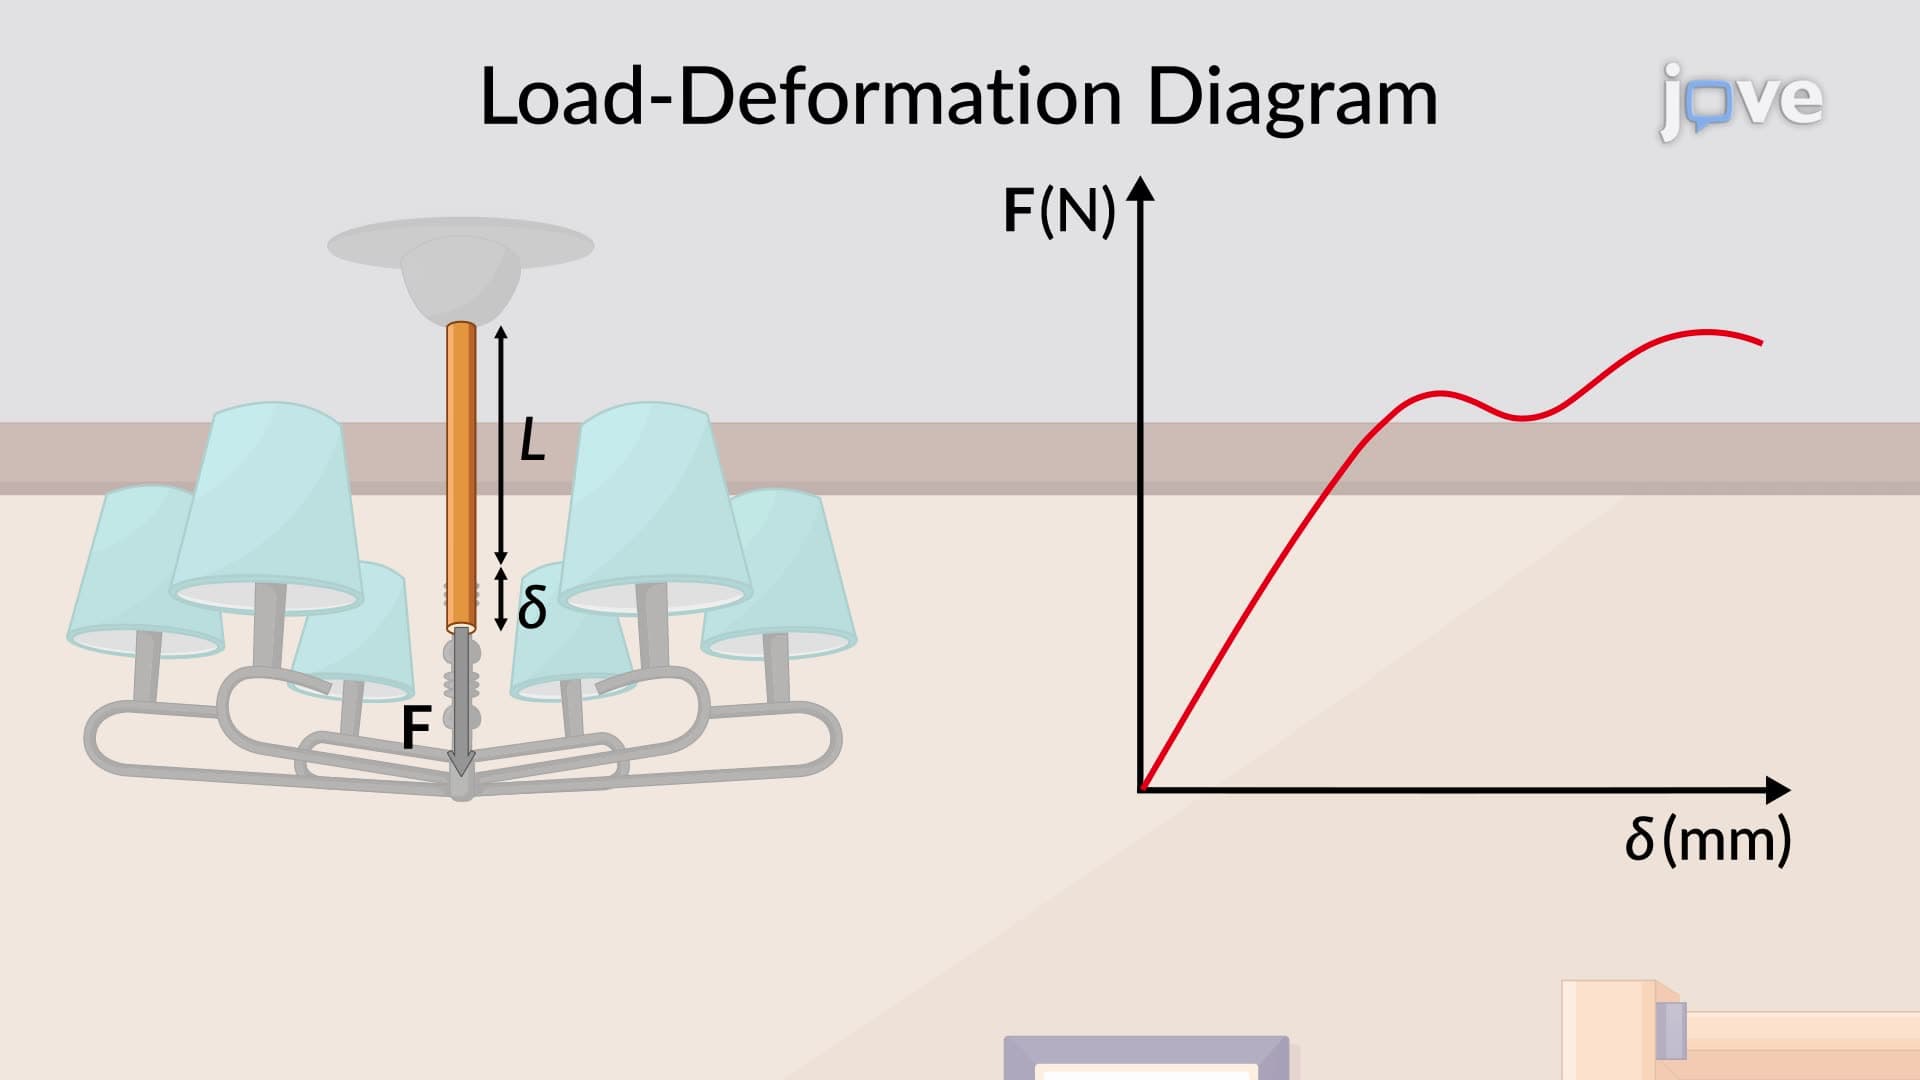
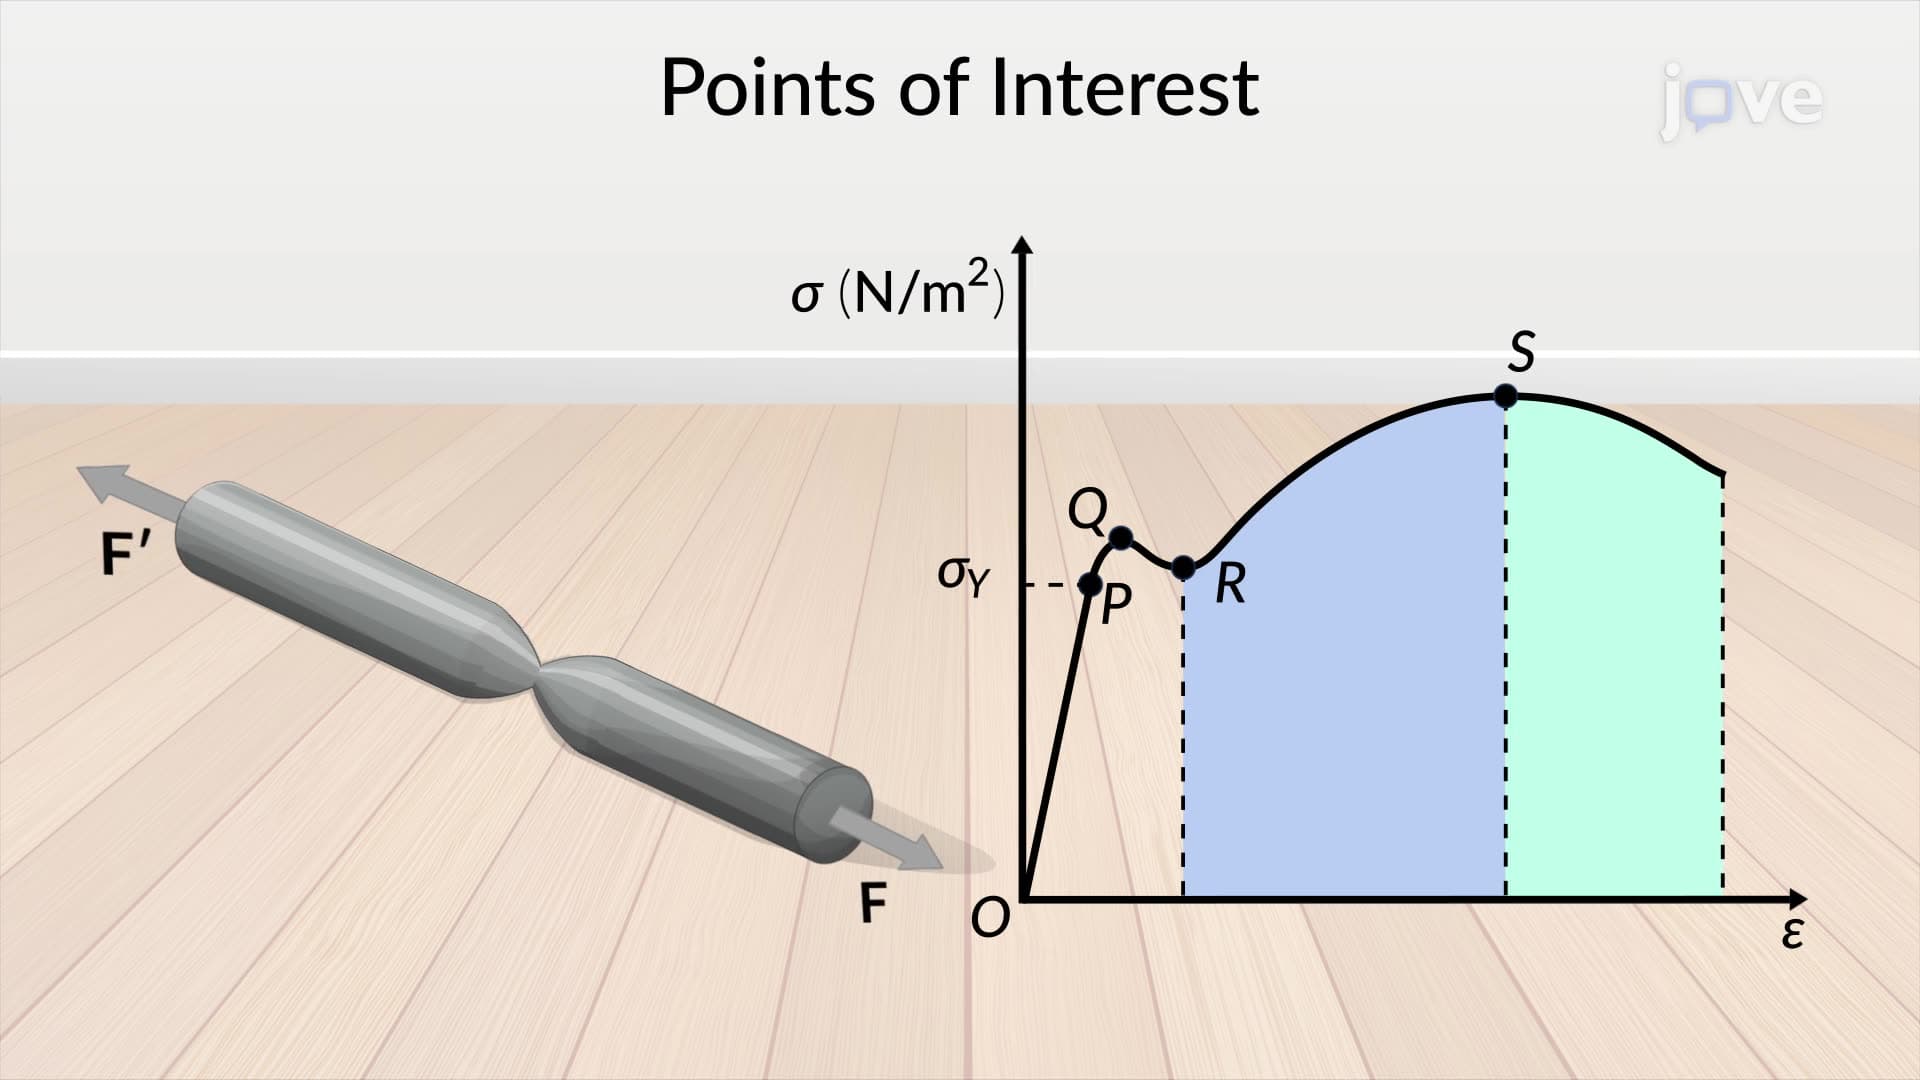
This diagram plots stress (force per unit area) on the vertical axis against strain (change in length divided by original length) on the horizontal axis. The resulting curve reveals four distinct regions that tell the complete story of material behavior from initial loading to catastrophic failure.
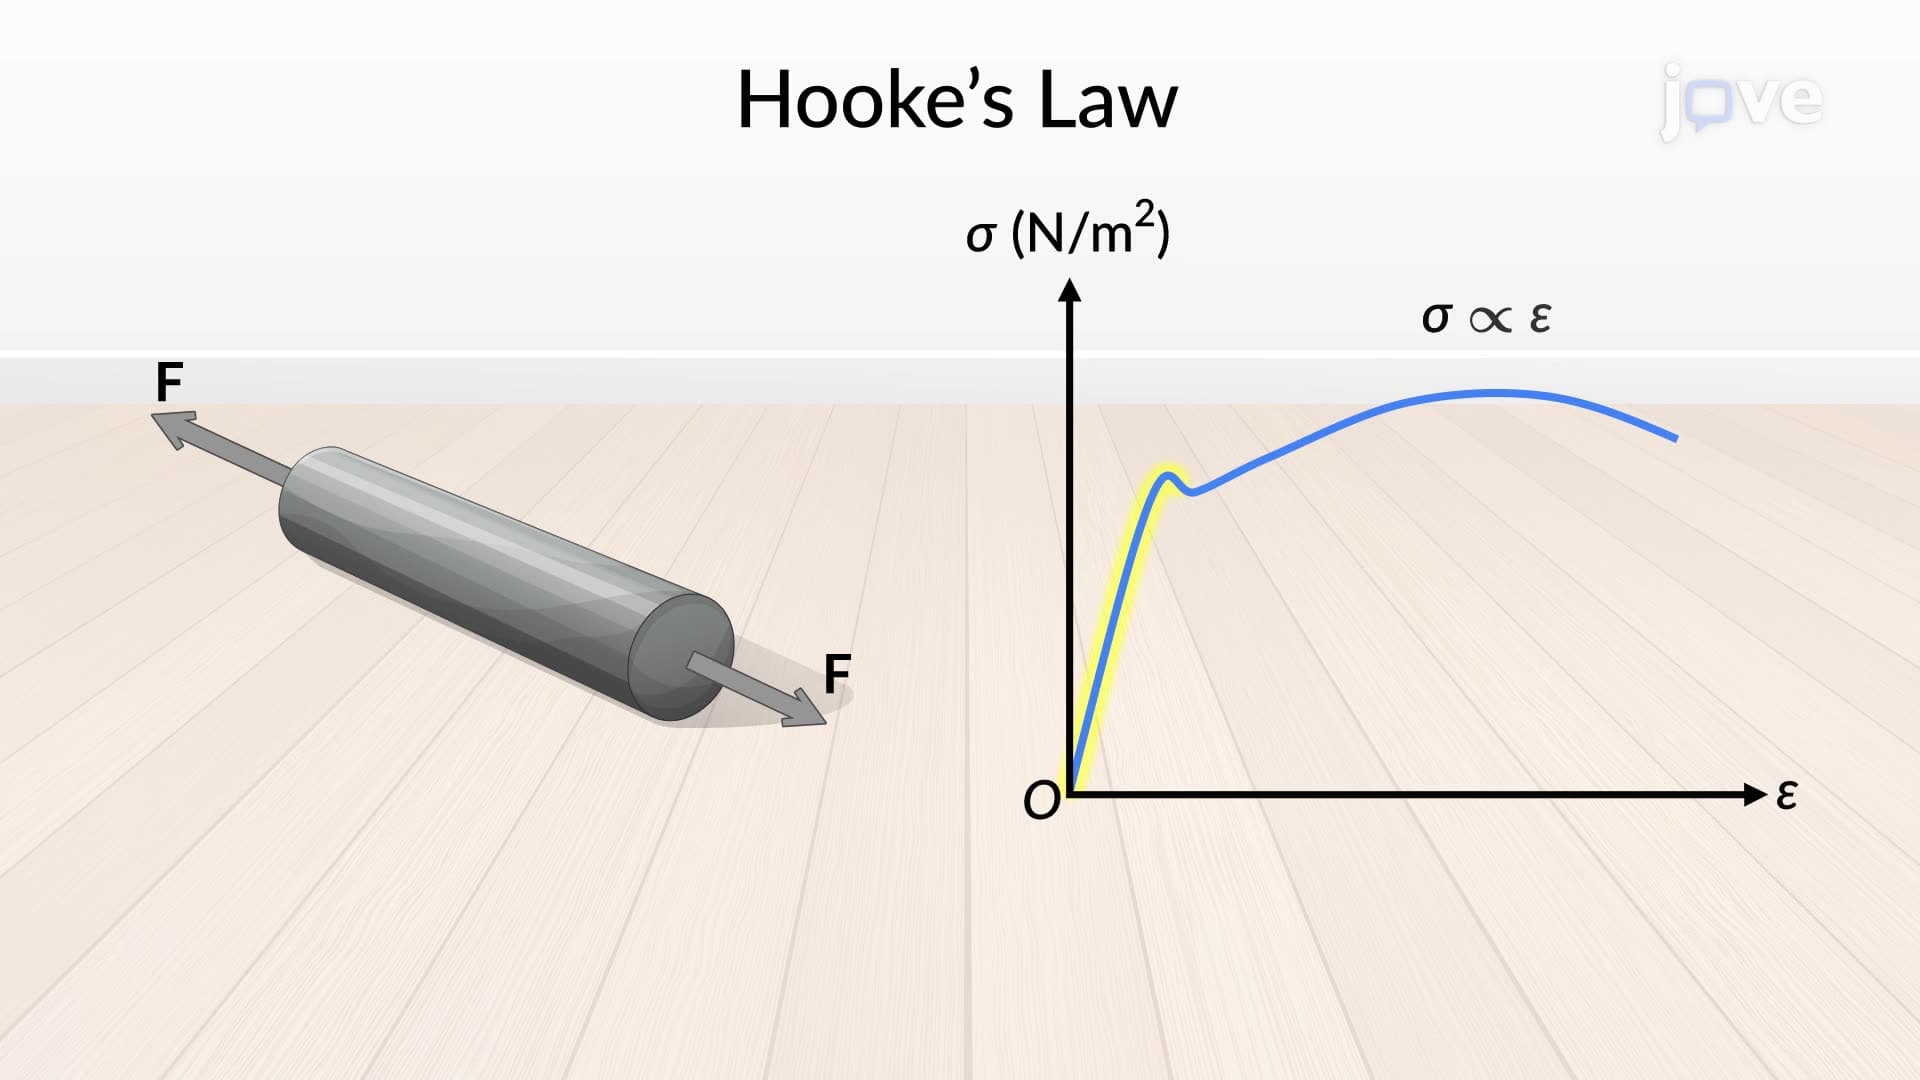
The elastic region forms the initial straight-line portion where materials obey Hooke's Law. Here, stress and strain maintain a linear relationship, and the slope represents the material's modulus of elasticity. For structural steel used in skyscrapers like New York's One World Trade Center, this modulus typically reaches 29 million psi, indicating exceptional stiffness.
The yielding region marks the transition from elastic to plastic behavior. At the yield strength, materials begin permanent deformation. Structural steel yields around 36,000-50,000 psi, while aluminum alloys used in aircraft typically yield at 35,000-40,000 psi. This point determines the maximum safe working stress for engineering designs.
The strain-hardening region shows increasing stress capacity as materials work-harden through dislocation interactions at the atomic level. Steel demonstrates relatively constant stress during this phase, while aluminum exhibits continuously increasing stress until reaching ultimate strength.
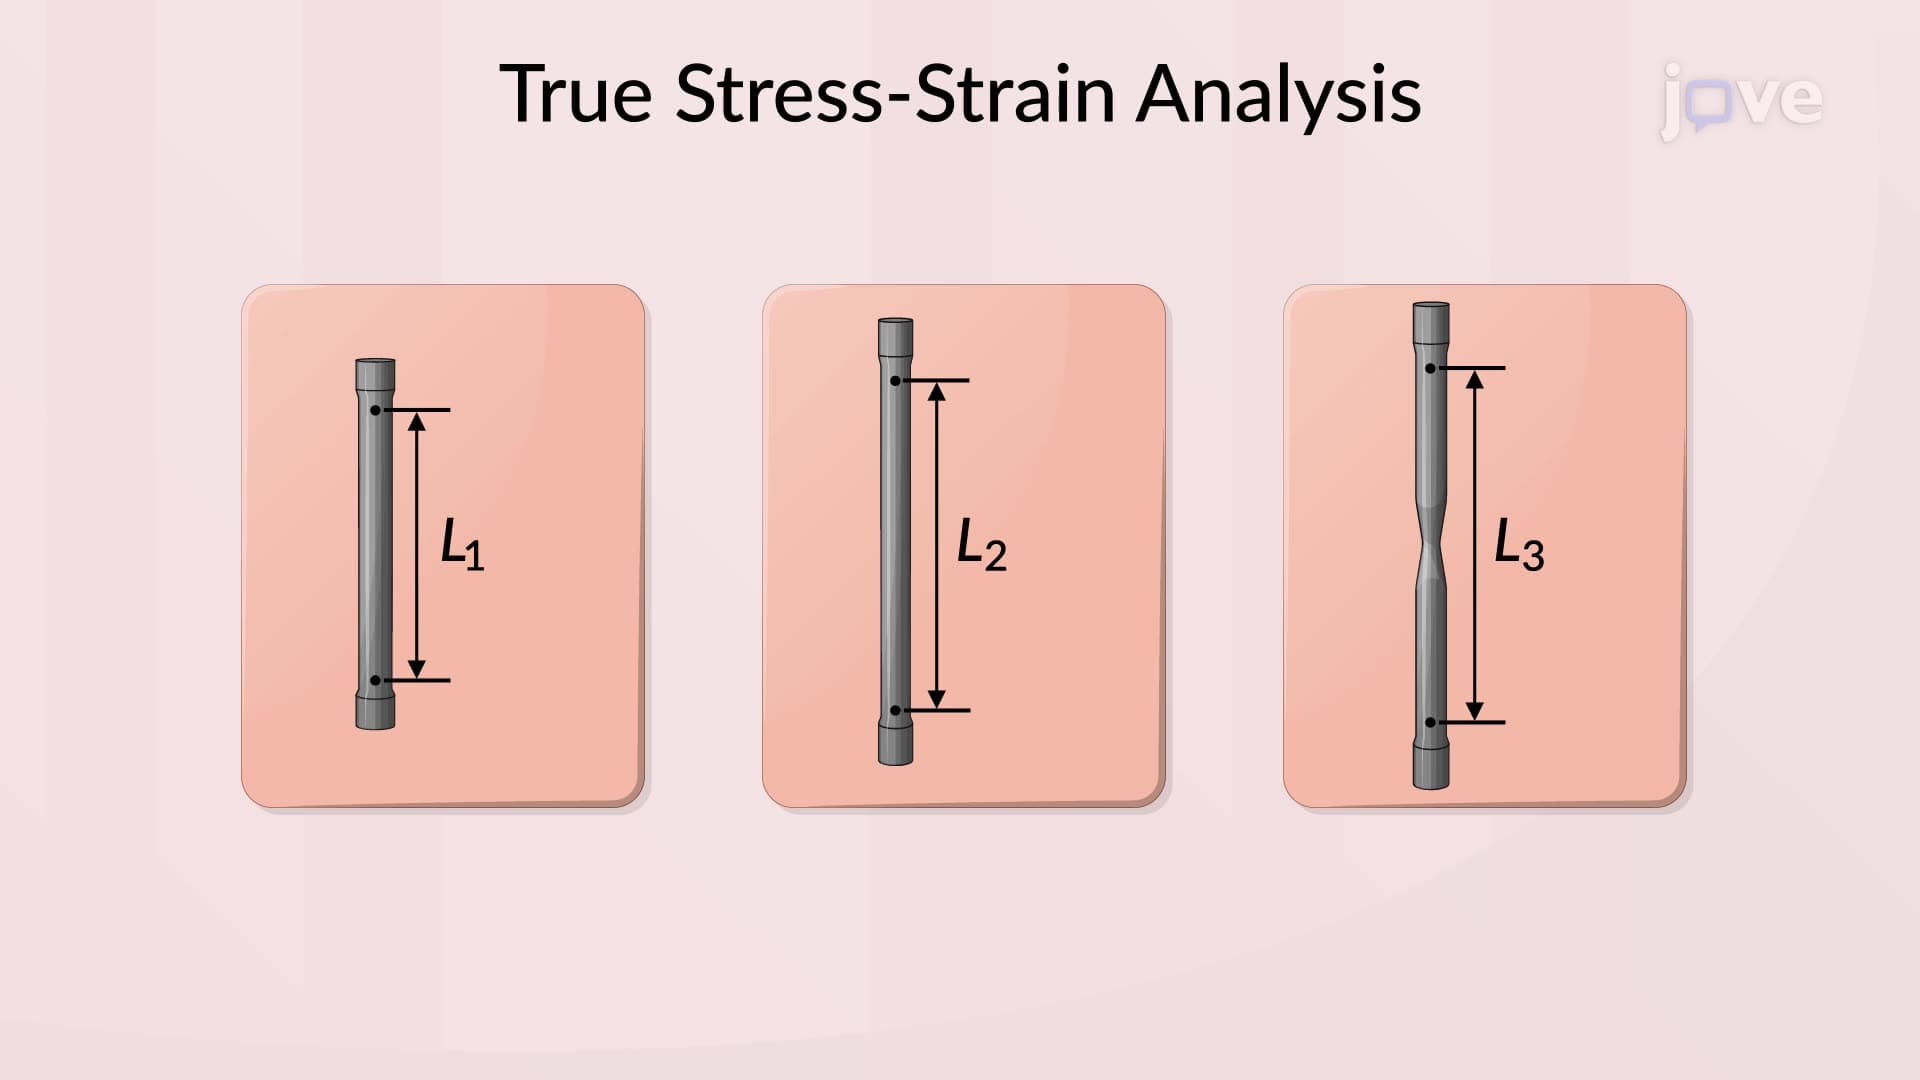
The necking and failure region occurs when local cross-sectional area reduction concentrates stress, leading to rapid failure. Understanding this phenomenon helps engineers design safety factors and predict failure modes.
These concepts appear frequently on AP Physics exams, college materials science courses, and engineering fundamentals examinations. Students should memorize typical values: structural steel (yield ~40,000 psi, ultimate ~65,000 psi) and aluminum (yield ~35,000 psi, ultimate ~45,000 psi).
Ductility measurements like percent elongation (typically 20-25% for steel) and percent area reduction (50-70% for steel) quantify a material's ability to deform before fracture. These values directly influence material selection for applications ranging from automotive components to building frameworks, making this knowledge essential for engineering problem-solving and design optimization.
Related Micro-courses