Loading subject page…


18,577 views


Video Summary: What Is Stress Strain Diagram
Ever wonder why skyscrapers don't collapse under their own weight or how engineers design bridges to handle massive traffic loads? The stress strain diagram is the fundamental tool that reveals how materials behave under force, making modern construction possible. From the steel beams in New York's One World Trade Center to the aluminum frames in Boeing aircraft, understanding material response to stress is crucial for safe engineering design. What is stress strain diagram? It's a graphical representation that plots how materials deform when subjected to increasing loads, showing the relationship between applied stress and resulting strain. Watch the full video on JoVE Coach to master this concept with expert-led visuals and step-by-step explanations.
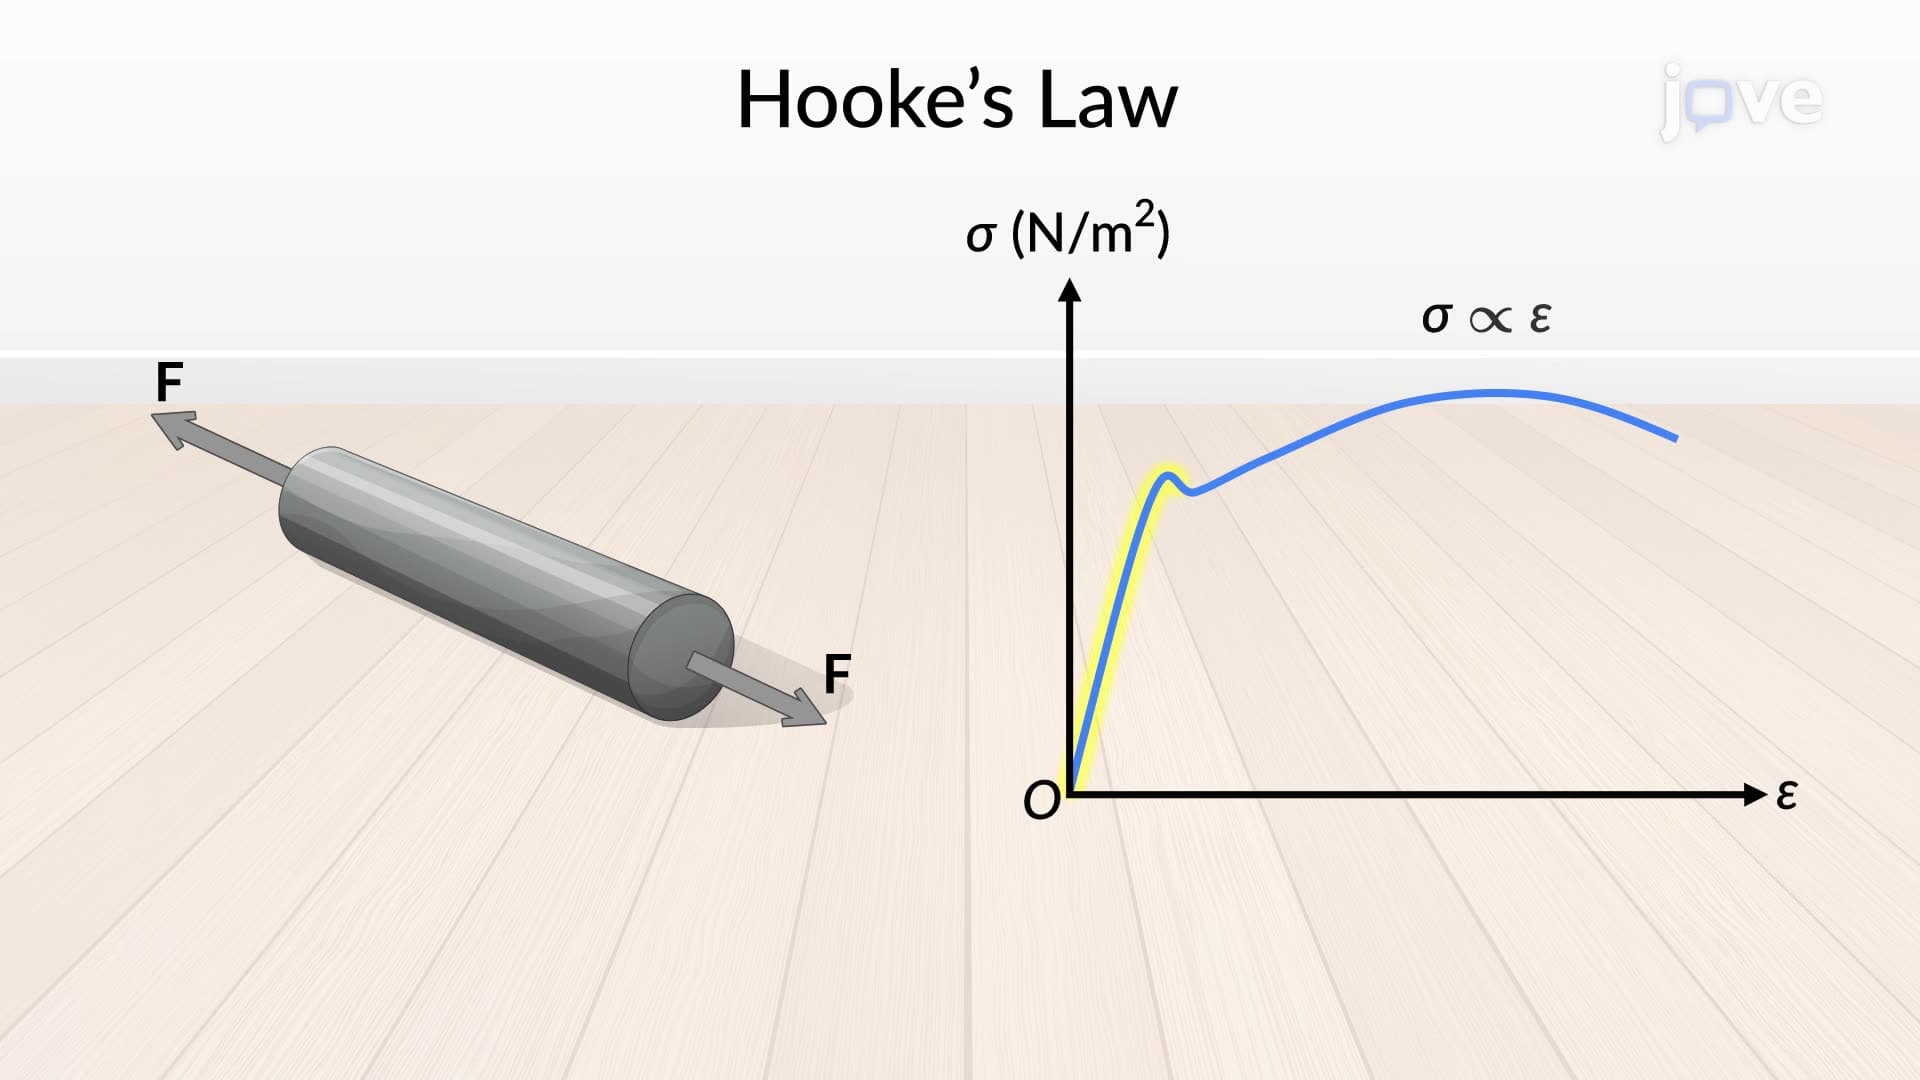
The stress strain diagram serves as the cornerstone of materials engineering, providing critical insights into how substances respond under load. This graphical representation plots strain (deformation) on the x-axis against stress (force per unit area) on the y-axis, creating a unique fingerprint for each material's mechanical behavior.
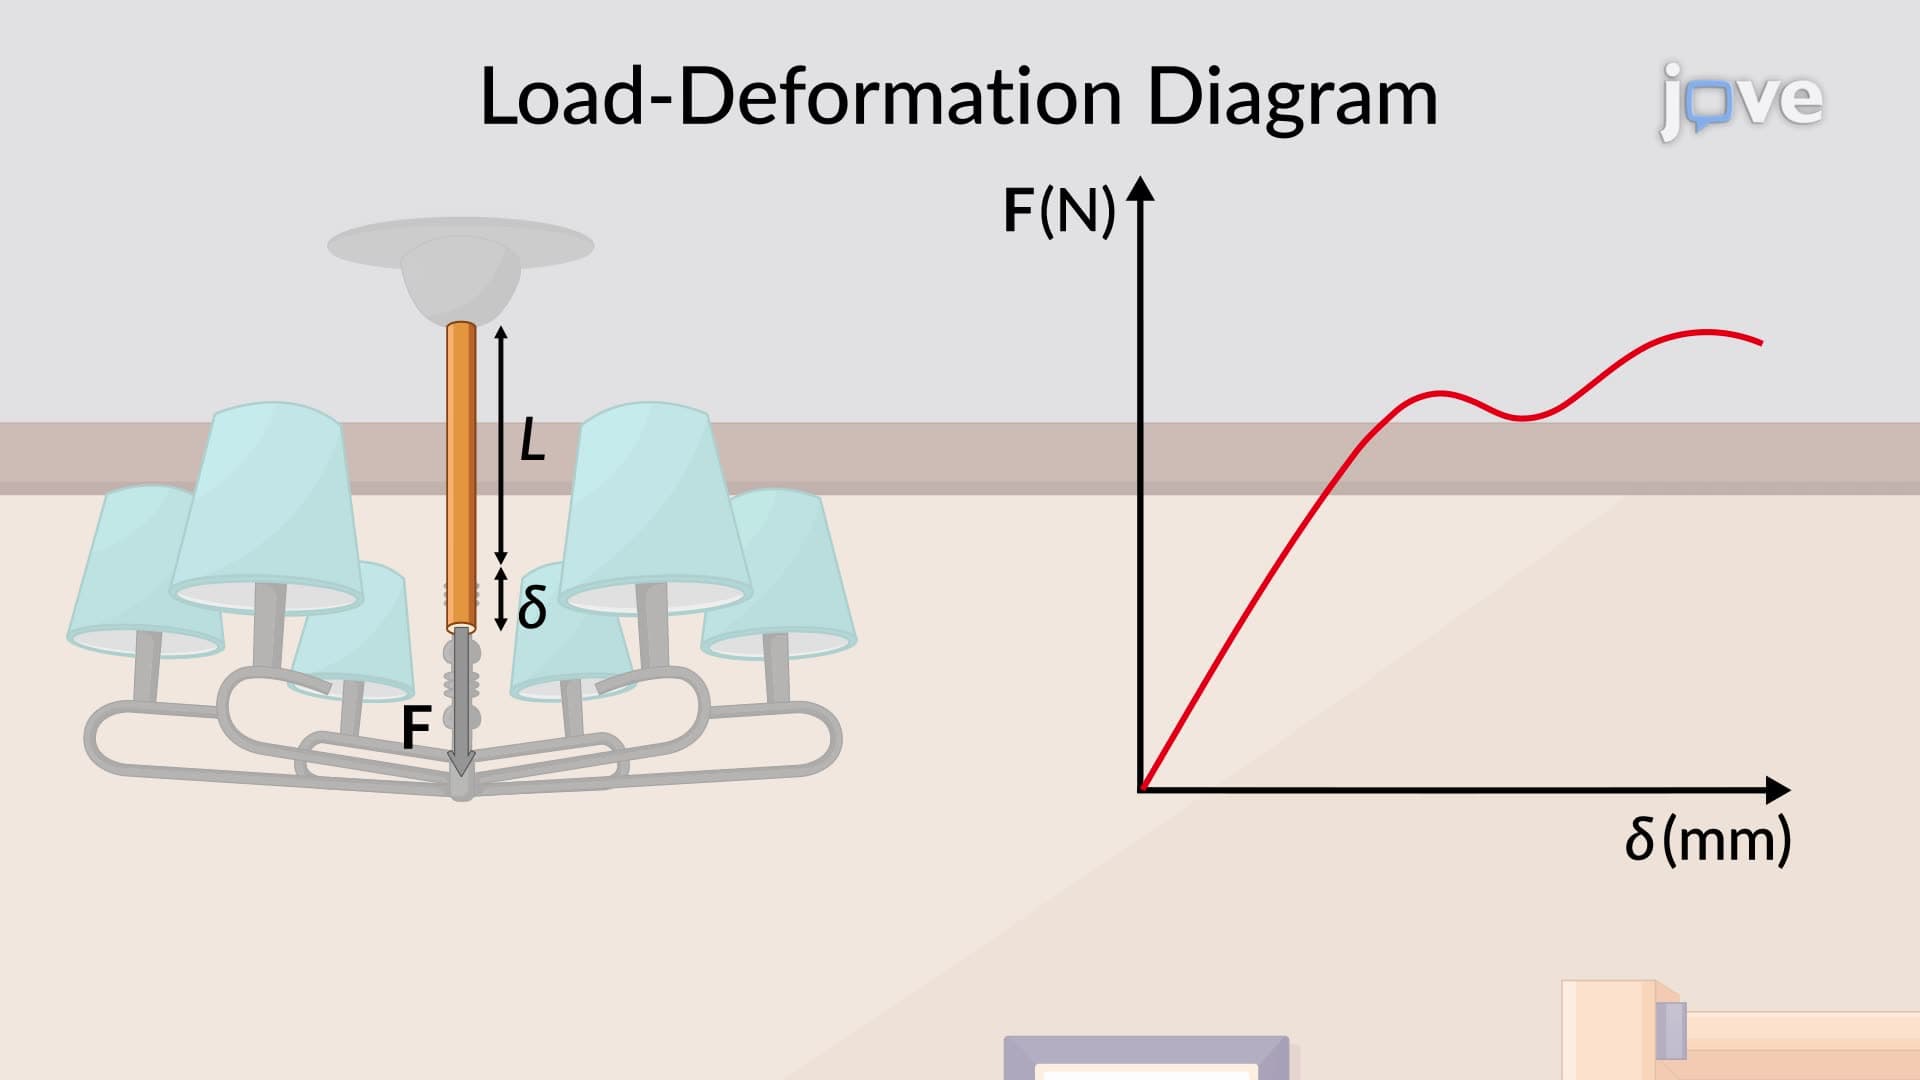
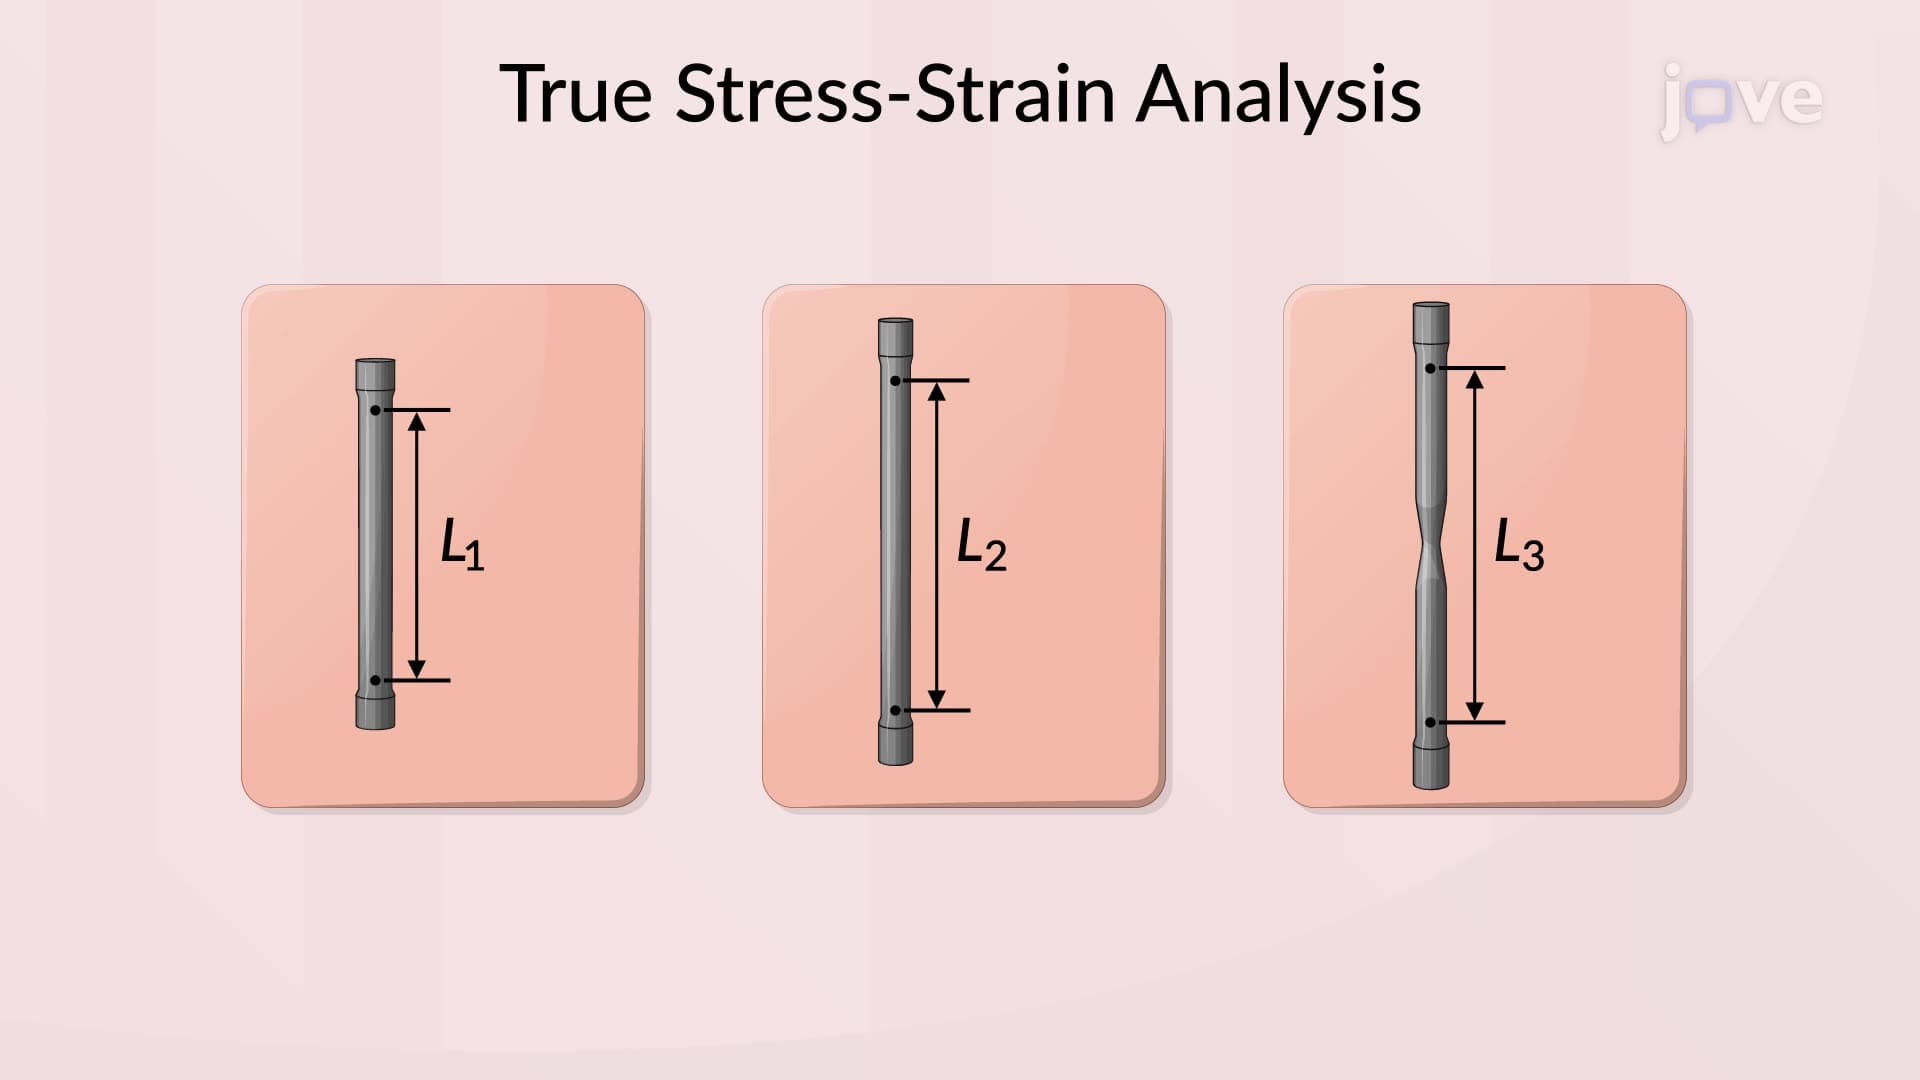
Creating an accurate stress strain diagram requires precise experimental procedures. Engineers use standardized cylindrical specimens with gauge marks inscribed at specific intervals, typically following ASTM (American Society for Testing and Materials) standards. The gauge length-the measured distance between these marks-serves as the reference for calculating strain. As tensile loads increase incrementally, sophisticated equipment records both the elongation and any diameter changes, ensuring comprehensive data collection for the stress strain diagram analysis.
The fundamental equations governing stress strain diagram construction are elegantly simple yet powerful. Stress equals the applied load divided by the original cross-sectional area (σ = F/A₀), while strain represents the change in length divided by the original gauge length (ε = ΔL/L₀). These calculations form the basis for plotting each point on the stress strain diagram, revealing material properties essential for engineering applications.
Understanding stress strain diagrams proves invaluable across multiple disciplines. Mechanical engineering students at institutions like MIT and Stanford rely on these concepts for structural analysis courses. The principles appear frequently on AP Physics exams, particularly in mechanics sections, and form core material for college-level materials science programs. Professional engineers use stress strain diagram data to design everything from automotive components to aerospace structures, ensuring safety margins meet federal regulations.
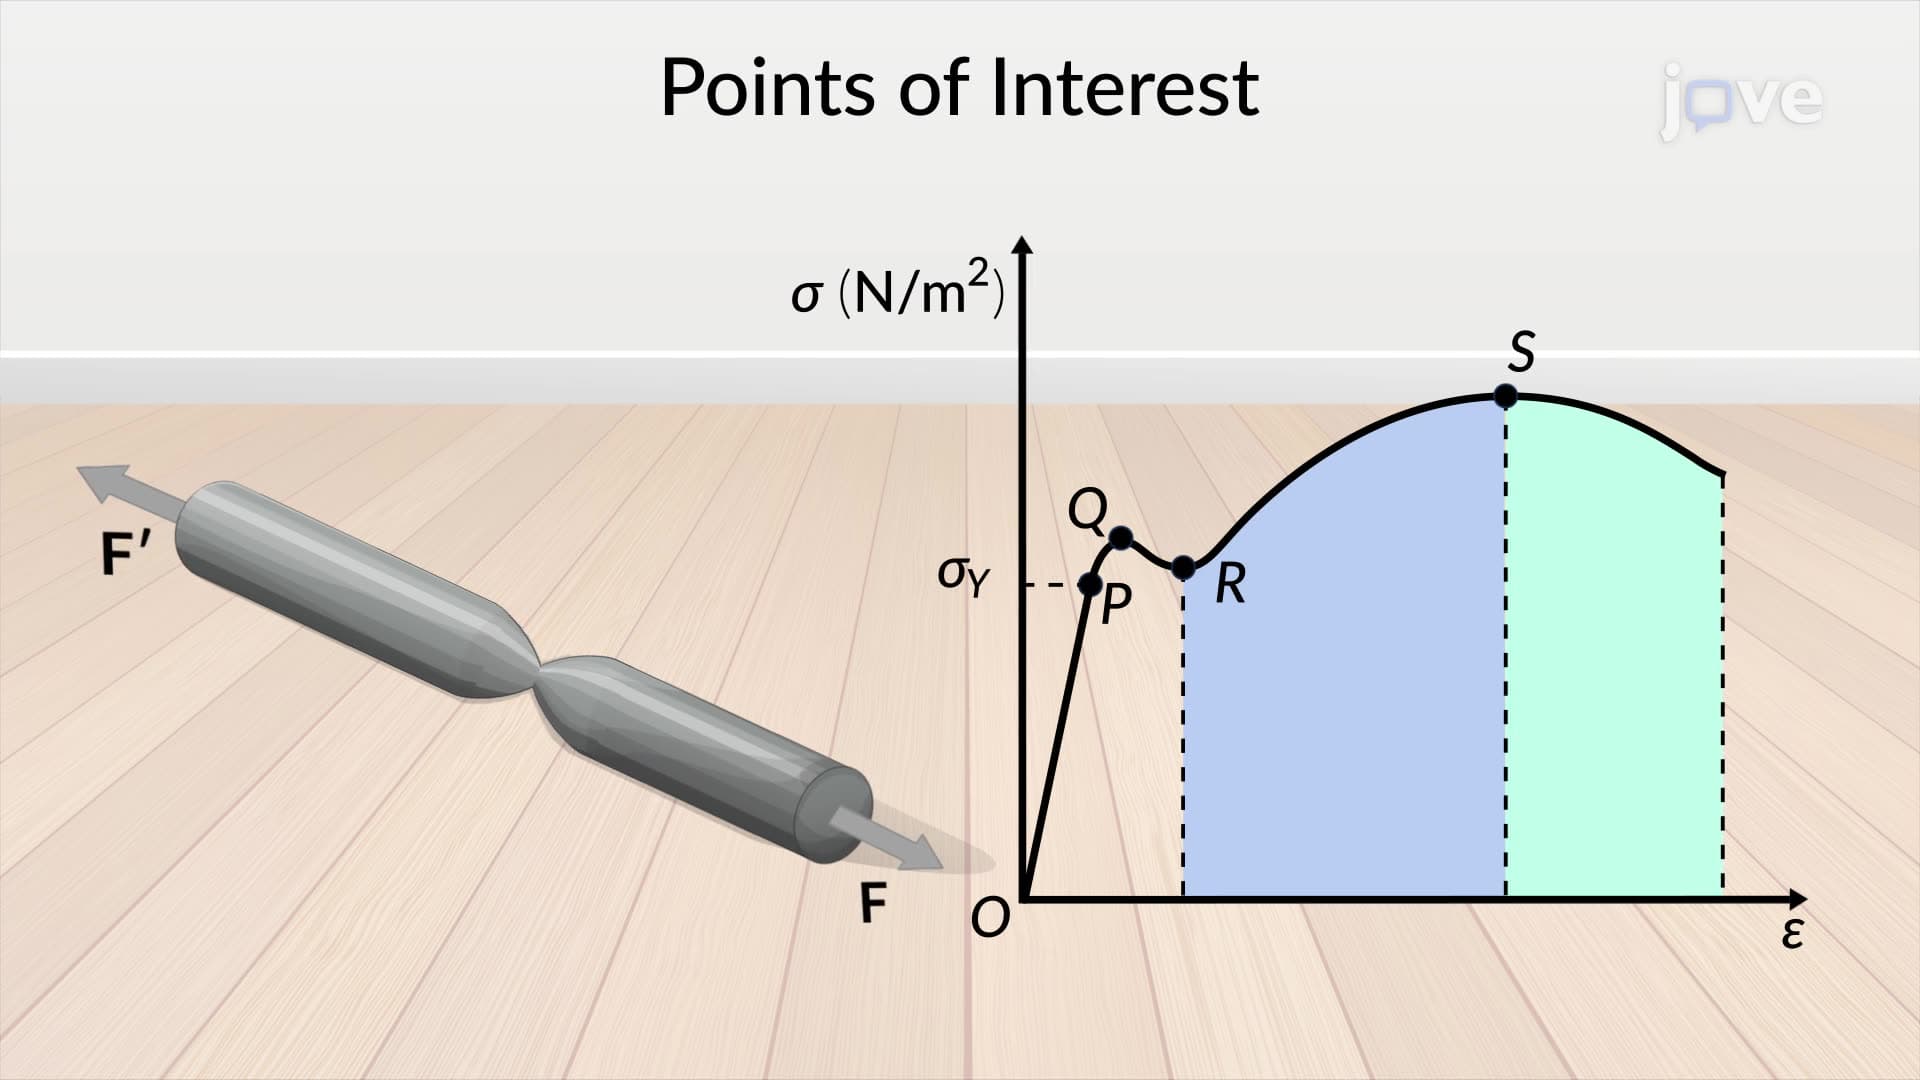
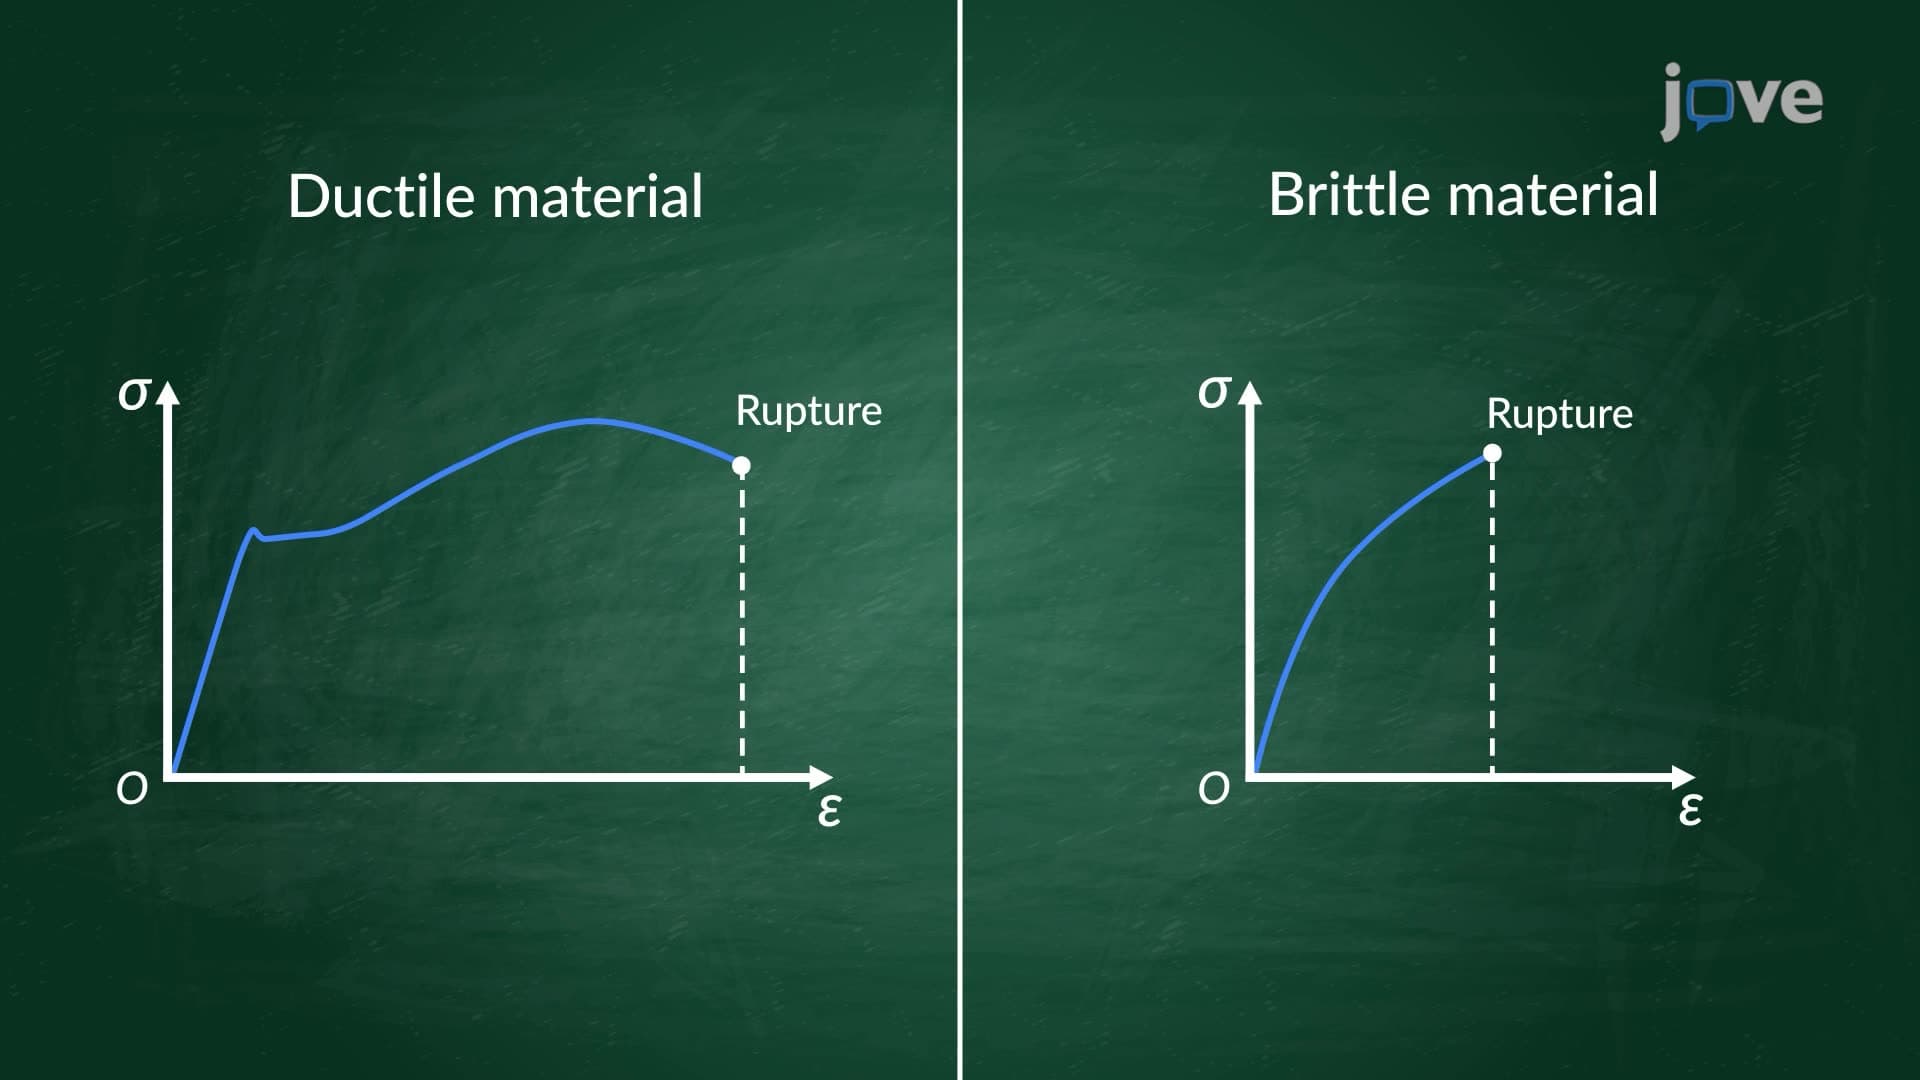
The linear elastic region of the stress strain diagram corresponds to Hooke's Law, where materials return to their original shape after load removal. This relationship helps engineers design structures like California's Golden Gate Bridge, where understanding elastic limits prevents catastrophic failure. As loads increase beyond the elastic limit, the stress strain diagram reveals yielding behavior, crucial for designing ductile materials used in earthquake-resistant buildings throughout seismically active regions like the Pacific Coast.
Related Micro-courses