Loading subject page…

- Microeconomics
- Consumer Behavior
- Calculating Marginal Rate of Substitution
Micro-course: Consumer Behavior
9,930 views
Learn key concepts and earn your certificate.










Calculating Marginal Rate of Substitution

00:00
01:21
Video Summary: Calculating Marginal Rate of Substitution Explained
Ever wonder why you'd trade two slices of pizza for one burger but wouldn't trade three? The concept of calculating marginal rate of substitution reveals how consumers make these trade-off decisions while maintaining equal satisfaction levels. Consider how a student might exchange study hours between math and English to achieve the same overall academic performance-this demonstrates calculating marginal rate of substitution explained in action. Watch the full video on JoVE Coach to master this concept with expert-led visuals and step-by-step explanations.
- Understand the fundamental concept of calculating marginal rate of substitution and its role in consumer choice theory
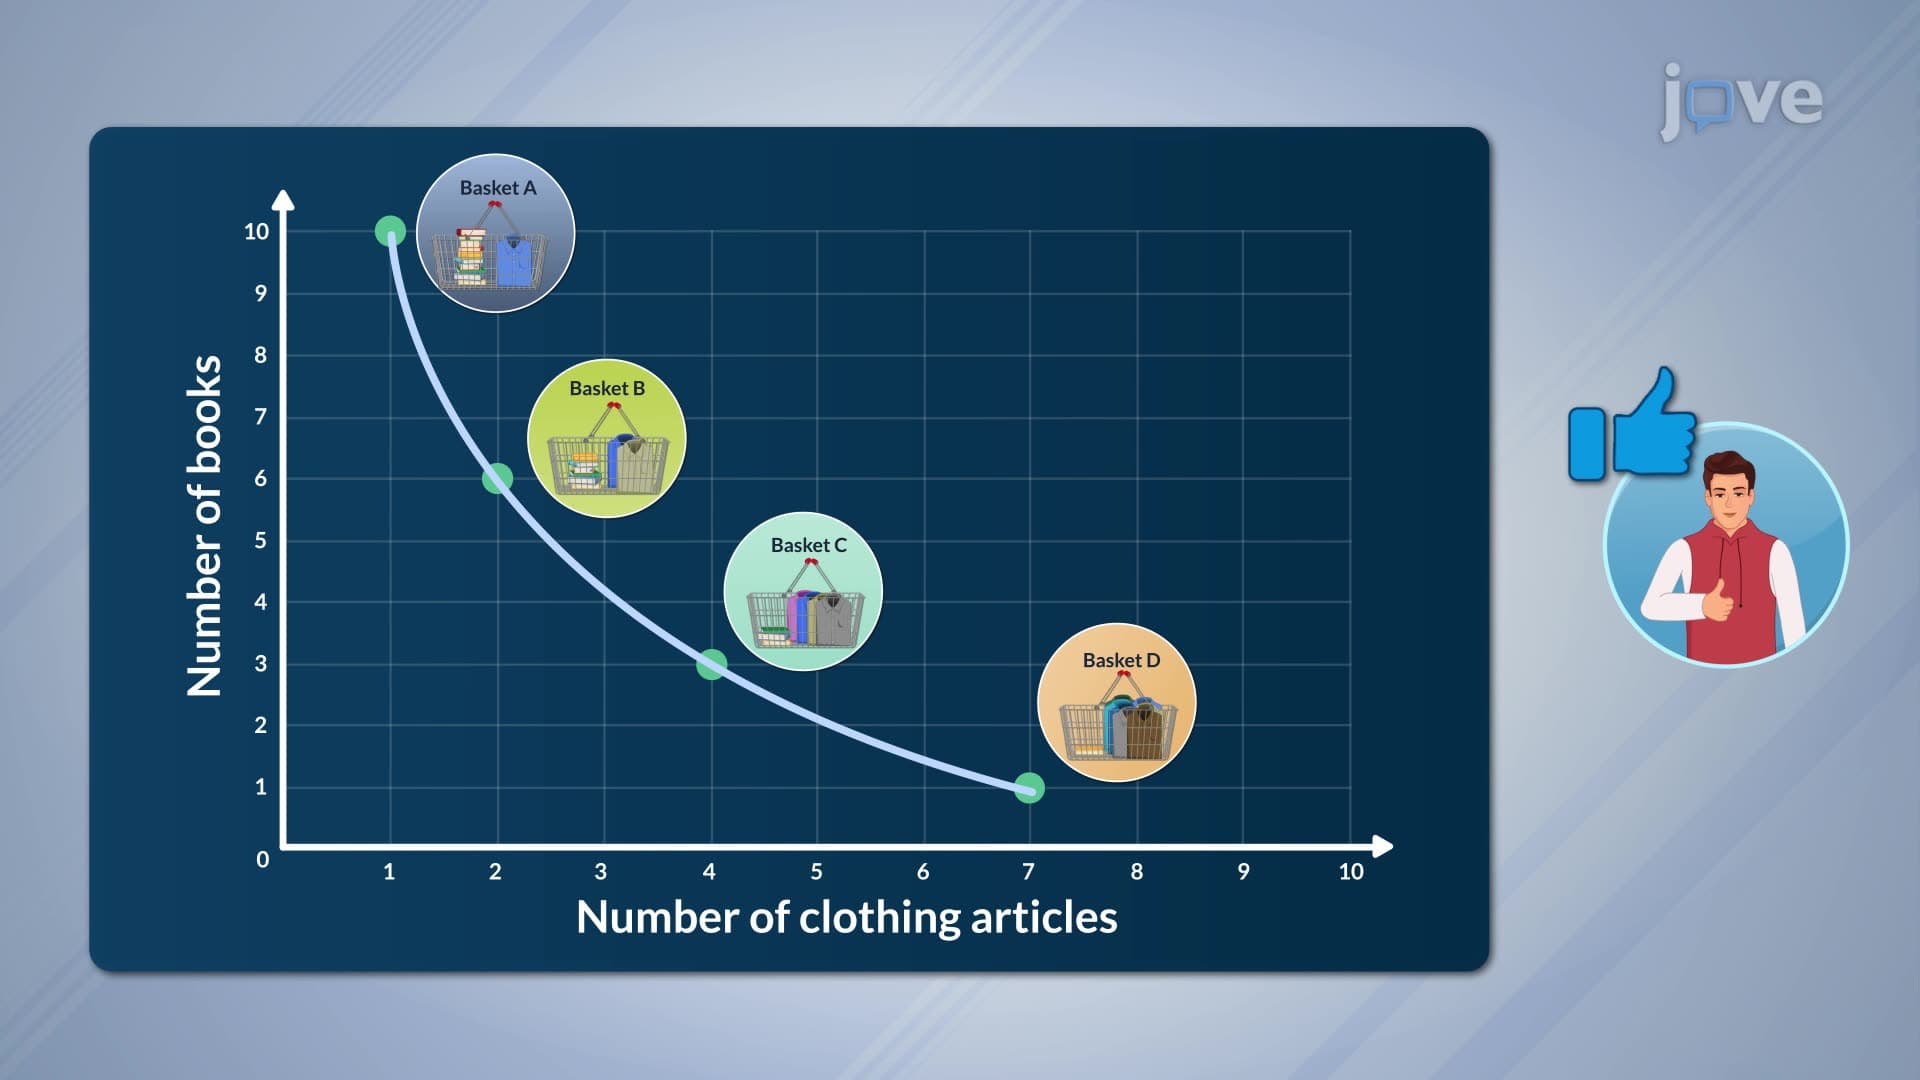
- Identify the mathematical relationship between goods on an indifference curve using MRS calculations
- Analyze real-world trade-off scenarios by applying the MRS formula: change in quantity Y divided by change in quantity X
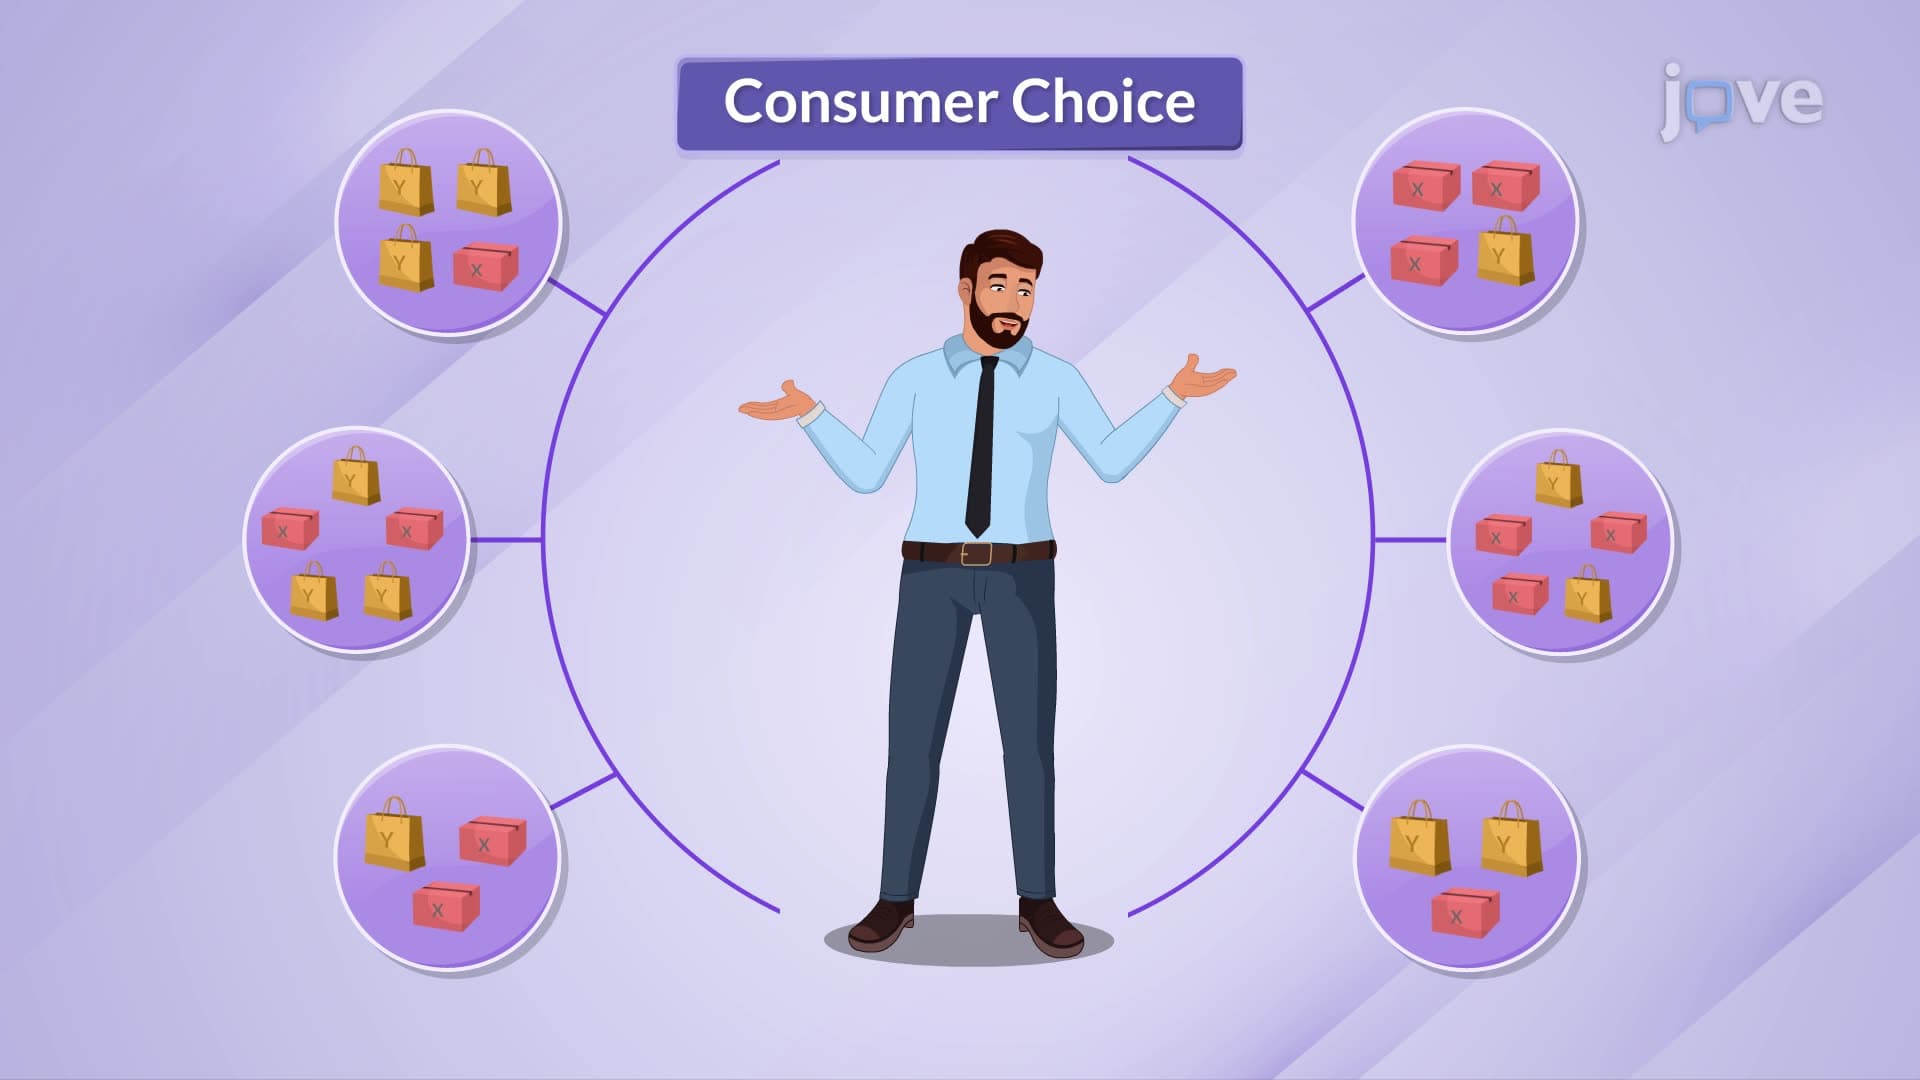
- Compare different consumption bundles to determine equivalent satisfaction levels through MRS analysis
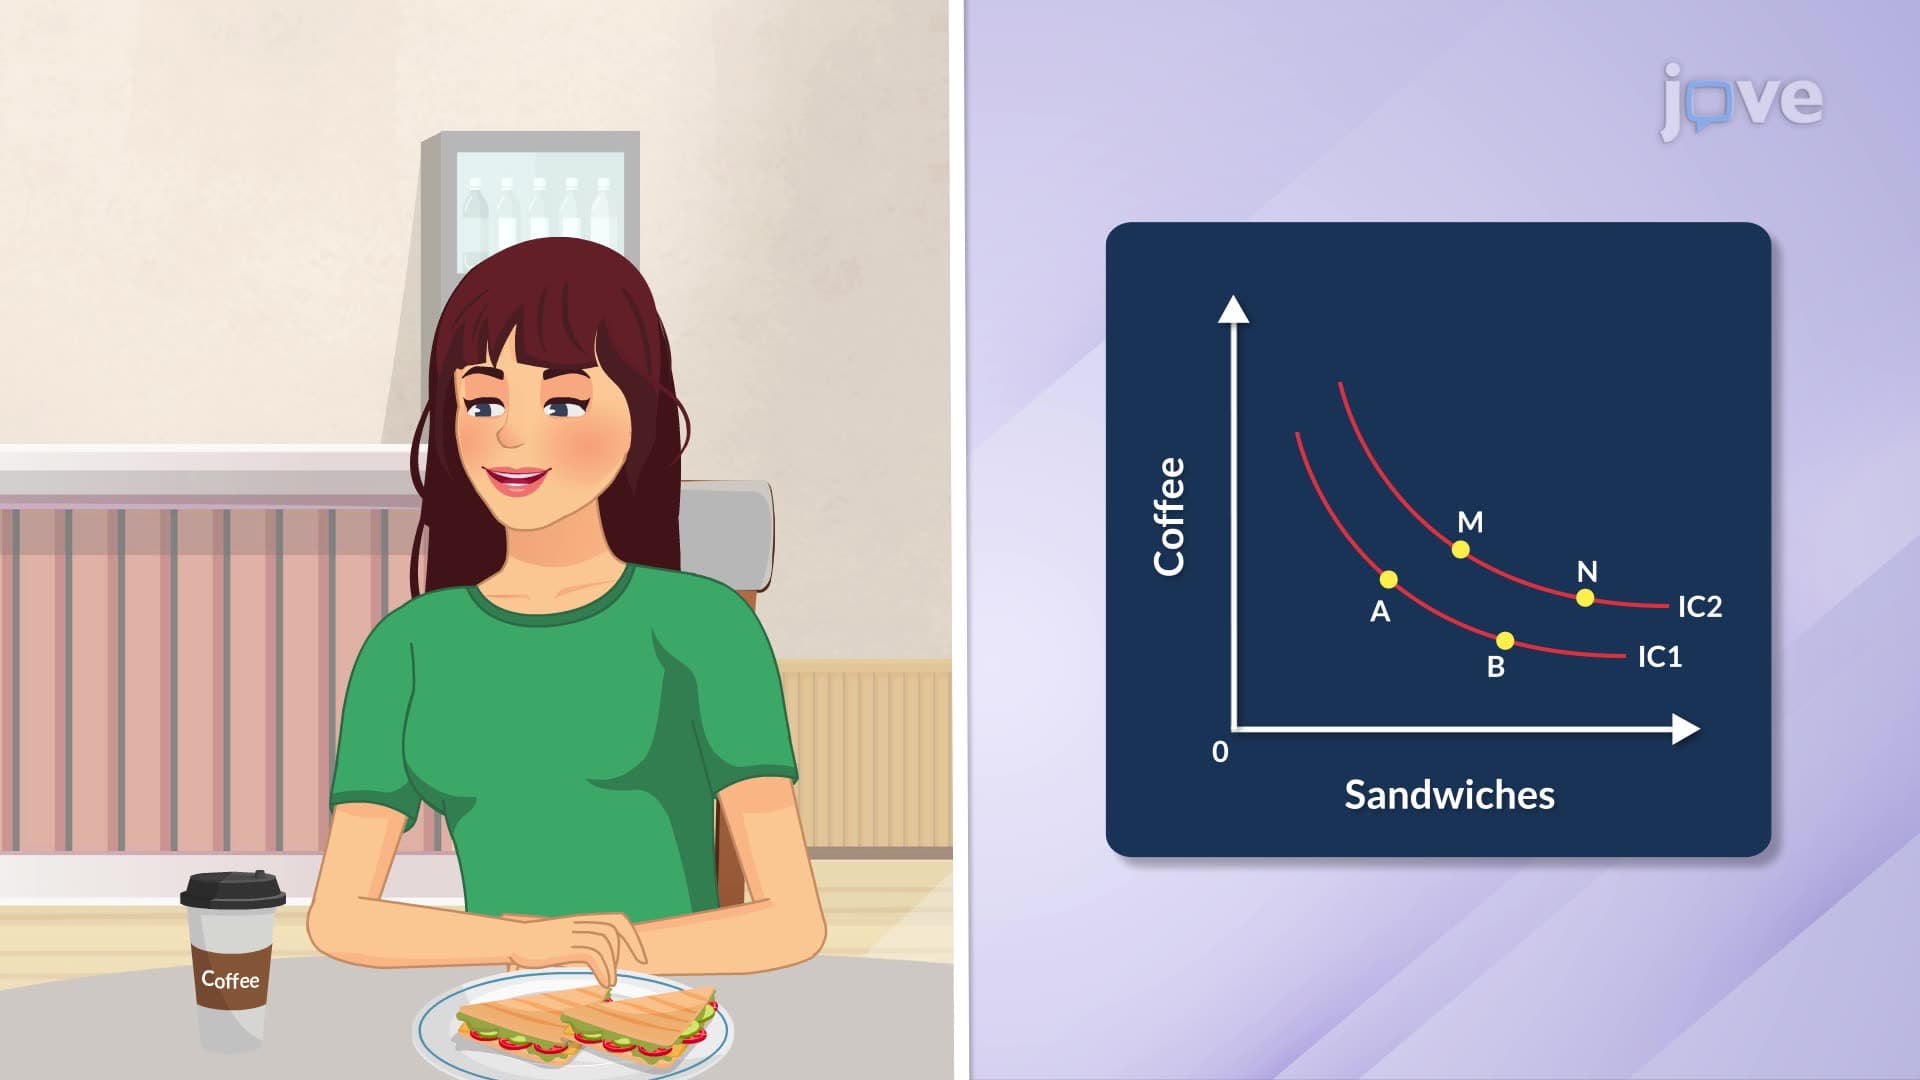
- Evaluate consumer preferences by interpreting the slope of indifference curves as marginal rates of substitution
- Apply MRS calculations to solve economics problems involving utility maximization and budget constraints
- Recognize how diminishing marginal rate of substitution reflects realistic consumer behavior patterns
- Explore the connection between MRS and market demand curves in microeconomic analysis
Understanding Calculating Marginal Rate of Substitution
The marginal rate of substitution (MRS) represents a fundamental concept in microeconomics that measures how much of one good a consumer willingly sacrifices to obtain one additional unit of another good while maintaining constant utility. This calculation reveals the trade-offs consumers naturally make when faced with limited resources and multiple desirable options.
Mathematical Foundation and Formula Application
Calculating marginal rate of substitution follows a straightforward formula: MRS = Change in Good Y / Change in Good X. This ratio represents the slope of an indifference curve at any given point. For example, if a college student reduces coffee consumption by 4 cups weekly to afford 2 additional movie tickets while maintaining the same satisfaction level, their MRS of movies for coffee equals 4/2 = 2. This means they're willing to give up 2 cups of coffee for each additional movie.
Real-World Applications in Consumer Decision Making
Consider how American consumers make daily choices: a working professional might trade home-cooked meals for restaurant dining to save time, or a student might substitute expensive textbooks with library books to afford entertainment. These scenarios demonstrate MRS calculations in practice. On standardized tests like the AP Economics exam, students frequently encounter problems requiring MRS calculations to analyze consumer optimization and market equilibrium conditions.
Diminishing Marginal Rate of Substitution Principle
A crucial characteristic of MRS is its tendency to diminish as consumers move along an indifference curve. Initially, someone might readily trade many units of one good for another, but as they acquire more of the substitute good, they become less willing to make additional trades. This reflects the law of diminishing marginal utility and explains why indifference curves typically display convex shapes. Understanding this principle helps students excel in college microeconomics courses and prepares them for advanced economic analysis in business and policy contexts.
Frequently Asked Questions
Calculating marginal rate of substitution measures how many units of one good you're willing to give up to get one more unit of another good while staying equally satisfied. It's like figuring out your personal trade-off rate between two things you want. This calculation helps economists understand consumer choices and predict market behavior.
AP Economics exams frequently test MRS through indifference curve problems and utility maximization questions. Students typically calculate MRS values, interpret their economic meaning, and use them to find optimal consumption bundles. Practice with graphical analysis and formula applications is essential for exam success.
MRS specifically measures trade-offs along an indifference curve where satisfaction remains constant, while opportunity cost represents the value of the next best alternative foregone in any decision. MRS focuses on maintaining equal utility, whereas opportunity cost applies to all economic choices regardless of satisfaction levels.
Companies like Netflix analyze how customers trade between different entertainment options to optimize content offerings and pricing strategies. Restaurant chains use MRS concepts to design menu combinations that maximize customer satisfaction. Understanding consumer substitution patterns helps businesses predict demand shifts and competitive responses.
Most students find MRS calculations manageable with basic algebra skills and economic intuition. The concept builds naturally on familiar trade-off thinking, and the mathematical formula involves simple division. Regular practice with real-world examples makes the calculations feel more intuitive and applicable.
Create personal examples using goods you actually consume, practice graphing indifference curves repeatedly, and solve varied problem sets from AP prep books. Focus on understanding the economic logic behind calculations rather than memorizing formulas. Connect MRS to budget constraints and utility maximization for comprehensive understanding.
Progress to consumer optimization using budget constraints, income and substitution effects, and elasticity of substitution. These advanced topics build directly on MRS foundations and prepare students for intermediate microeconomics and behavioral economics courses in college.
Related Micro-courses