Loading subject page…

- Microeconomics
- Consumer Behavior
- Features of Indifference Curves II
Micro-course: Consumer Behavior
9,930 views
Learn key concepts and earn your certificate.









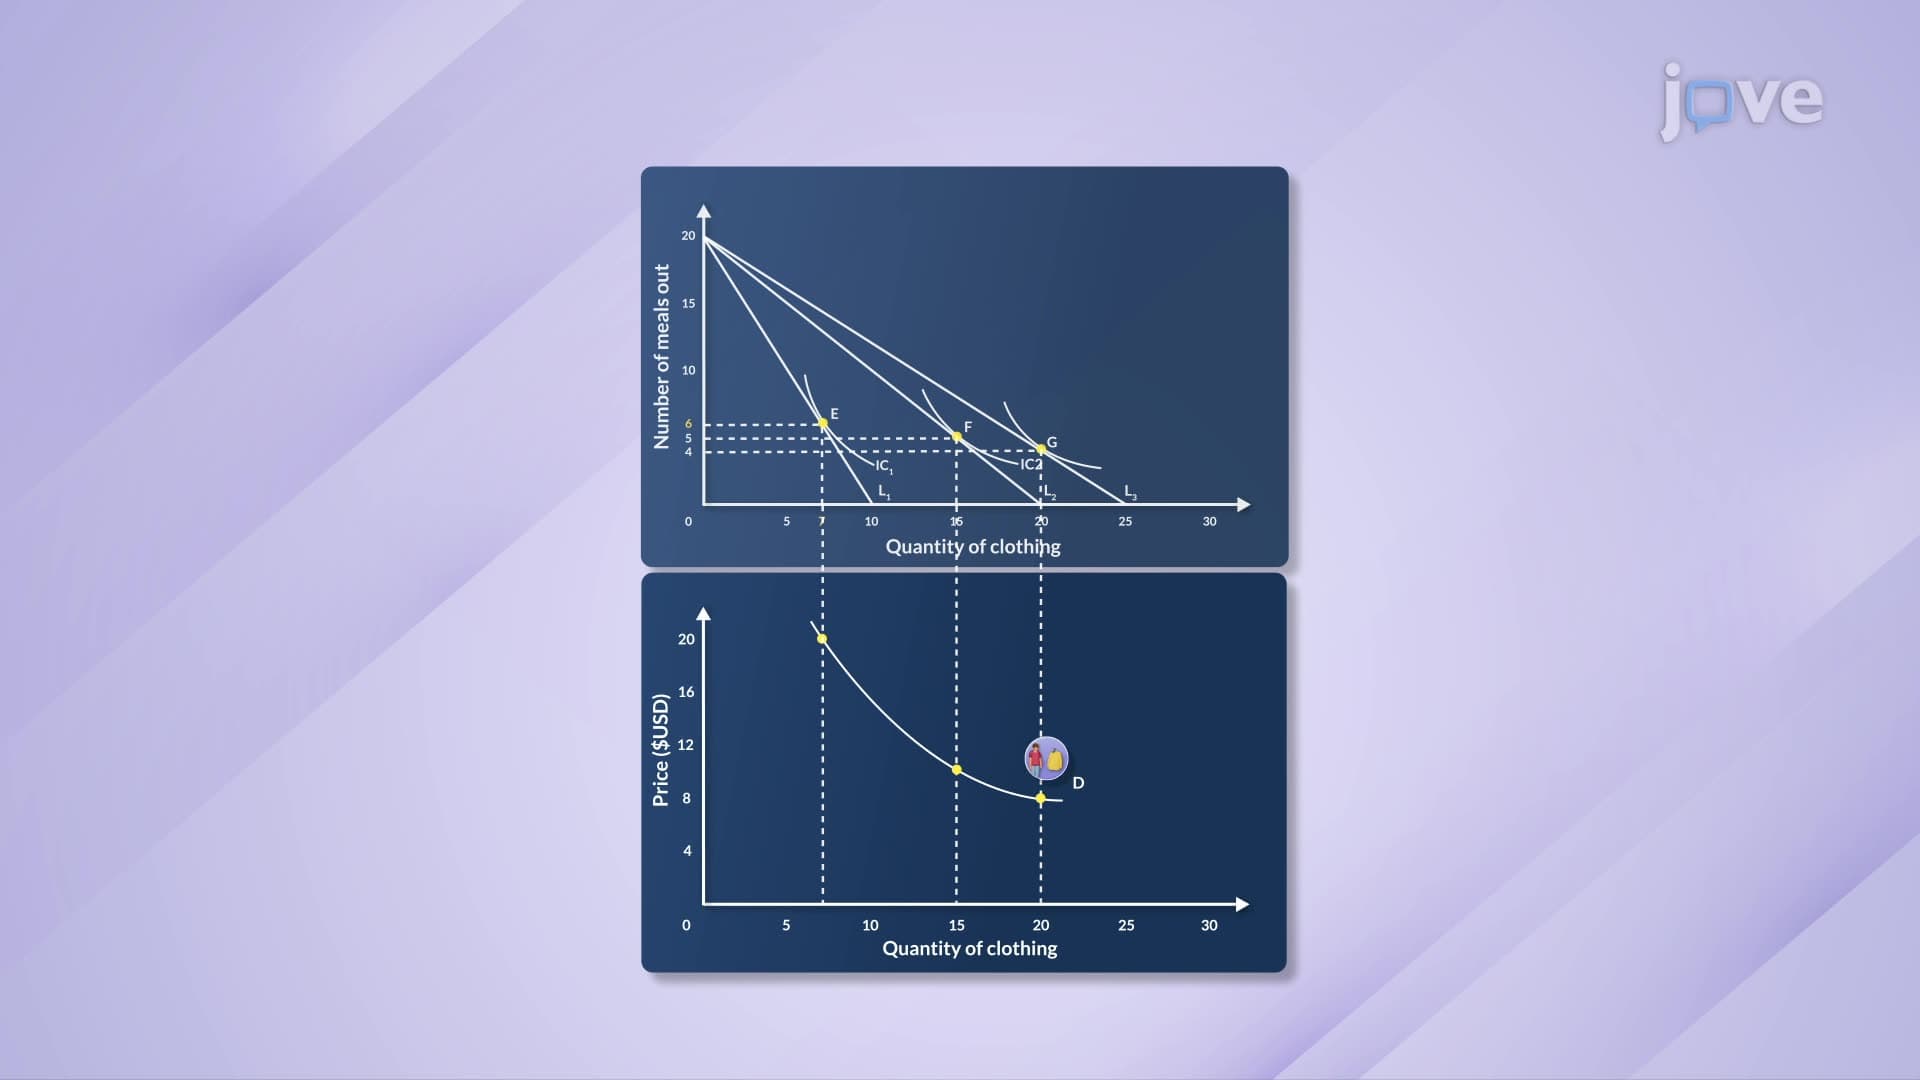
Features of Indifference Curves II


00:00
01:19
Video Summary: Features of Indifference Curves Ii Explained
Ever wonder why Netflix never gives you identical movie recommendations? The features of indifference curves reveal how consumers make choices between different combinations of goods while maintaining equal satisfaction levels. Consider choosing between streaming services and movie theater visits, economists use indifference curve analysis to predict these trade-offs. The Features of Indifference Curves II Explained demonstrates why these curves cannot intersect and must be convex, based on fundamental economic principles like monotonic preferences and diminishing marginal rates of substitution. Watch the full video on JoVE Coach to master this concept with expert-led visuals and step-by-step explanations.
- Understand why Features of Indifference Curves II Explained demonstrates the impossibility of curve intersection through logical contradiction
- Identify the relationship between monotonic preferences and consumer choice theory in microeconomic analysis
- Analyze how the principle of "more is better" prevents indifference curves from crossing at any point
- Compare satisfaction levels across different consumption bundles using indifference curve properties
- Evaluate the convex shape of indifference curves through diminishing marginal rate of substitution
- Apply the concept of marginal rate of substitution to real-world consumer decision-making scenarios
- Recognize the mathematical foundation behind consumer preference theory in introductory economics
- Explore how these curve features connect to broader microeconomic principles and market behavior
Understanding the Core Features of Indifference Curves II Explained
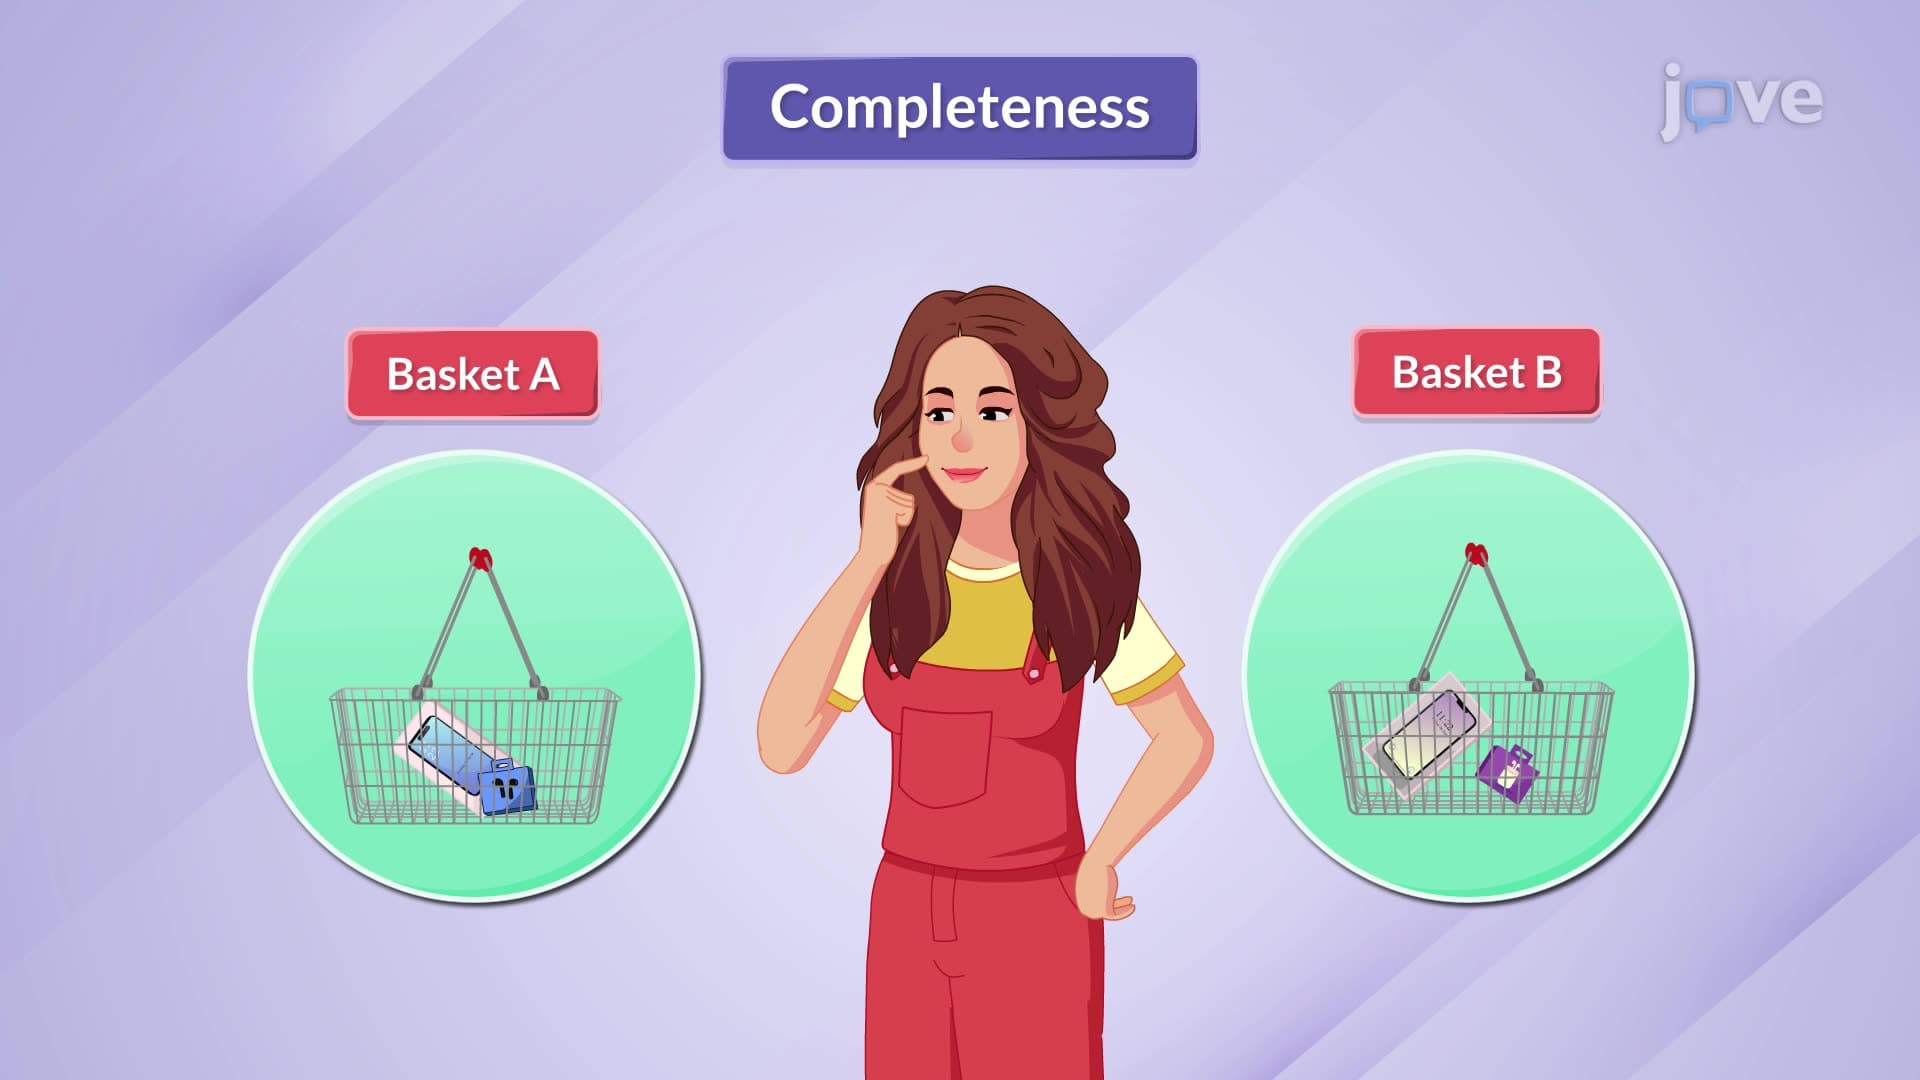
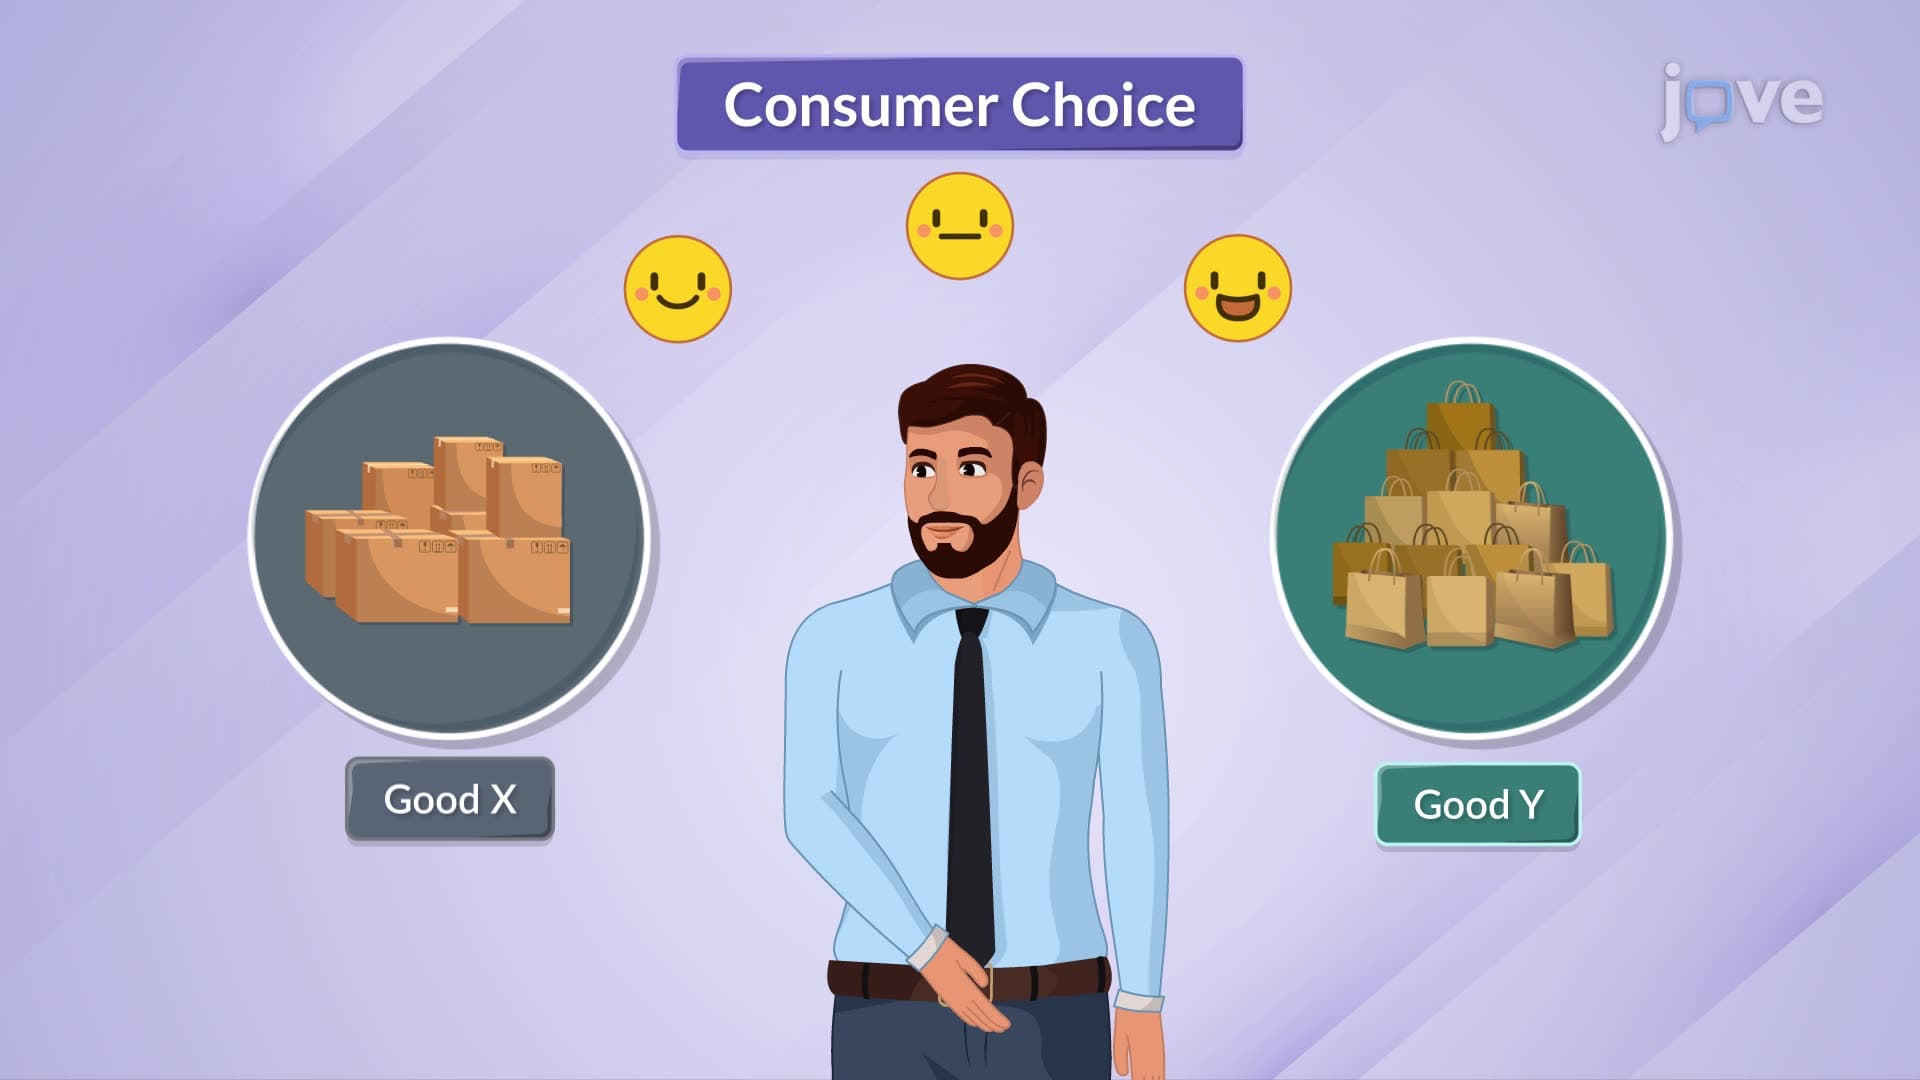
The features of indifference curves form the mathematical backbone of consumer choice theory, a cornerstone concept in AP Economics and introductory college microeconomics courses. These curves represent all possible combinations of two goods that provide a consumer with identical levels of satisfaction or utility. Understanding why these curves behave in specific ways, particularly why they cannot intersect and why they're convex, is crucial for success in economics coursework and standardized exams.
Why Indifference Curves Cannot Intersect: The Logical Contradiction
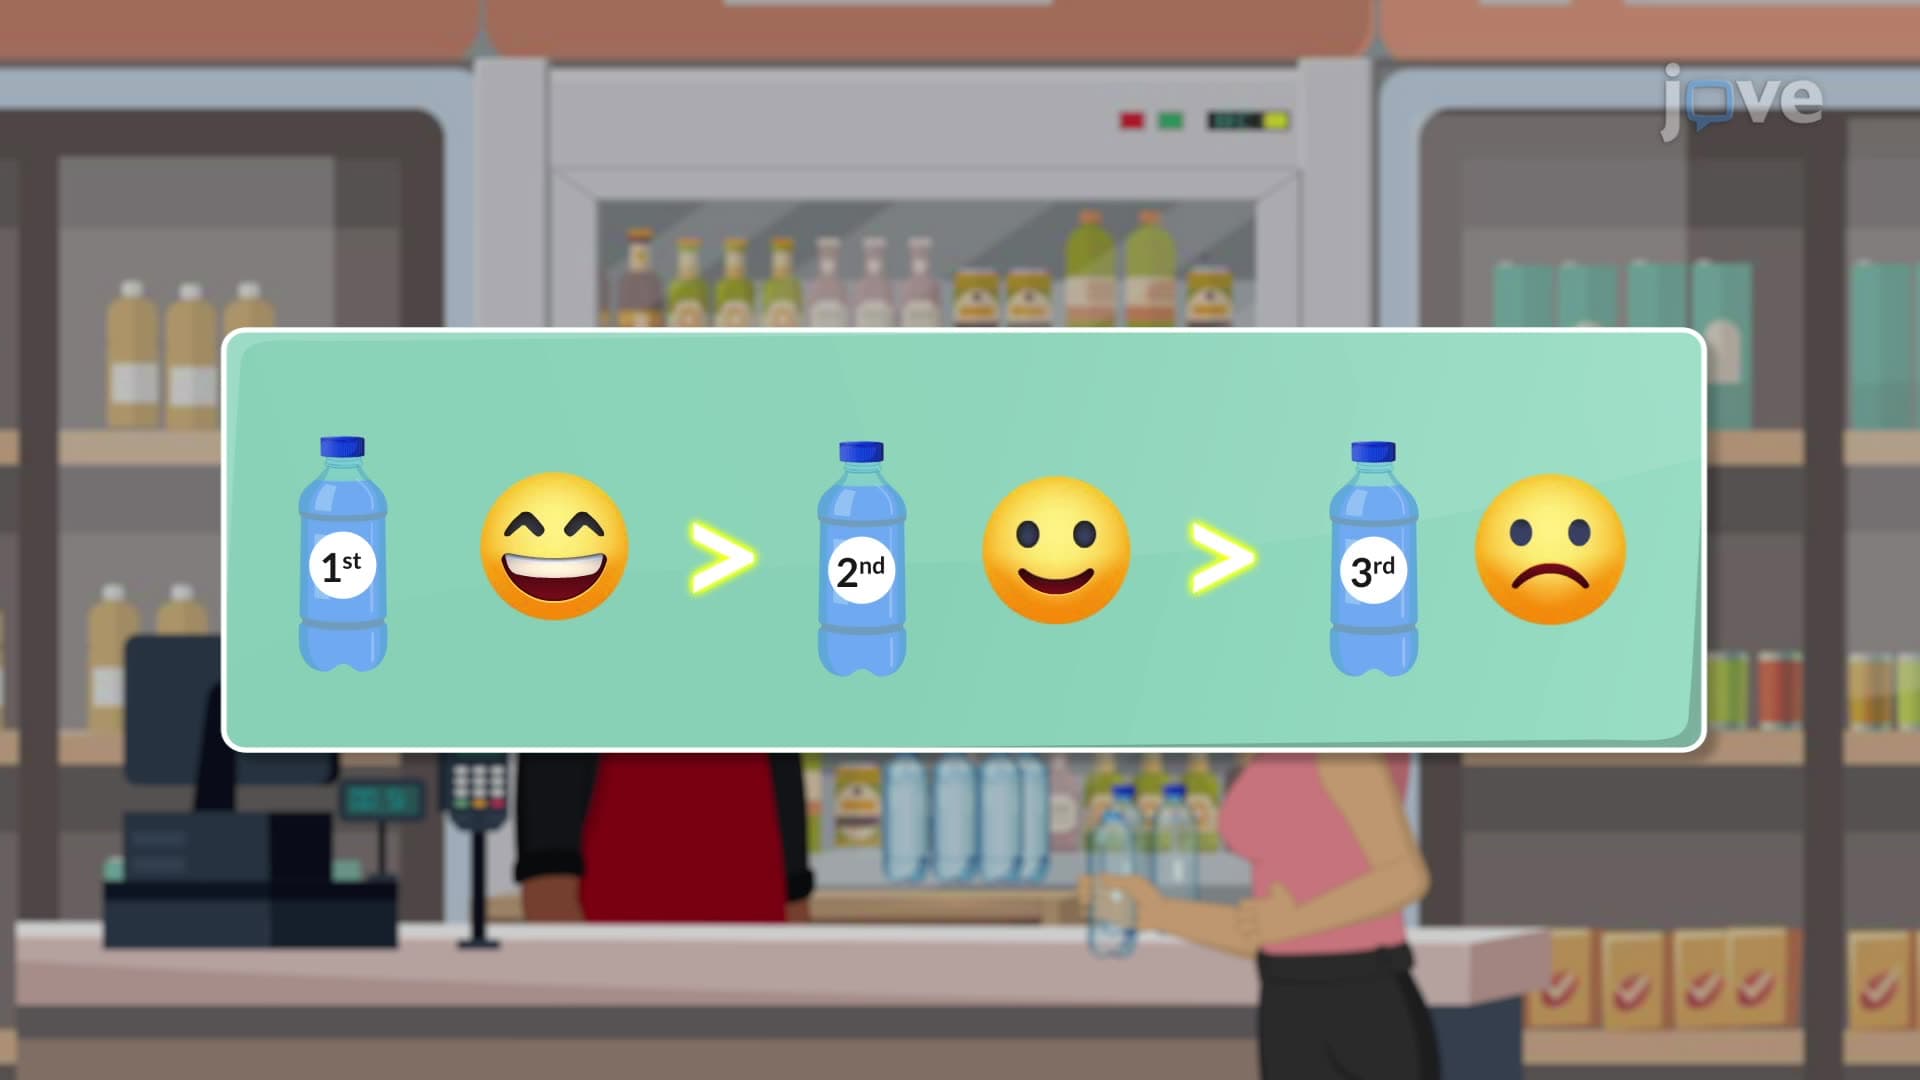
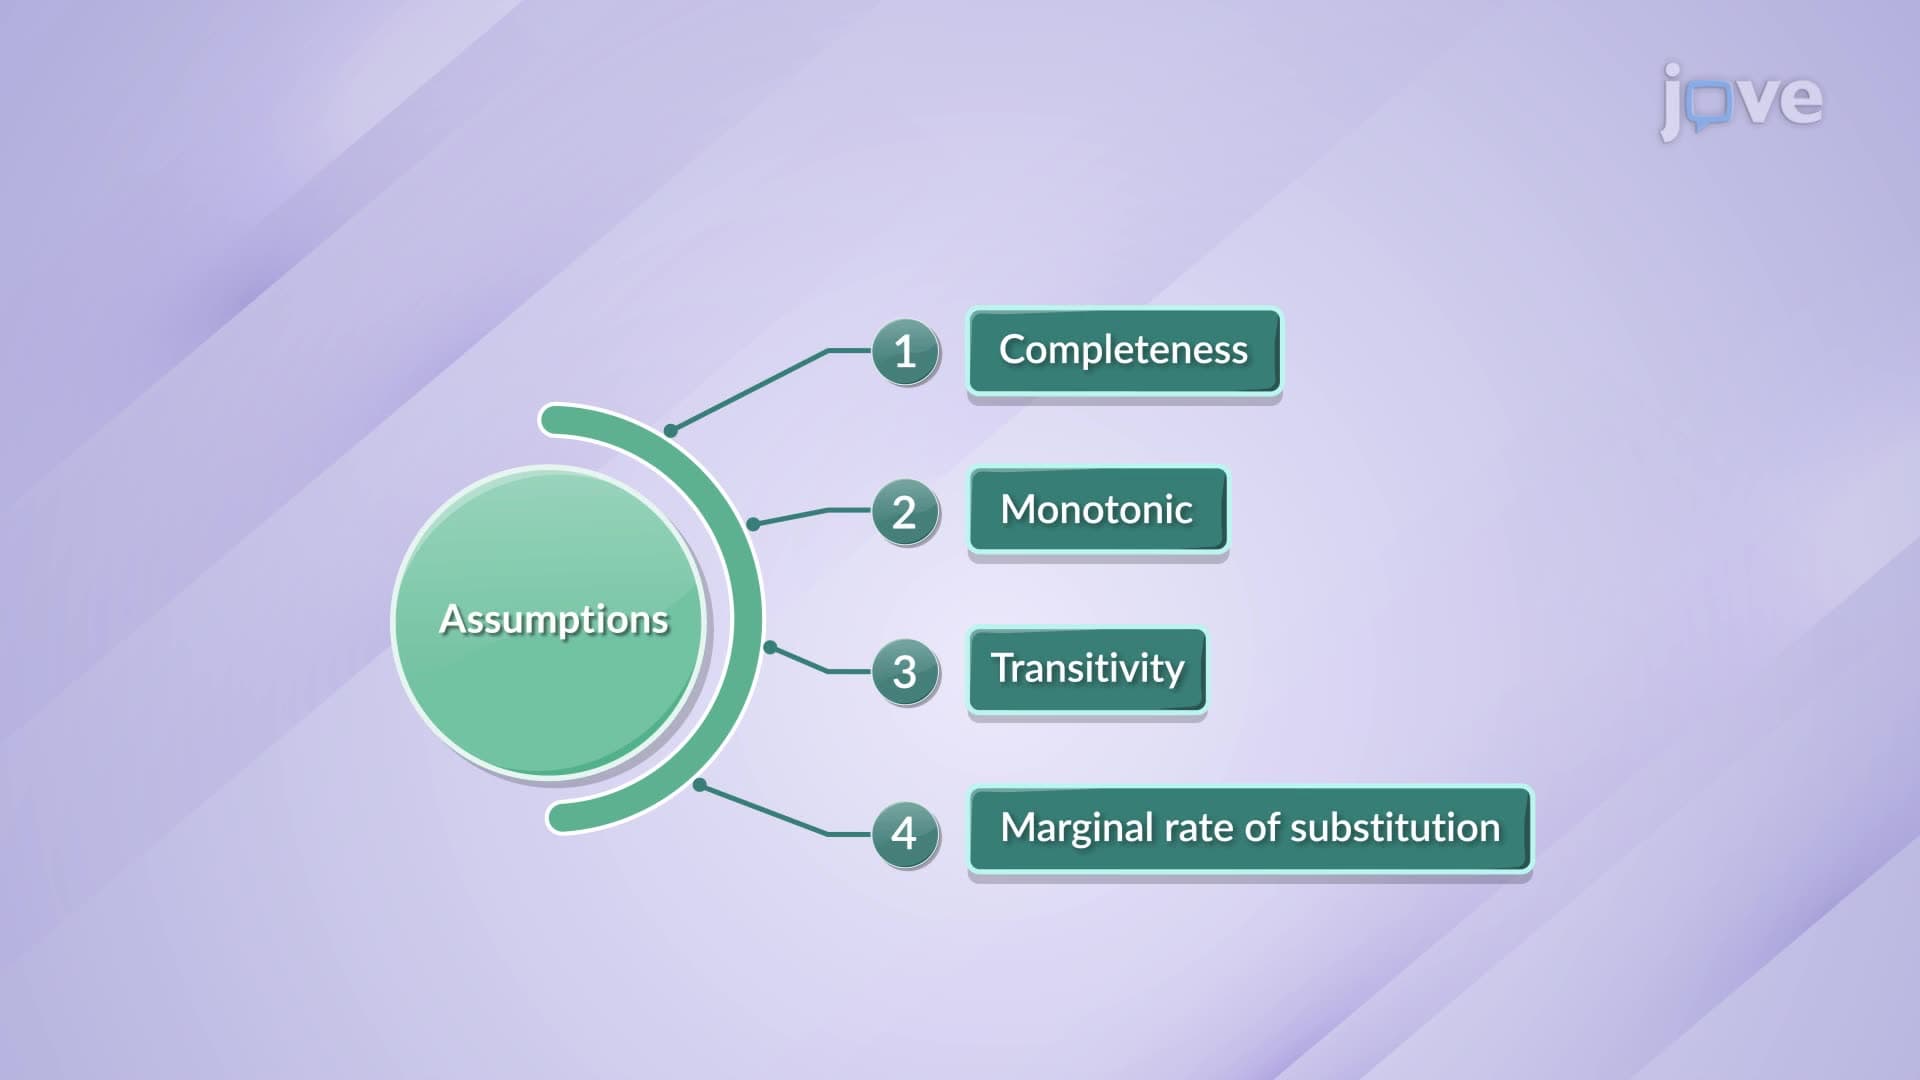
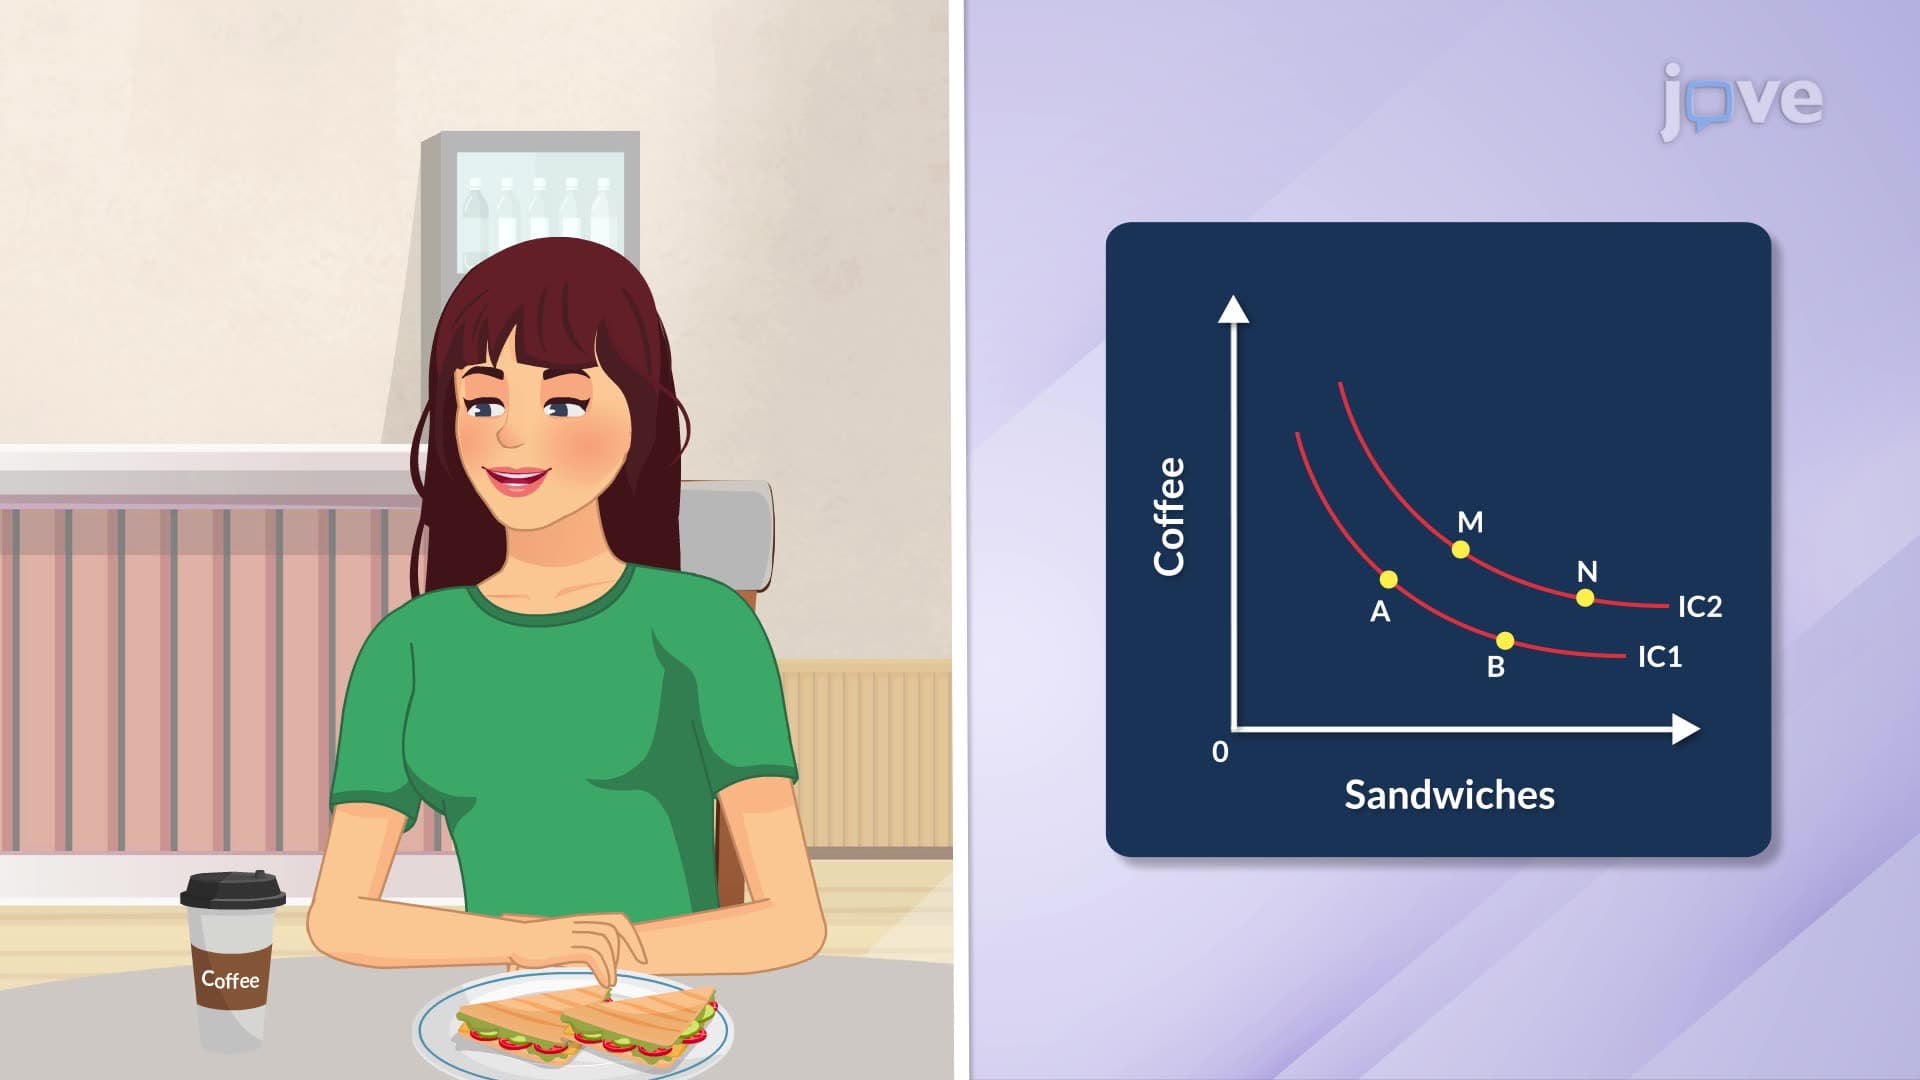
The most fundamental feature preventing indifference curve intersection lies in the principle of monotonic preferences, which assumes rational consumers always prefer more goods to fewer goods. When we examine the mathematical proof by contradiction, we see why intersection creates logical impossibility. If two curves intersected, we could identify three consumption bundles: two on separate curves and one at the intersection point. This scenario would suggest a consumer is simultaneously indifferent between bundles where one clearly contains more of both goods, violating basic rationality assumptions that underpin economic theory.
This concept frequently appears on AP Microeconomics exams, where students must explain why indifference curves cannot cross. College-level microeconomics courses expand this analysis to include mathematical proofs using utility functions. Understanding this principle helps students tackle complex problems involving consumer surplus, demand curve derivation, and welfare economics.
The Convex Shape and Diminishing Marginal Rate of Substitution
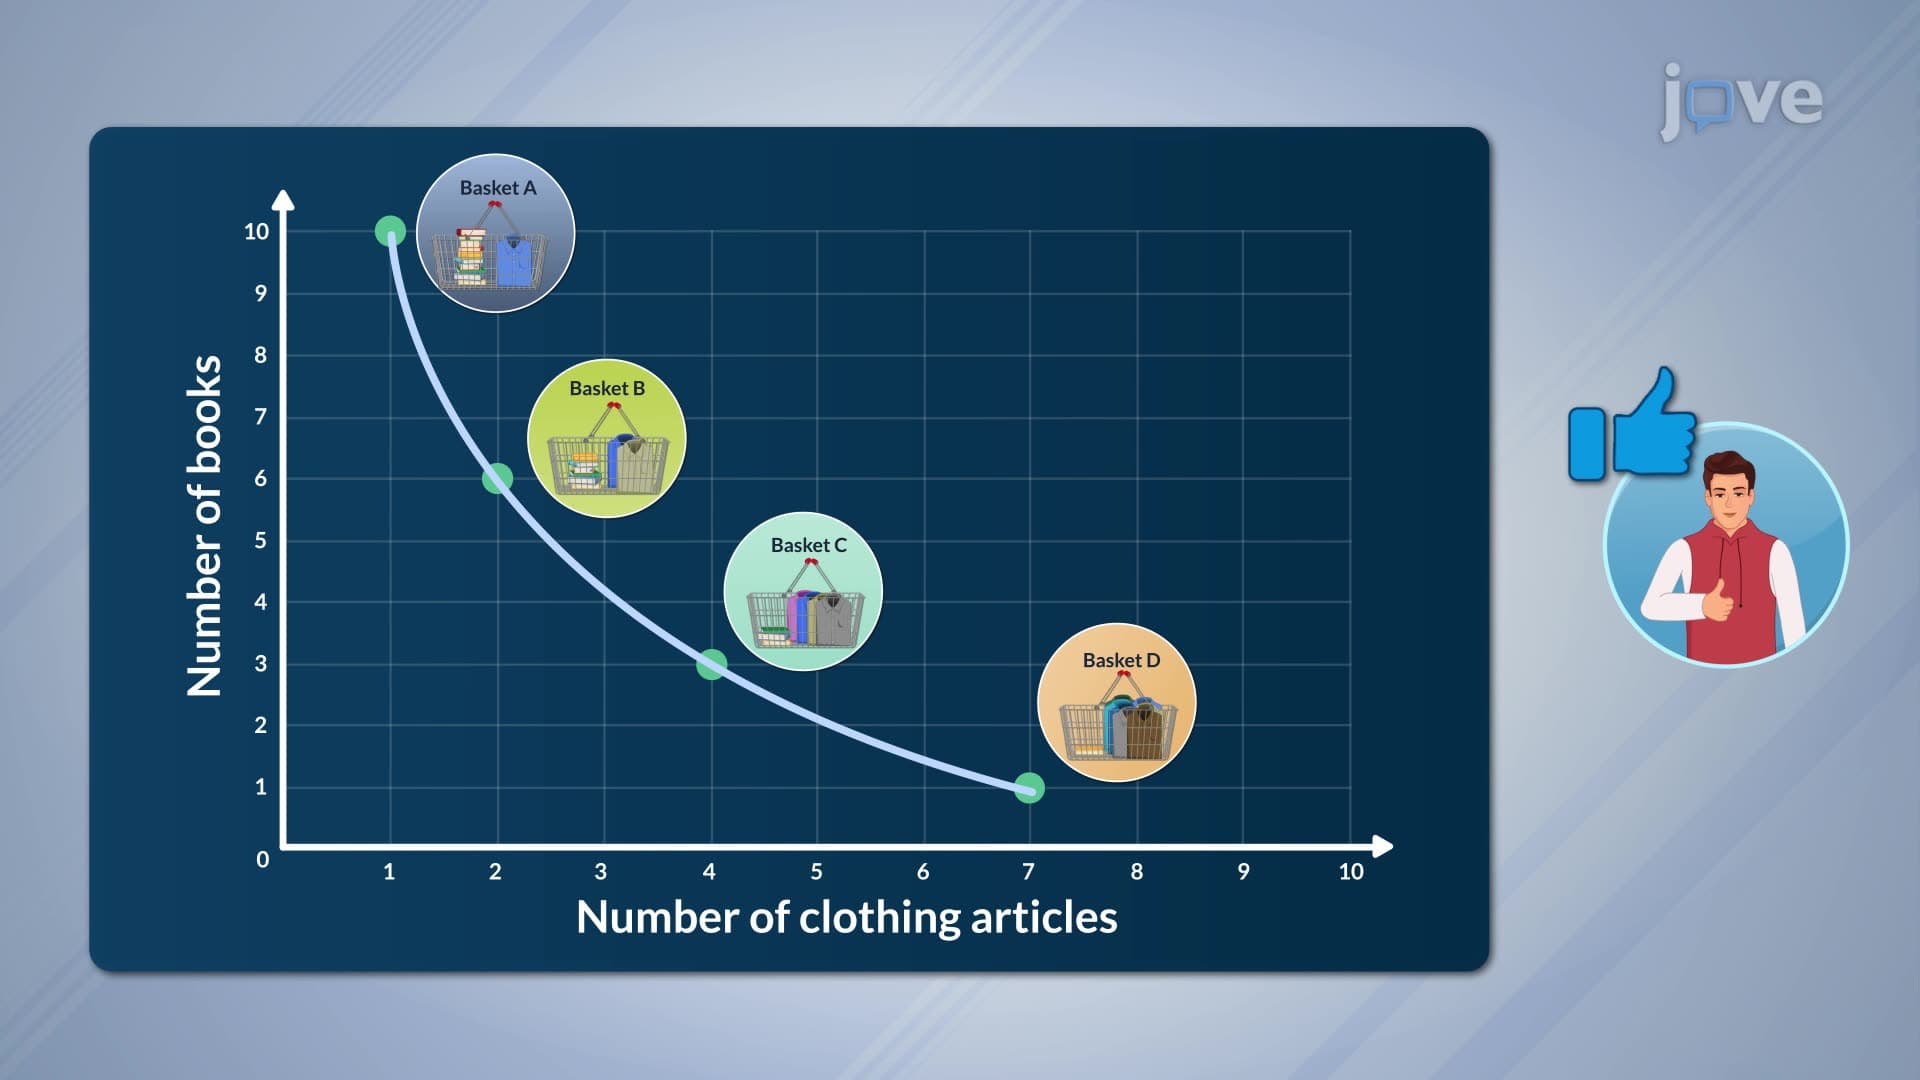
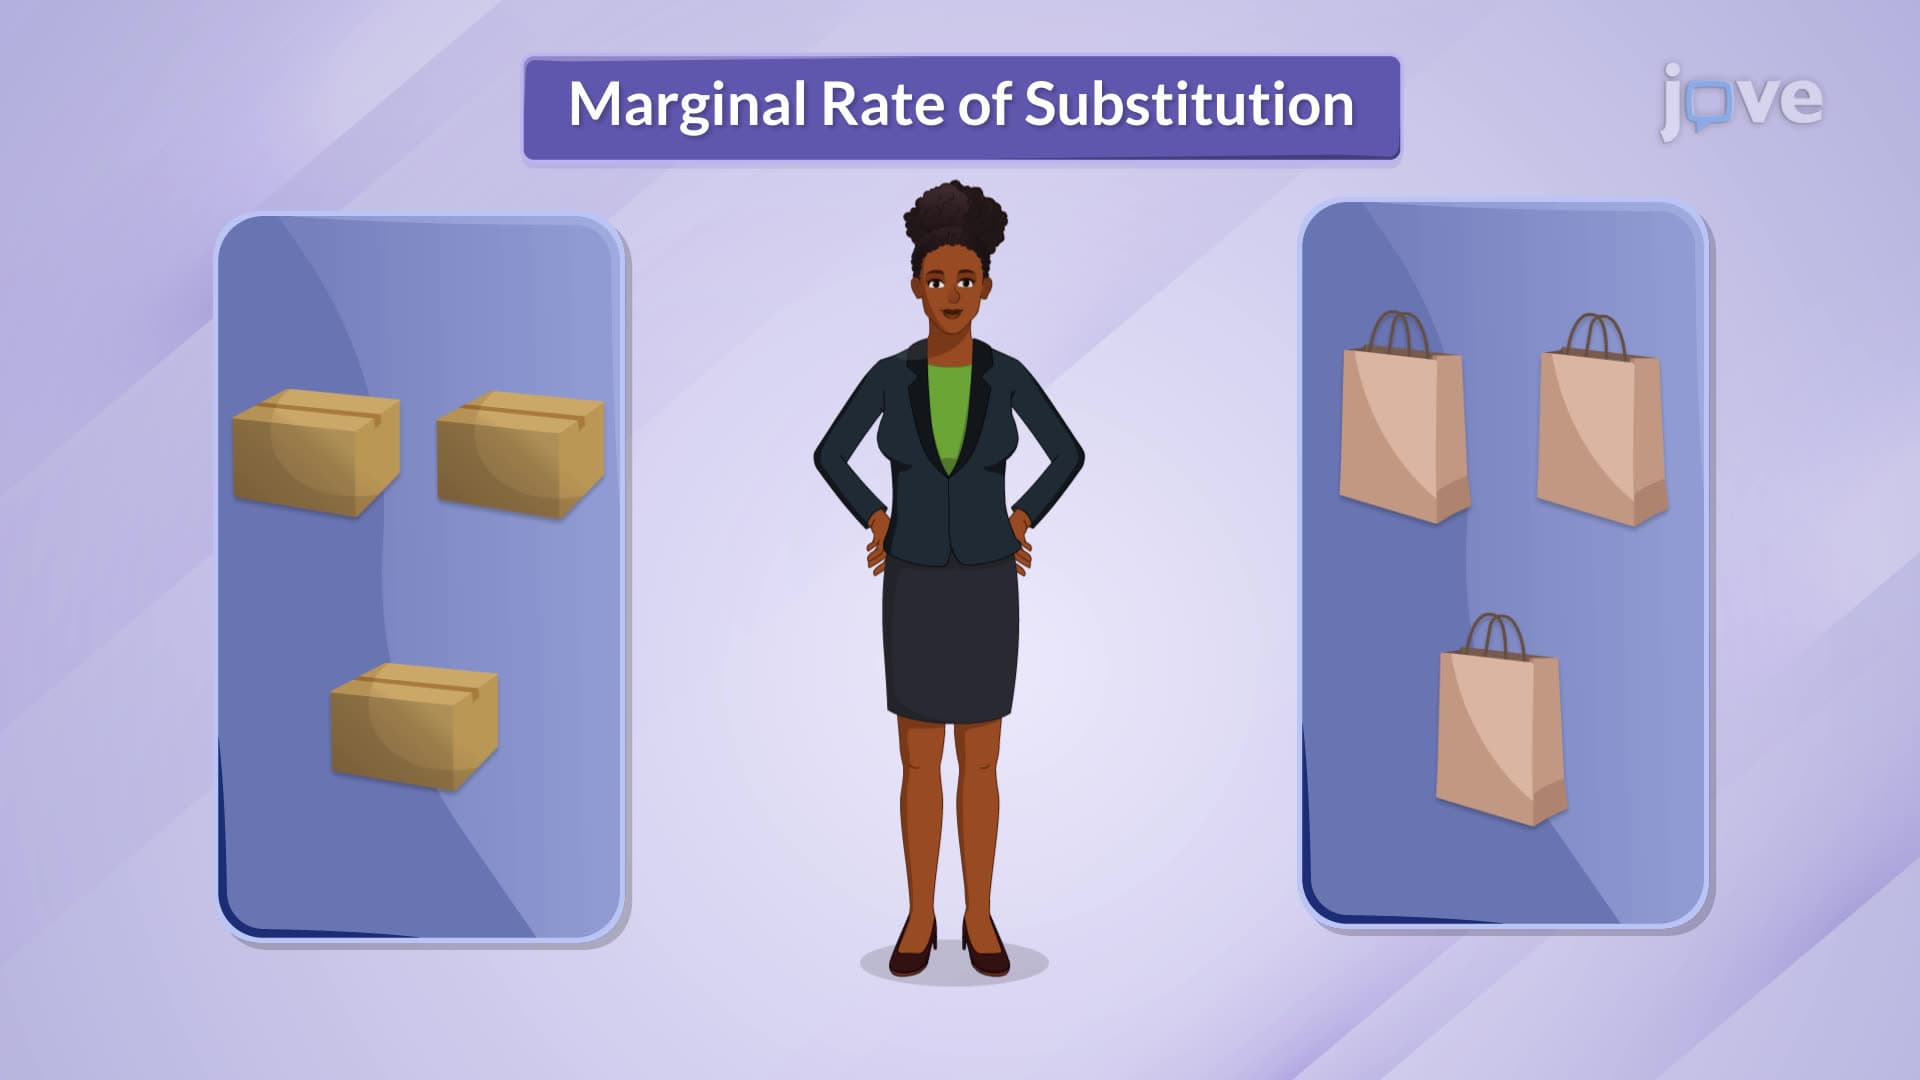
The convex shape of indifference curves reflects the diminishing marginal rate of substitution (MRS), which measures how much of one good a consumer willingly trades for additional units of another good while maintaining constant satisfaction. As consumers have more of good X relative to good Y, they become less willing to trade Y for additional X. This creates the characteristic bowed-in appearance of indifference curves.
Consider a practical example: choosing between hamburgers and pizza slices for weekly meals. Initially, if you have many hamburgers but few pizza slices, you might trade several hamburgers for one pizza slice. However, as your pizza consumption increases and hamburger consumption decreases, you'd require more pizza slices in exchange for giving up additional hamburgers. This real-world behavior explains why indifference curves are convex to the origin.
Applications in Economic Analysis and Exam Preparation
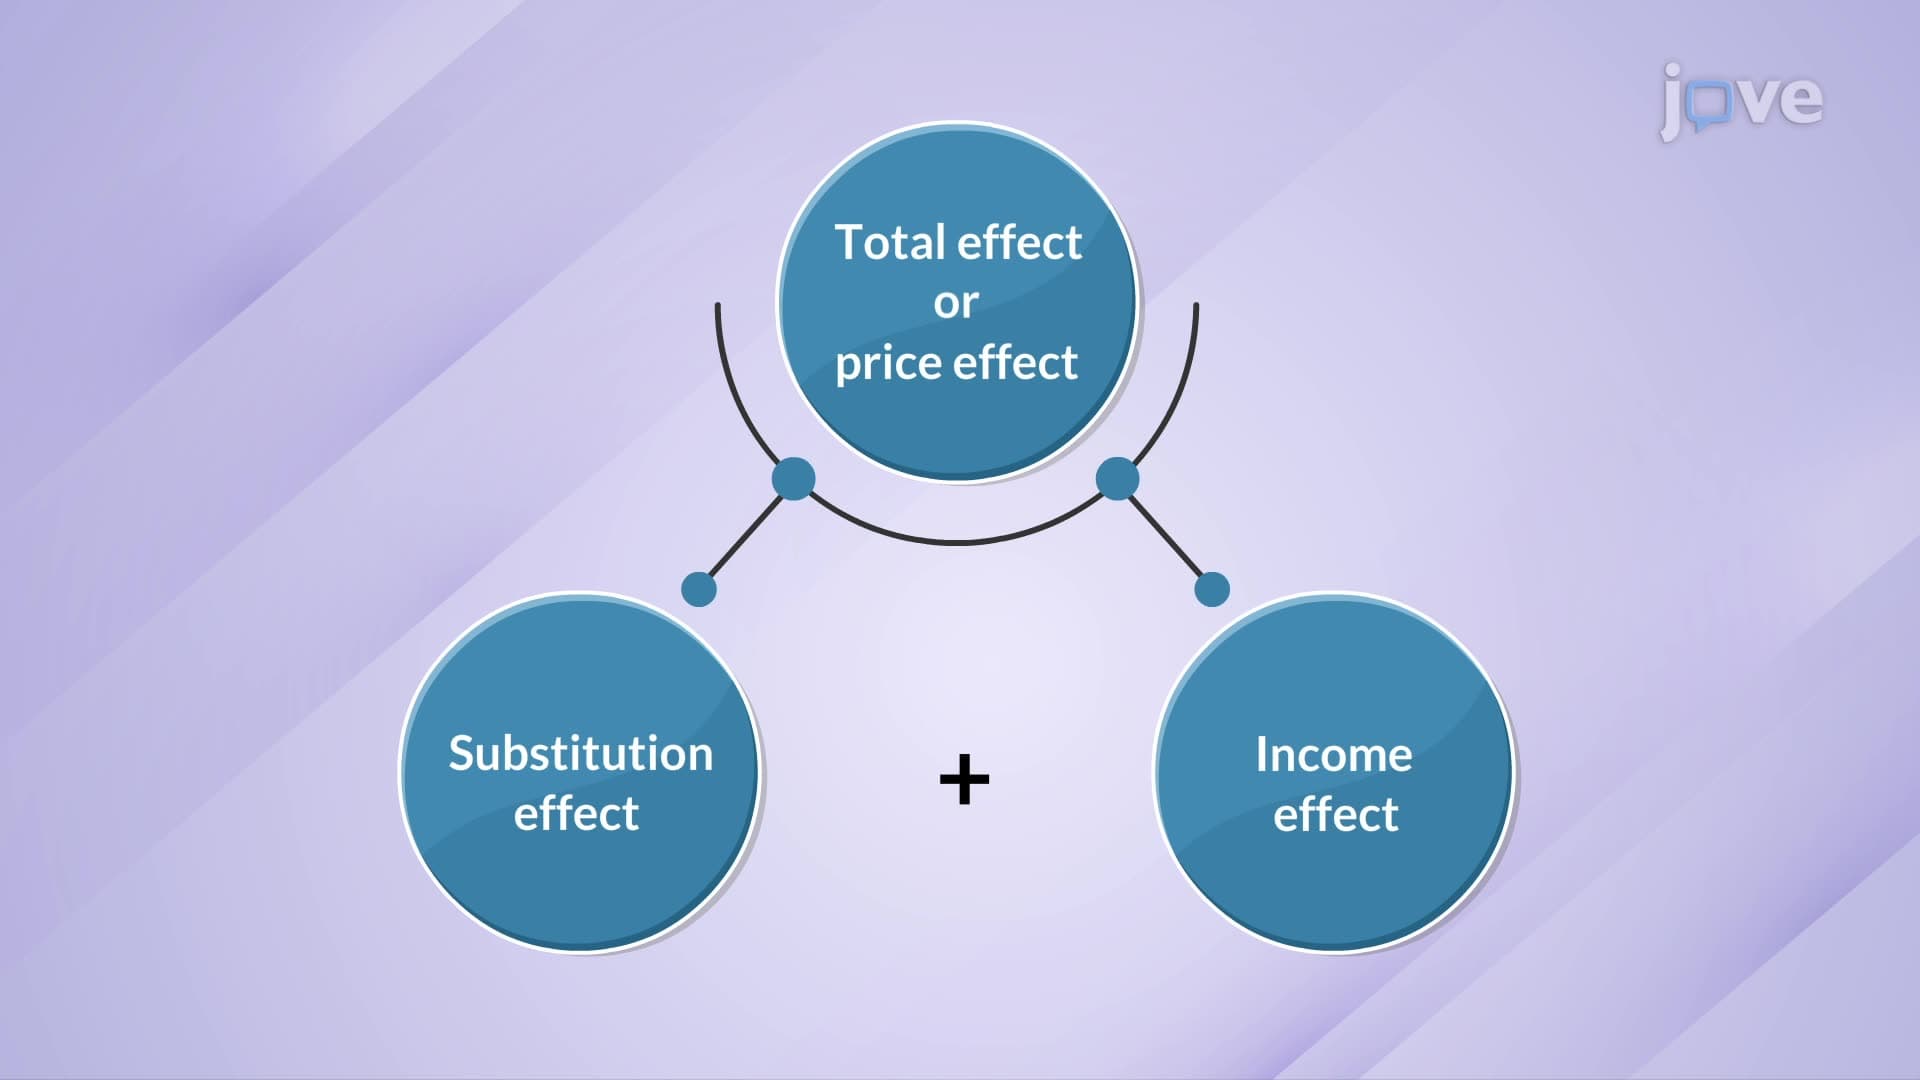
These curve features enable economists to model consumer behavior, derive demand curves, and analyze market outcomes. In standardized testing contexts like the MCAT's behavioral sciences section or college economics midterms, questions often require students to identify curve properties, explain their economic significance, and apply these concepts to policy analysis scenarios. Mastering these fundamentals provides essential groundwork for advanced topics including income and substitution effects, consumer surplus calculations, and market equilibrium analysis.
Frequently Asked Questions
The key features of indifference curves include non-intersection, downward slope, and convexity to the origin. These properties ensure logical consistency in consumer choice theory. Non-intersection prevents contradictory preferences, downward slope reflects trade-offs between goods, and convexity demonstrates diminishing marginal rates of substitution that characterize rational consumer behavior.
AP Microeconomics frequently tests curve properties through graph analysis and explanation questions worth 10-15% of exam points. College midterms often include mathematical derivations of marginal rates of substitution and utility maximization problems. Students must identify curve violations, explain economic reasoning behind properties, and apply concepts to consumer choice scenarios involving budget constraints and optimal consumption bundles.
MCAT Psychology and Sociology sections include decision-making theories that parallel indifference curve analysis. Test-takers encounter questions about rational choice theory, preference consistency, and trade-off evaluation in healthcare scenarios. Understanding how consumers weigh options with diminishing marginal utility helps answer behavioral science questions about medical decision-making and resource allocation in healthcare systems.
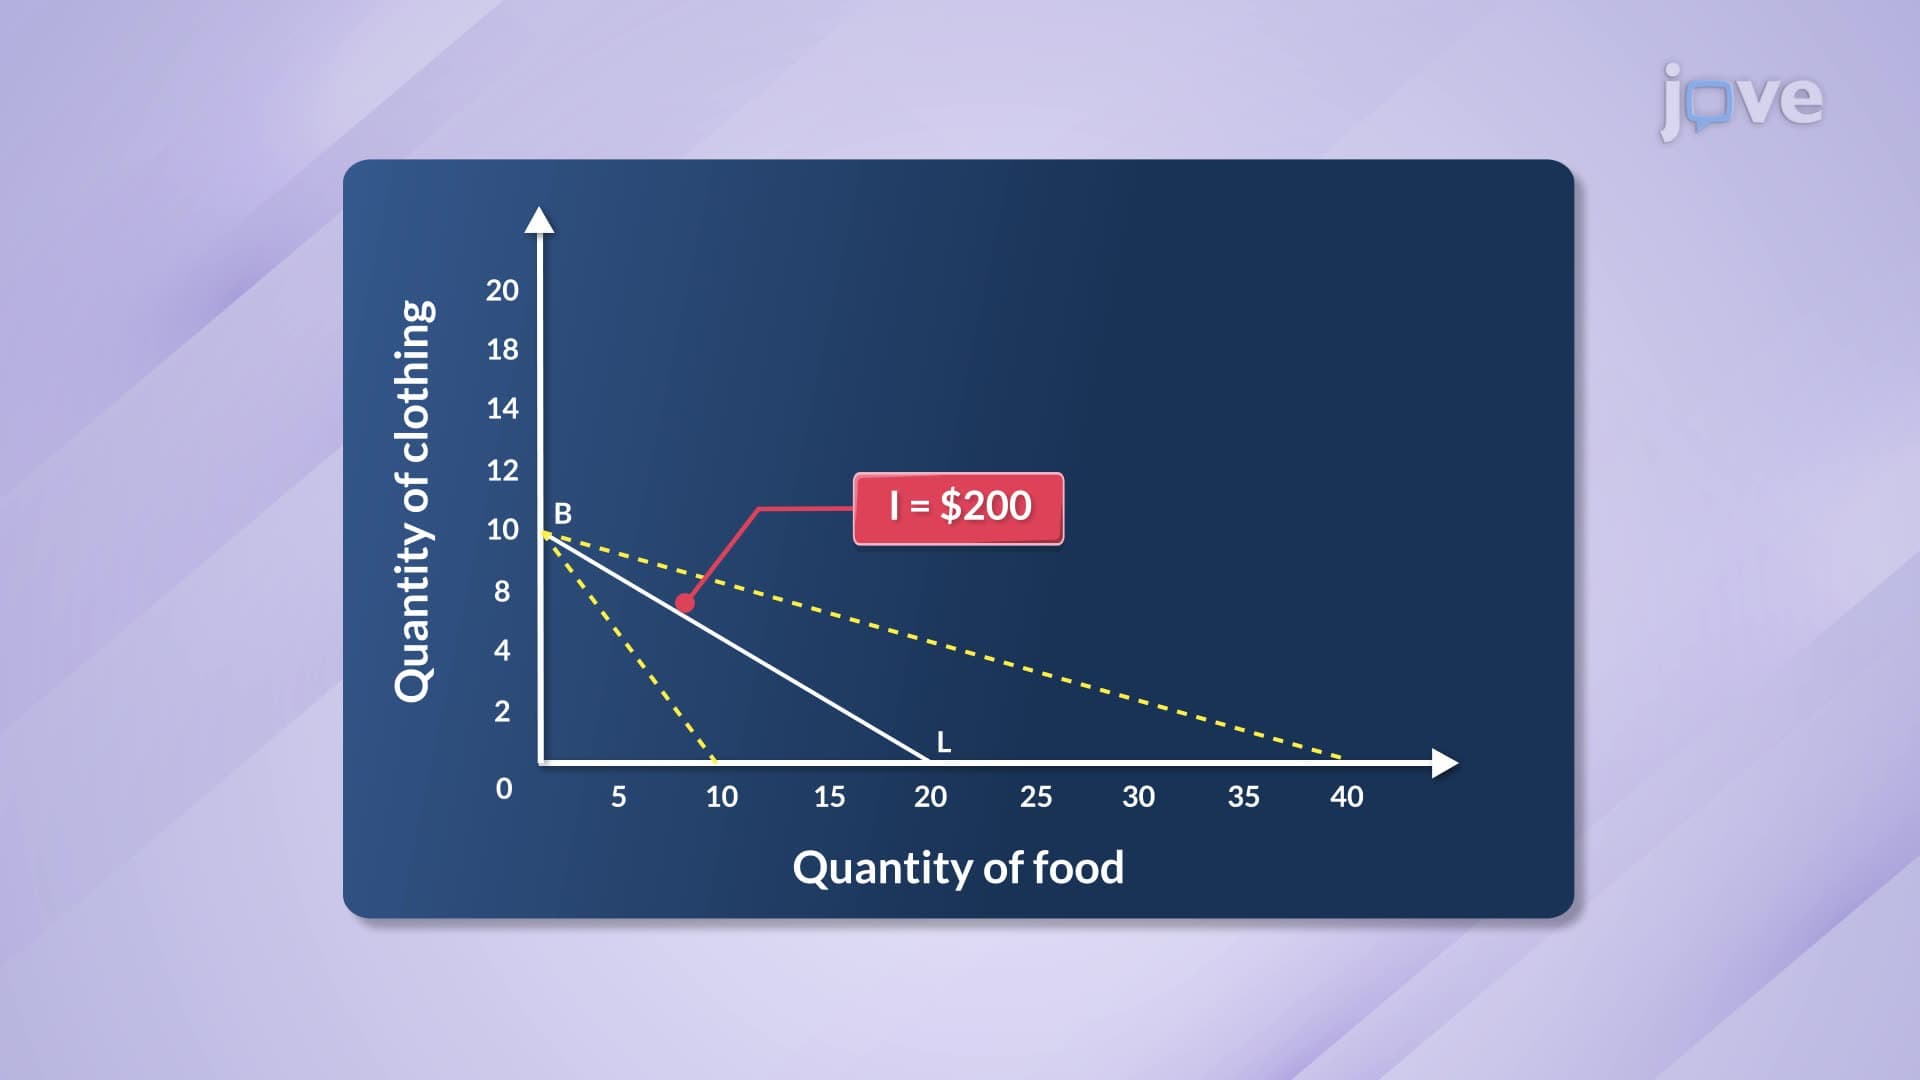
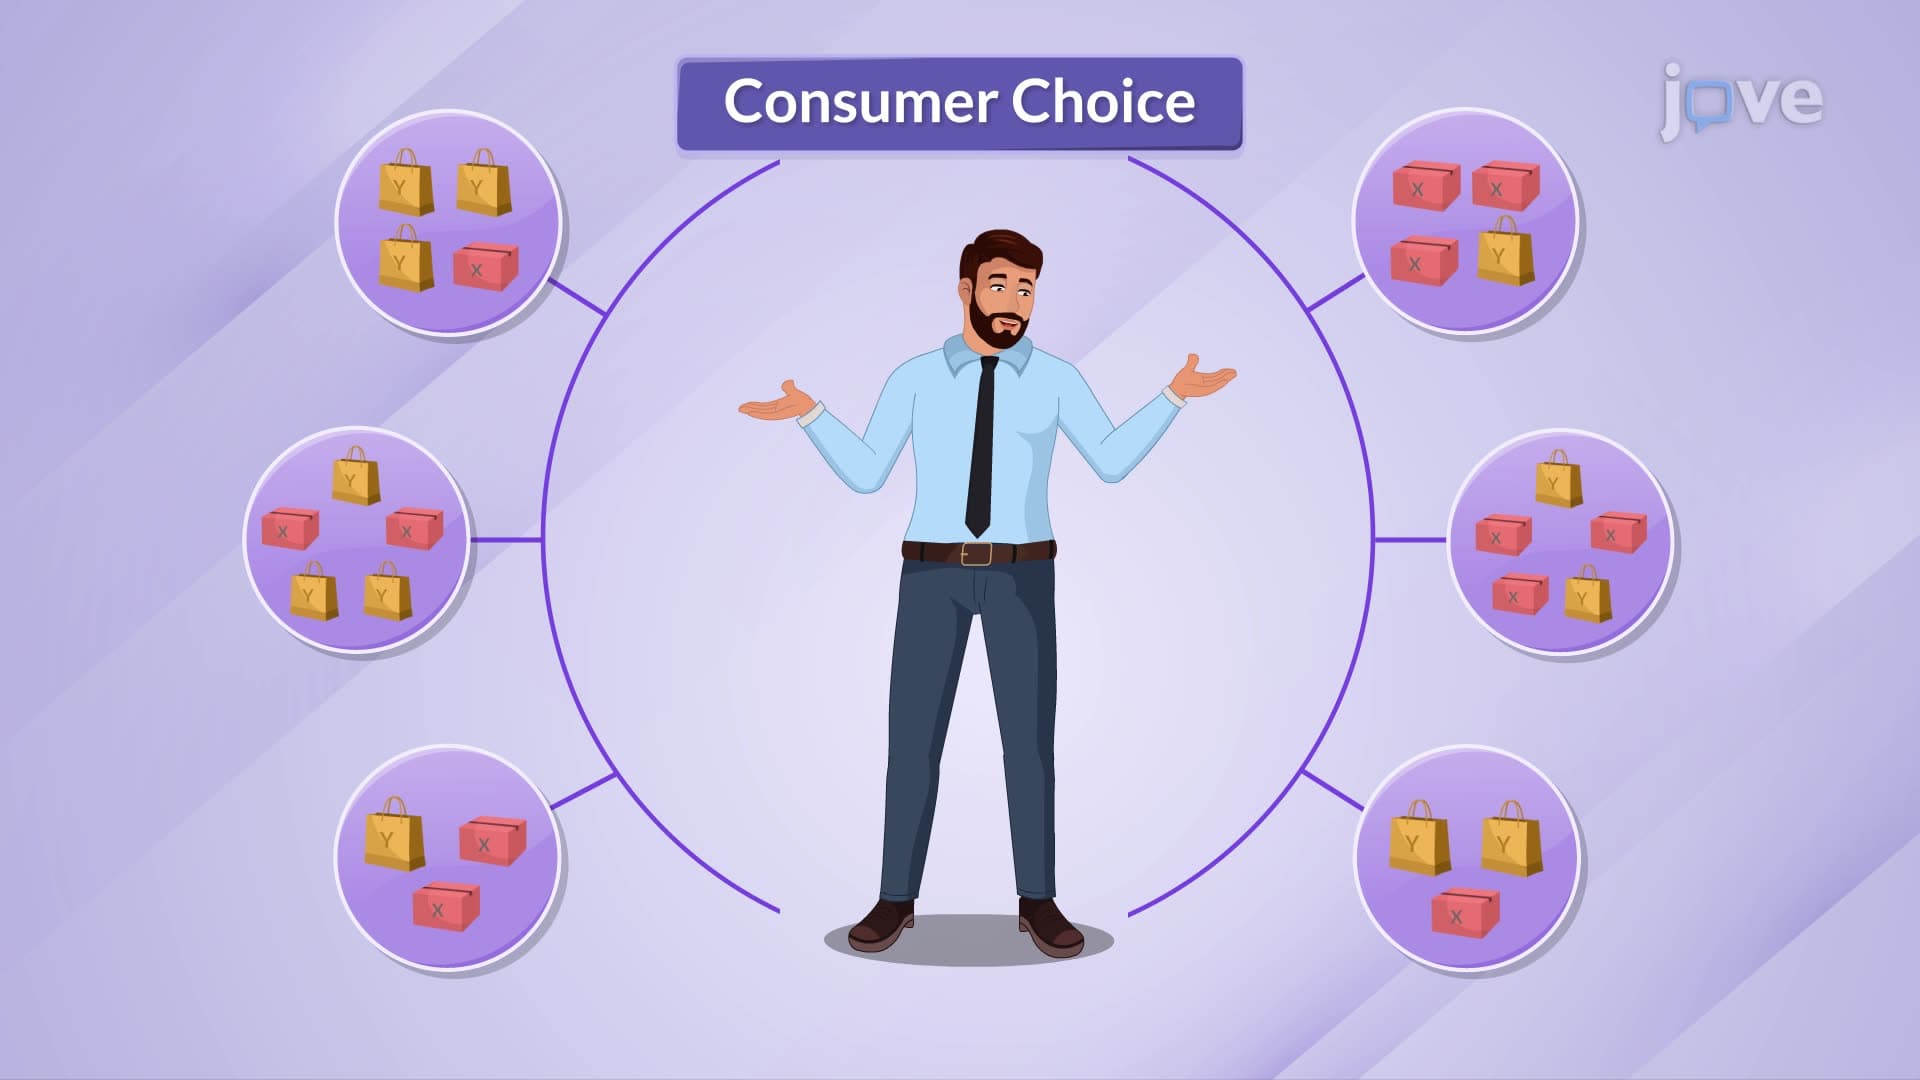
Consider choosing between streaming services and dining out with a monthly entertainment budget of $100. Netflix costs $15/month while restaurant meals average $25 each. Indifference curve analysis predicts how consumers trade between these options based on personal preferences, demonstrating convexity as satisfaction from additional restaurant visits decreases when you already have many relative to streaming variety.
Basic algebra and graph interpretation skills from high school Algebra II are sufficient for introductory indifference curve analysis. Most AP and introductory college courses focus on conceptual understanding rather than complex calculus derivations. Students need comfort with coordinate systems, slope calculations, and logical reasoning rather than advanced mathematical techniques to master these fundamental economic concepts.
Create concept maps linking curve properties to underlying economic principles like rationality and diminishing marginal utility. Practice drawing curves with different slopes and identifying violations of standard properties. Use flashcards for key terms like "marginal rate of substitution" and "monotonic preferences." Work through multiple choice questions that test curve interpretation and free-response problems requiring detailed explanations of economic reasoning.
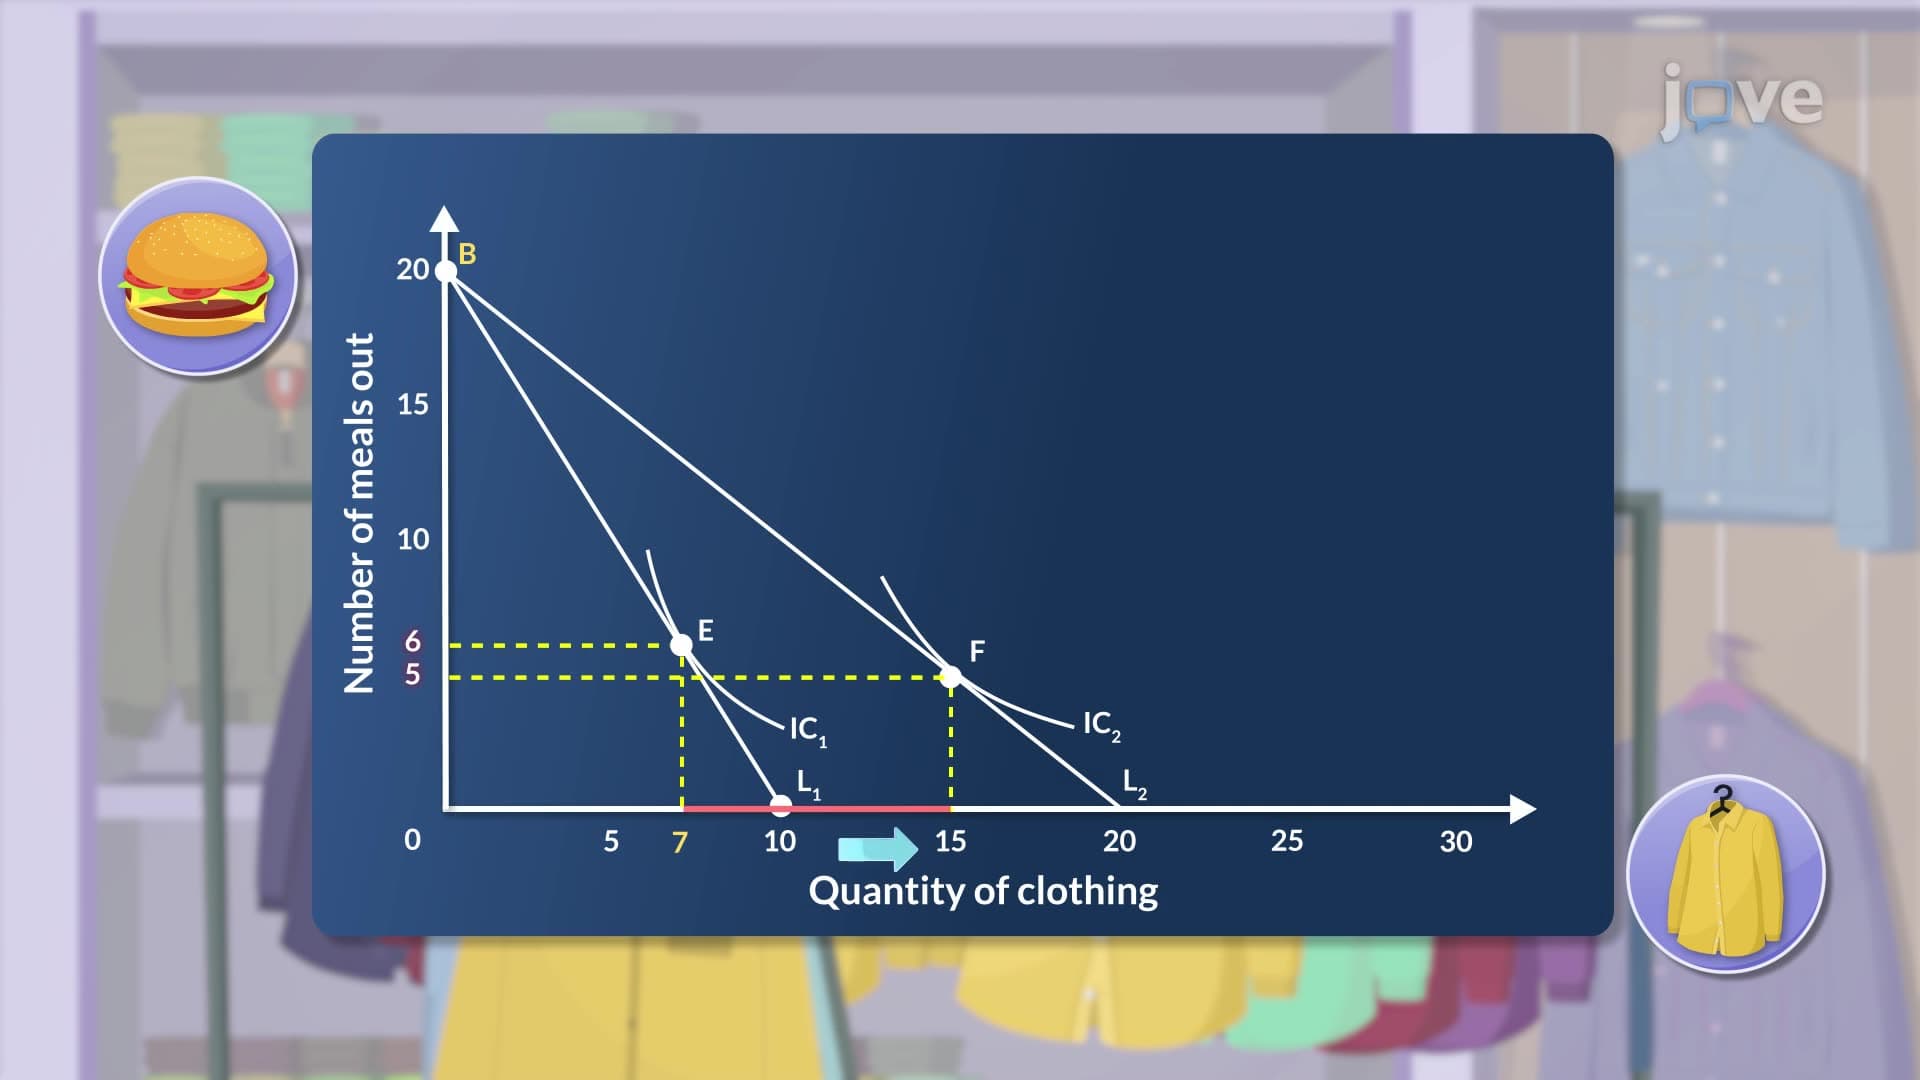
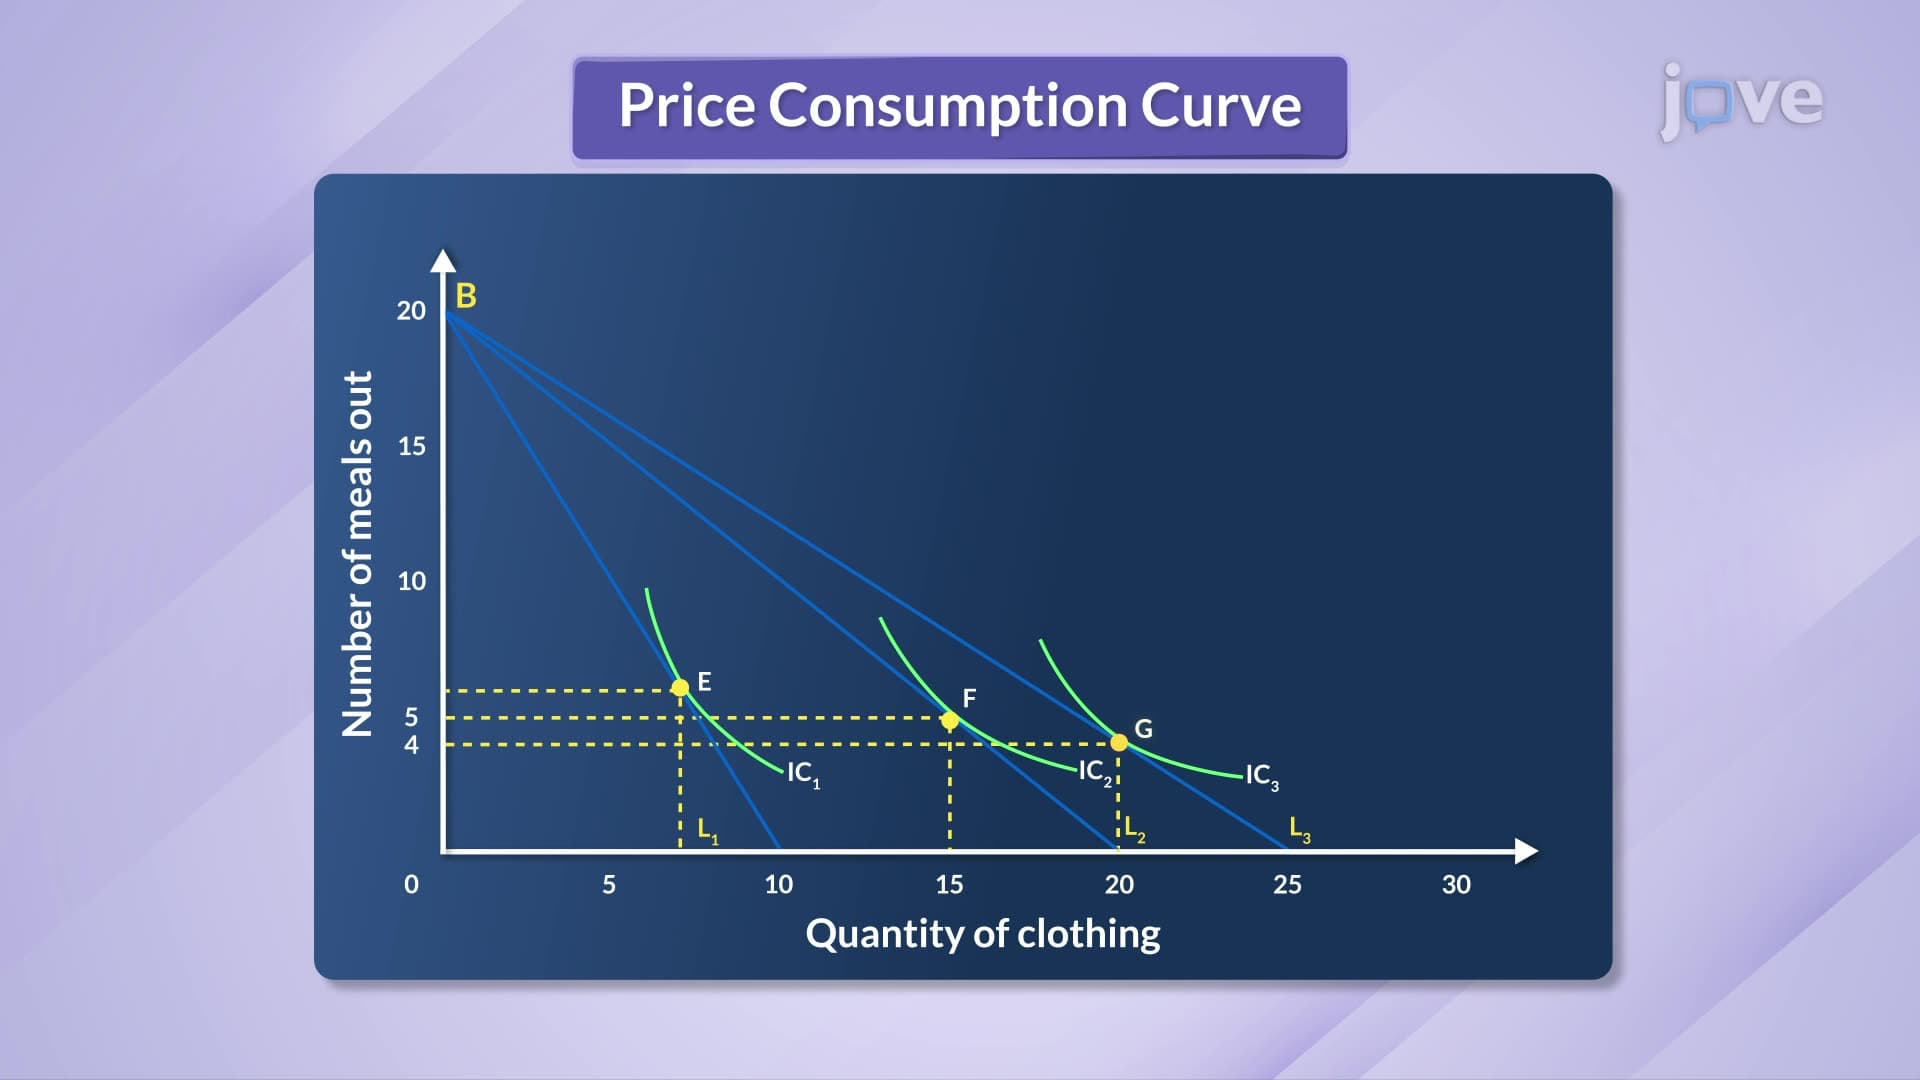
Progress to budget constraint analysis, utility maximization with Lagrange multipliers, and income/substitution effect decomposition. Advanced courses cover topics like revealed preference theory, corner solutions in optimization, and welfare economics applications. These concepts build directly on indifference curve foundations and appear in intermediate microeconomics, econometrics courses, and graduate school preparation materials.
Related Micro-courses