Loading subject page…


9,930 views


Video Summary: What are Types of Indifference Curves
Did you know that your daily choices between Coca-Cola and Pepsi can be mapped mathematically? Types of indifference curves reveal fascinating patterns in consumer behavior, from perfectly straight lines when products work as substitutes to L-shaped angles when items complement each other perfectly. Consider how American consumers view iPhone cases and smartphones-they're practically useless without each other, creating unique geometric patterns in economic analysis. Understanding what are types of indifference curves helps decode the psychology behind every purchasing decision. Watch the full video on JoVE Coach to master this concept with expert-led visuals and step-by-step explanations.
Types of indifference curves form the foundation of consumer choice theory in microeconomics, representing how rational consumers make decisions between different goods and services. These mathematical tools help economists predict behavior patterns and assist businesses in understanding market dynamics across American industries.
When consumers view products as perfect substitutes, their types of indifference curves appear as straight lines with negative slopes. Consider the rivalry between McDonald's and Burger King-many American consumers see these fast-food options as interchangeable. If a Big Mac costs $5 and a Whopper costs $4, a rational consumer maintains constant utility by trading these items at fixed rates.
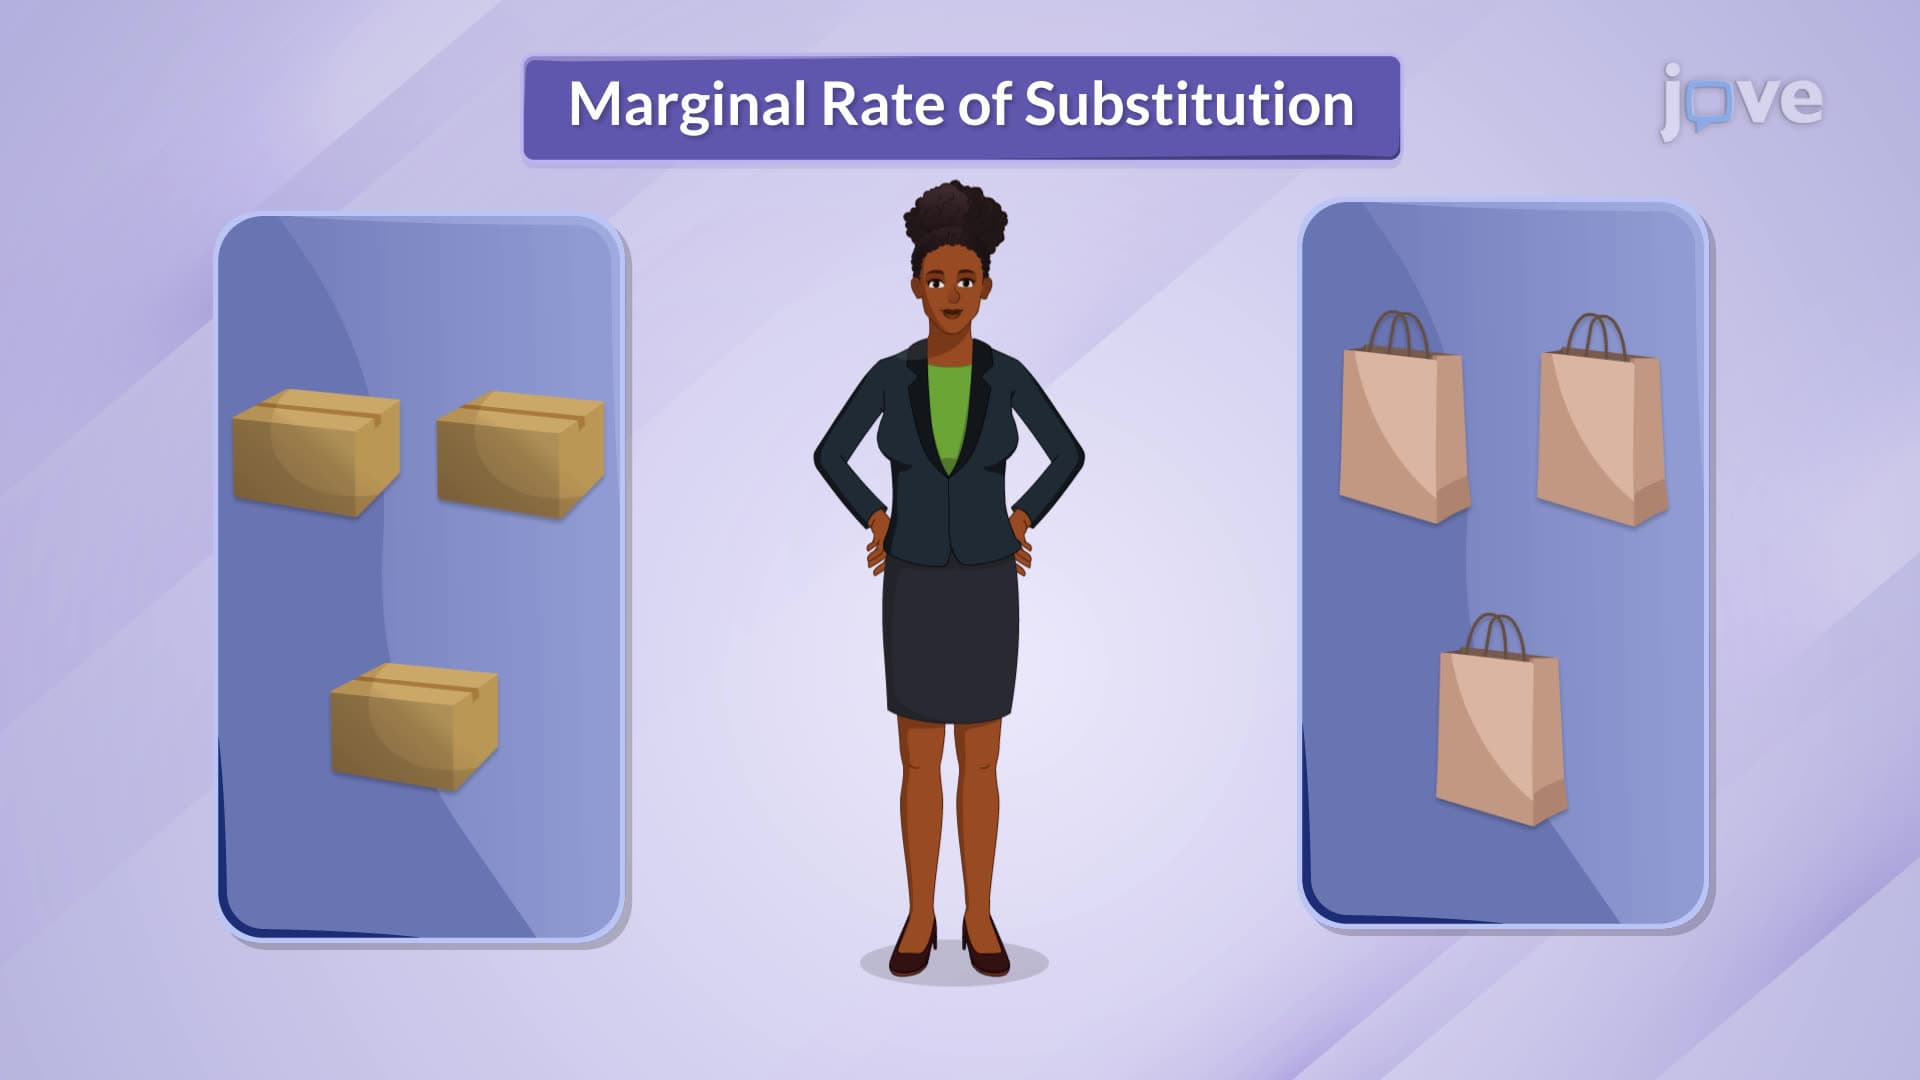
The mathematical relationship shows a constant marginal rate of substitution (MRS), meaning consumers willingly exchange goods at the same ratio throughout their consumption range. This concept frequently appears on AP Economics exams, where students must identify linear curves and calculate exchange rates between substitute goods.
Types of indifference curves definition explained becomes clearer when examining perfect complements, which create distinctive L-shaped or right-angled curves. American consumers demonstrate this relationship with products like cars and gasoline, smartphones and charging cables, or printers and ink cartridges.
The L-shape reflects zero substitutability-additional units of one good provide no extra satisfaction without corresponding units of the complementary good. Harvard Business School case studies often feature companies like Apple, which strategically designs complementary products to create these rigid consumption patterns.
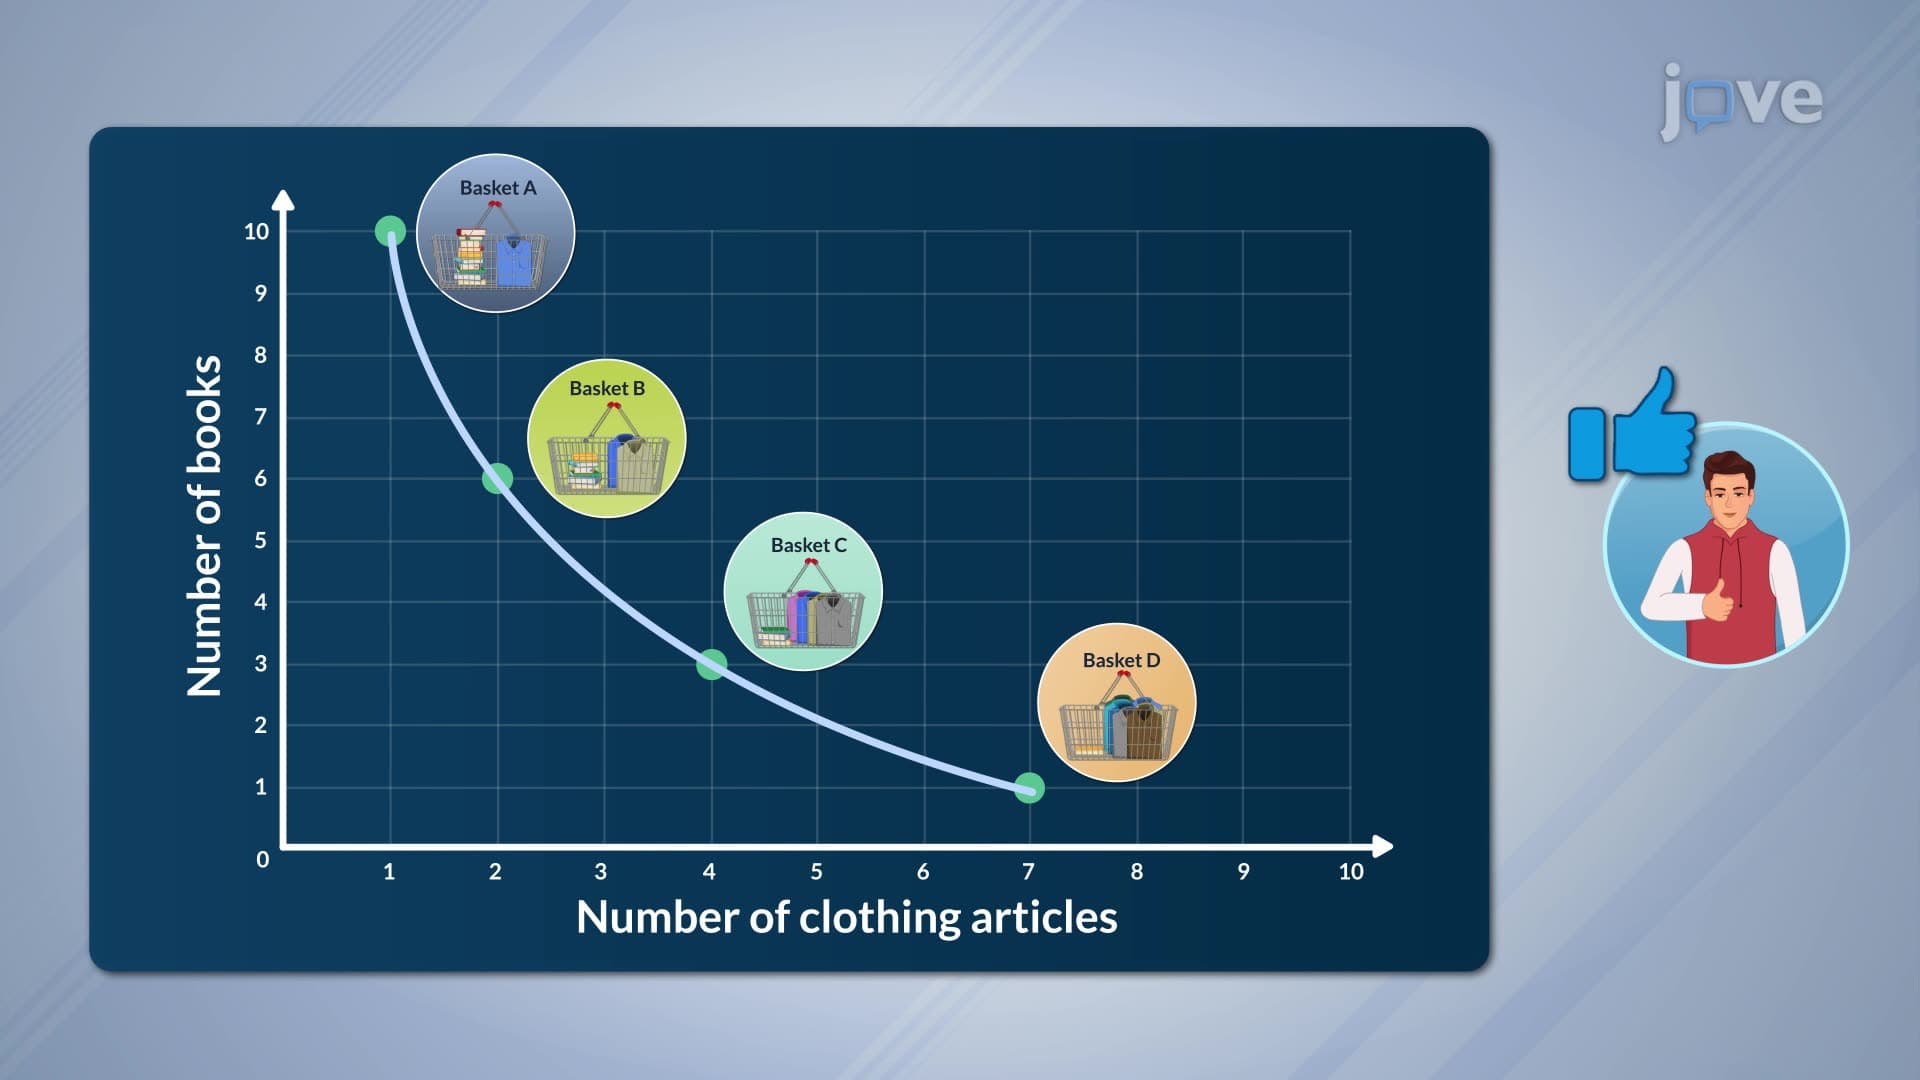
Most real-world scenarios involve normal goods with convex indifference curves that bow inward toward the origin. These curves reflect diminishing marginal rates of substitution-as consumers acquire more of one good, they require increasingly larger amounts of it to compensate for giving up another good.
American grocery shopping exemplifies this pattern when consumers choose between meat and vegetables, or entertainment options like Netflix subscriptions versus movie theater visits. The convex shape appears in SAT Subject Tests and college microeconomics courses, requiring students to understand why curves bend inward and how this relates to consumer satisfaction.
Understanding these types of indifference curves proves essential for business strategy, policy analysis, and academic success in economics programs across American universities.
Related Micro-courses