Loading subject page…

- Microeconomics
- Consumer Behavior
- Price Consumption Curve
Micro-course: Consumer Behavior
9,930 views
Learn key concepts and earn your certificate.









Price Consumption Curve

00:00
01:13
Video Summary: What Is Price Consumption Curve
Have you ever wondered why your favorite clothing brand suddenly becomes more appealing when it goes on sale? The price consumption curve reveals exactly how consumers adjust their purchasing patterns when prices change, keeping everything else constant. For instance, when Target reduces prices on winter jackets from $80 to $40, shoppers dramatically increase their jacket purchases while maintaining the same spending on other items. This economic concept demonstrates the direct relationship between price changes and quantity demanded through graphical analysis. Watch the full video on JoVE Coach to master this concept with expert-led visuals and step-by-step explanations.
- Understand what is price consumption curve and how it illustrates consumer behavior when product prices change while income and other prices remain constant
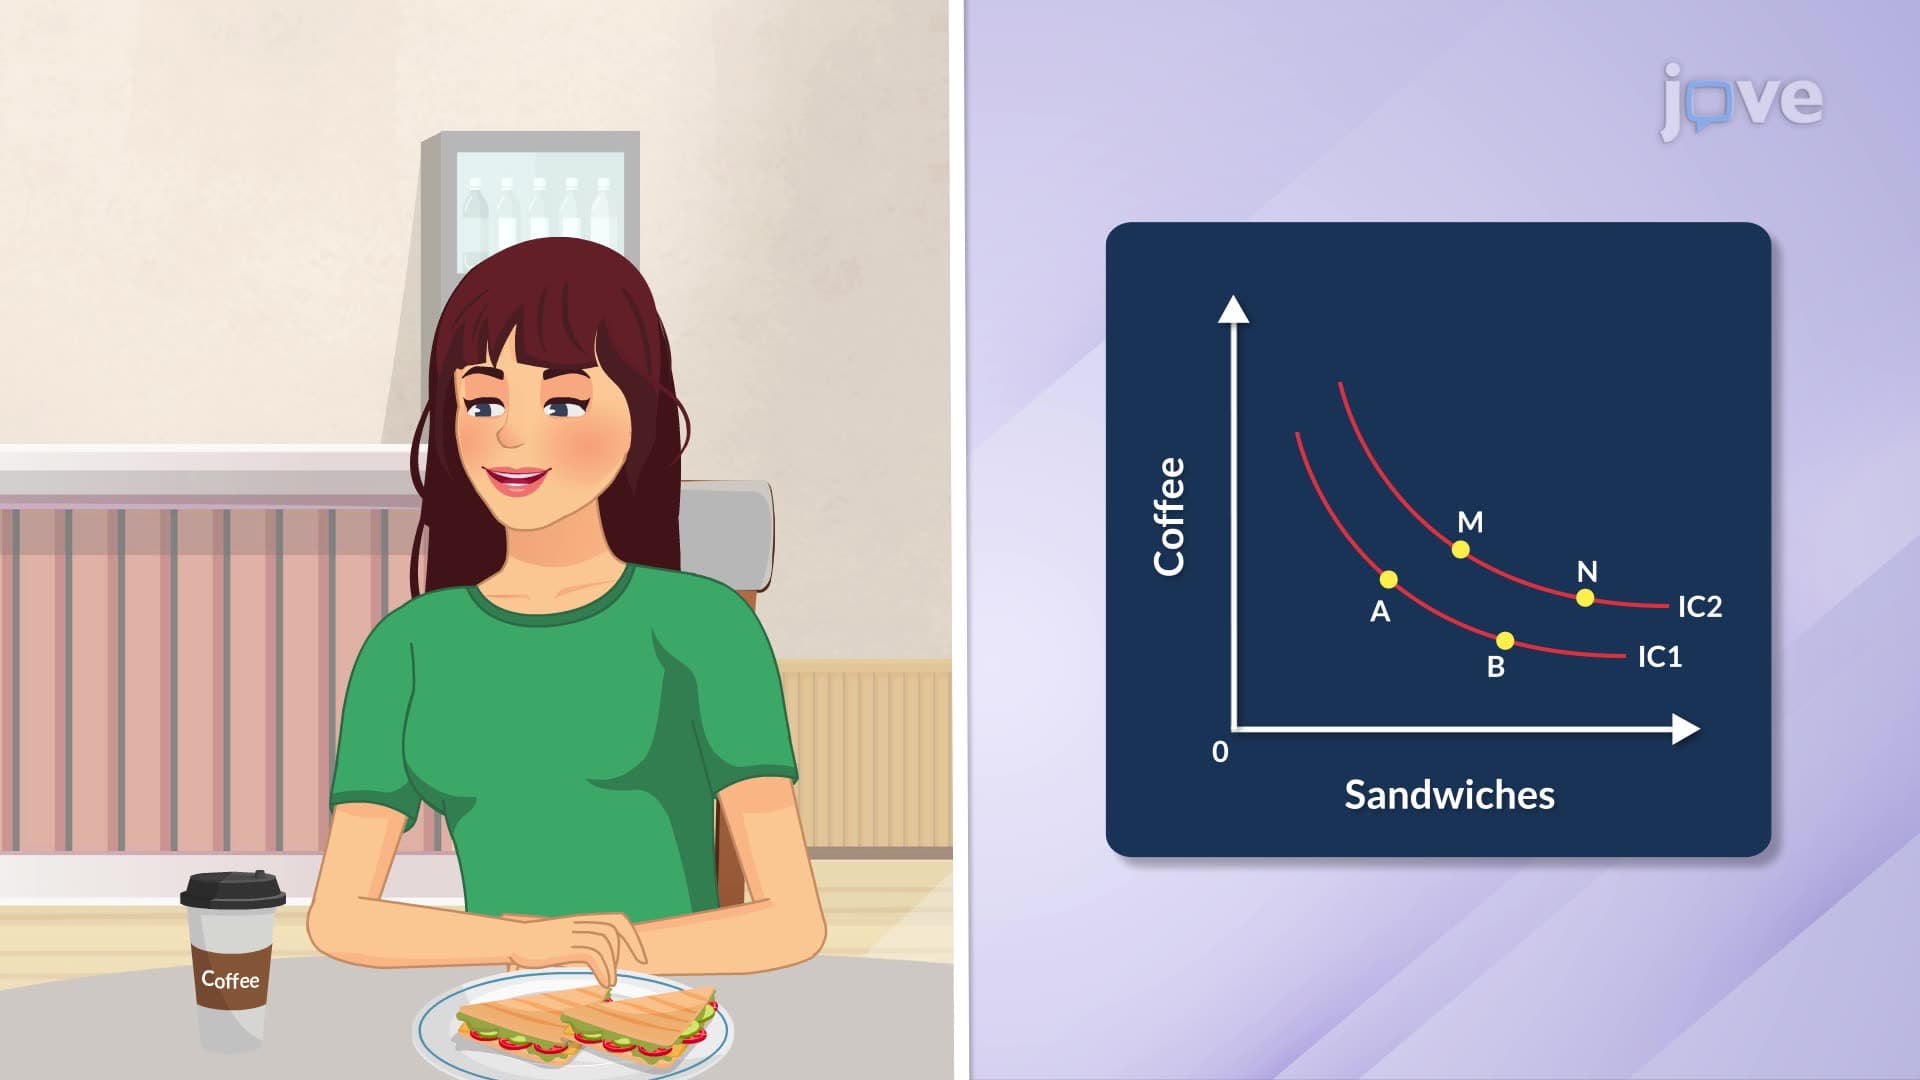
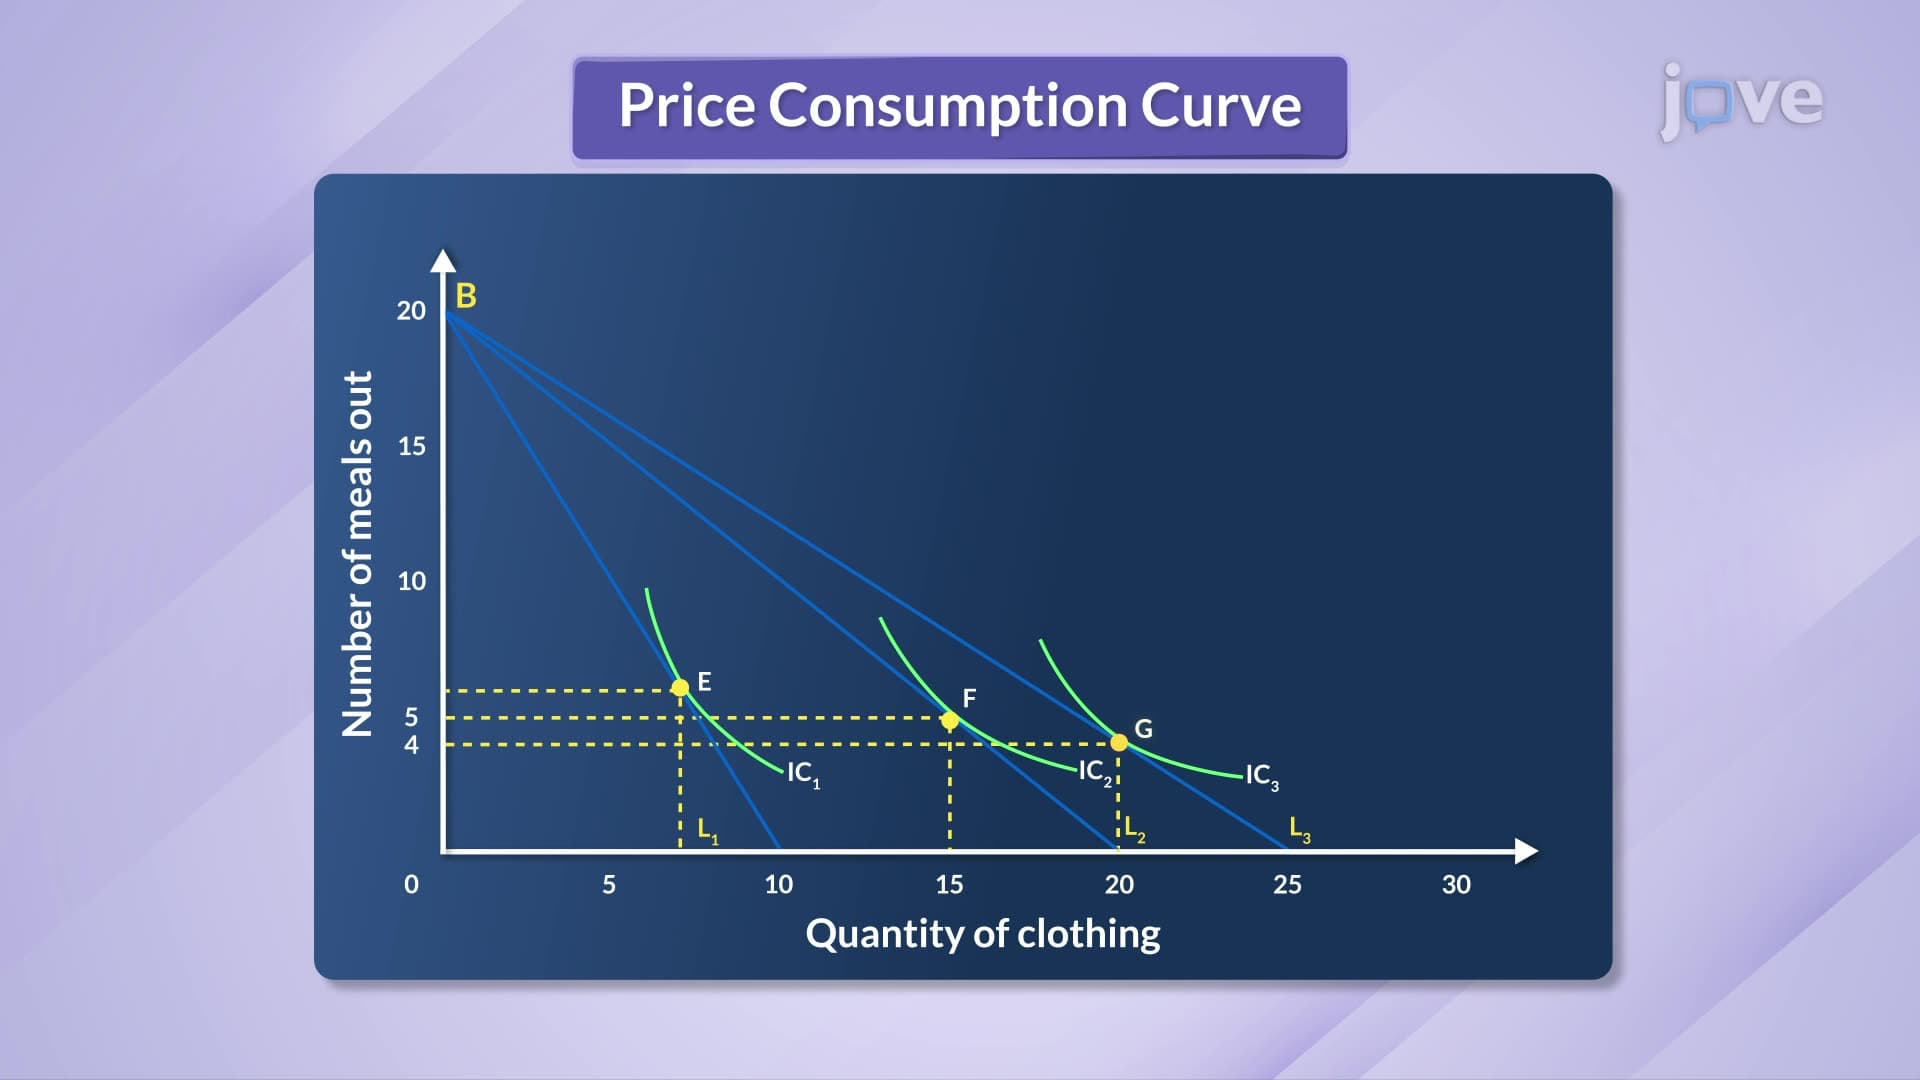
- Identify the key components of price consumption curve analysis, including budget lines, indifference curves, and equilibrium points
- Analyze how budget line rotations occur when one product's price decreases, creating new consumption possibilities for rational consumers
- Apply price consumption curve concepts to derive individual demand curves and understand the relationship between these two economic tools
- Evaluate real-world consumer scenarios using price consumption curve frameworks to predict purchasing behavior changes
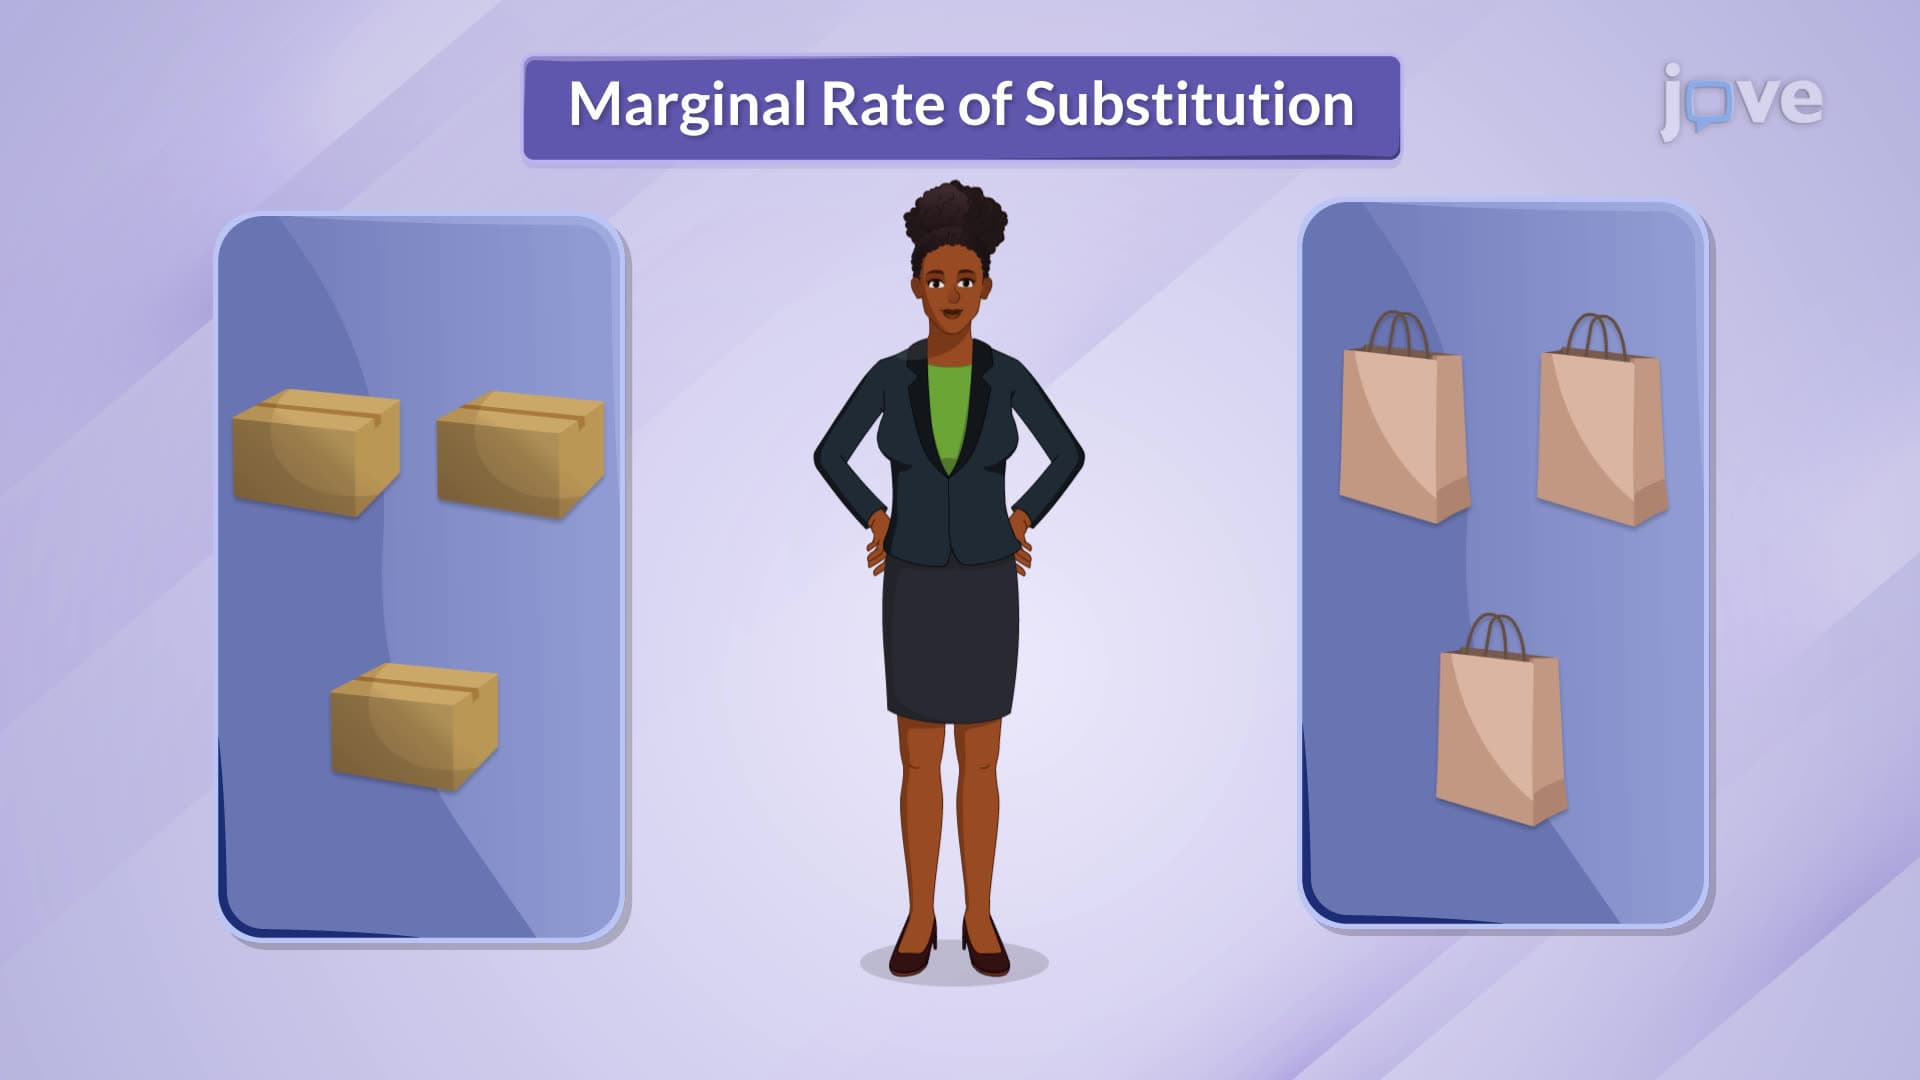
- Compare different equilibrium points along the price consumption curve to understand substitution and income effects
- Recognize how price consumption curves connect to broader microeconomic principles taught in AP Economics and college-level courses
- Explore the mathematical relationship between price changes and quantity demanded through graphical representation
Understanding the Price Consumption Curve Foundation
The price consumption curve represents one of microeconomics' most practical tools for analyzing consumer behavior. Unlike abstract economic theories, this concept directly explains observable shopping patterns you witness daily. When Amazon drops prices during Prime Day or when gas prices fluctuate at ExxonMobil stations, consumer responses follow predictable patterns that the price consumption curve captures mathematically.
This curve specifically measures how quantity demanded changes when one product's price varies while holding the consumer's income and all other prices constant. This ceteris paribus assumption allows economists to isolate price effects from other influences, creating clean analytical frameworks essential for AP Microeconomics students and college economics majors.
Budget Line Mechanics and Consumer Equilibrium
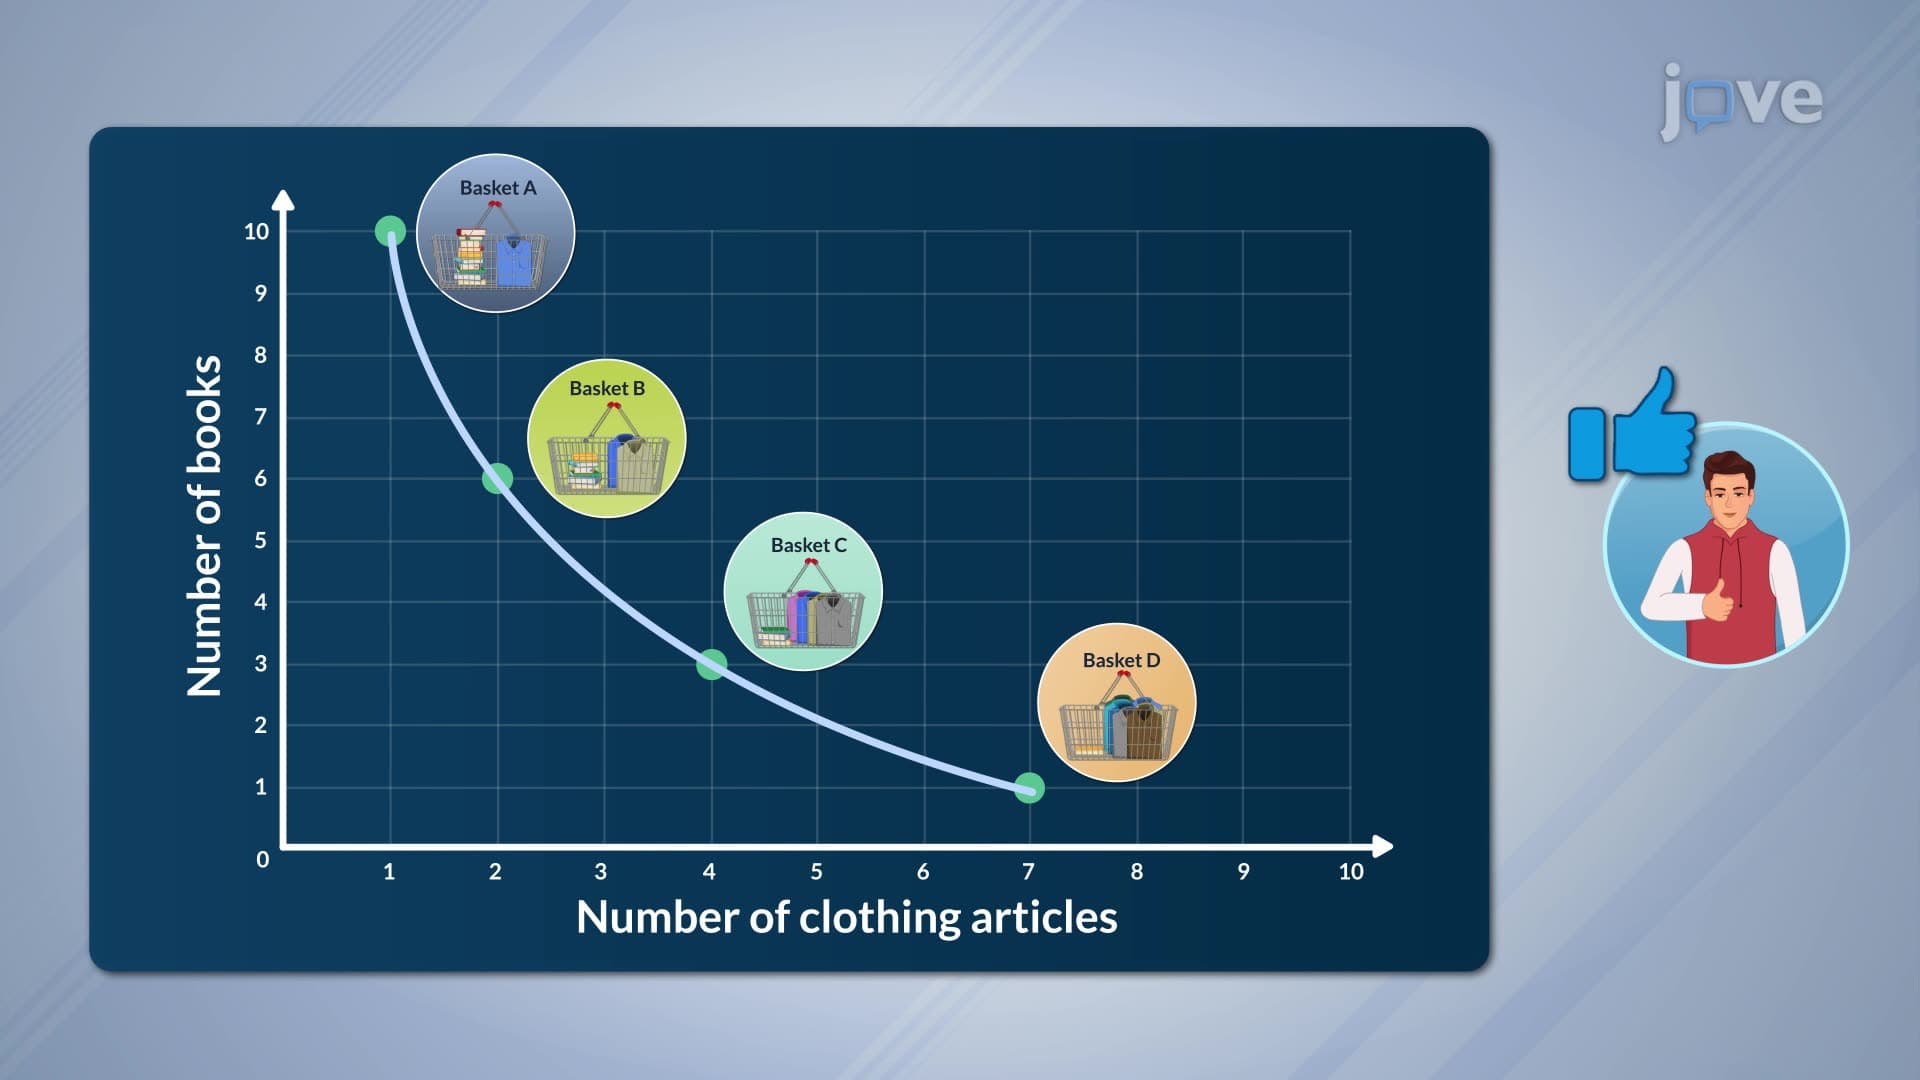
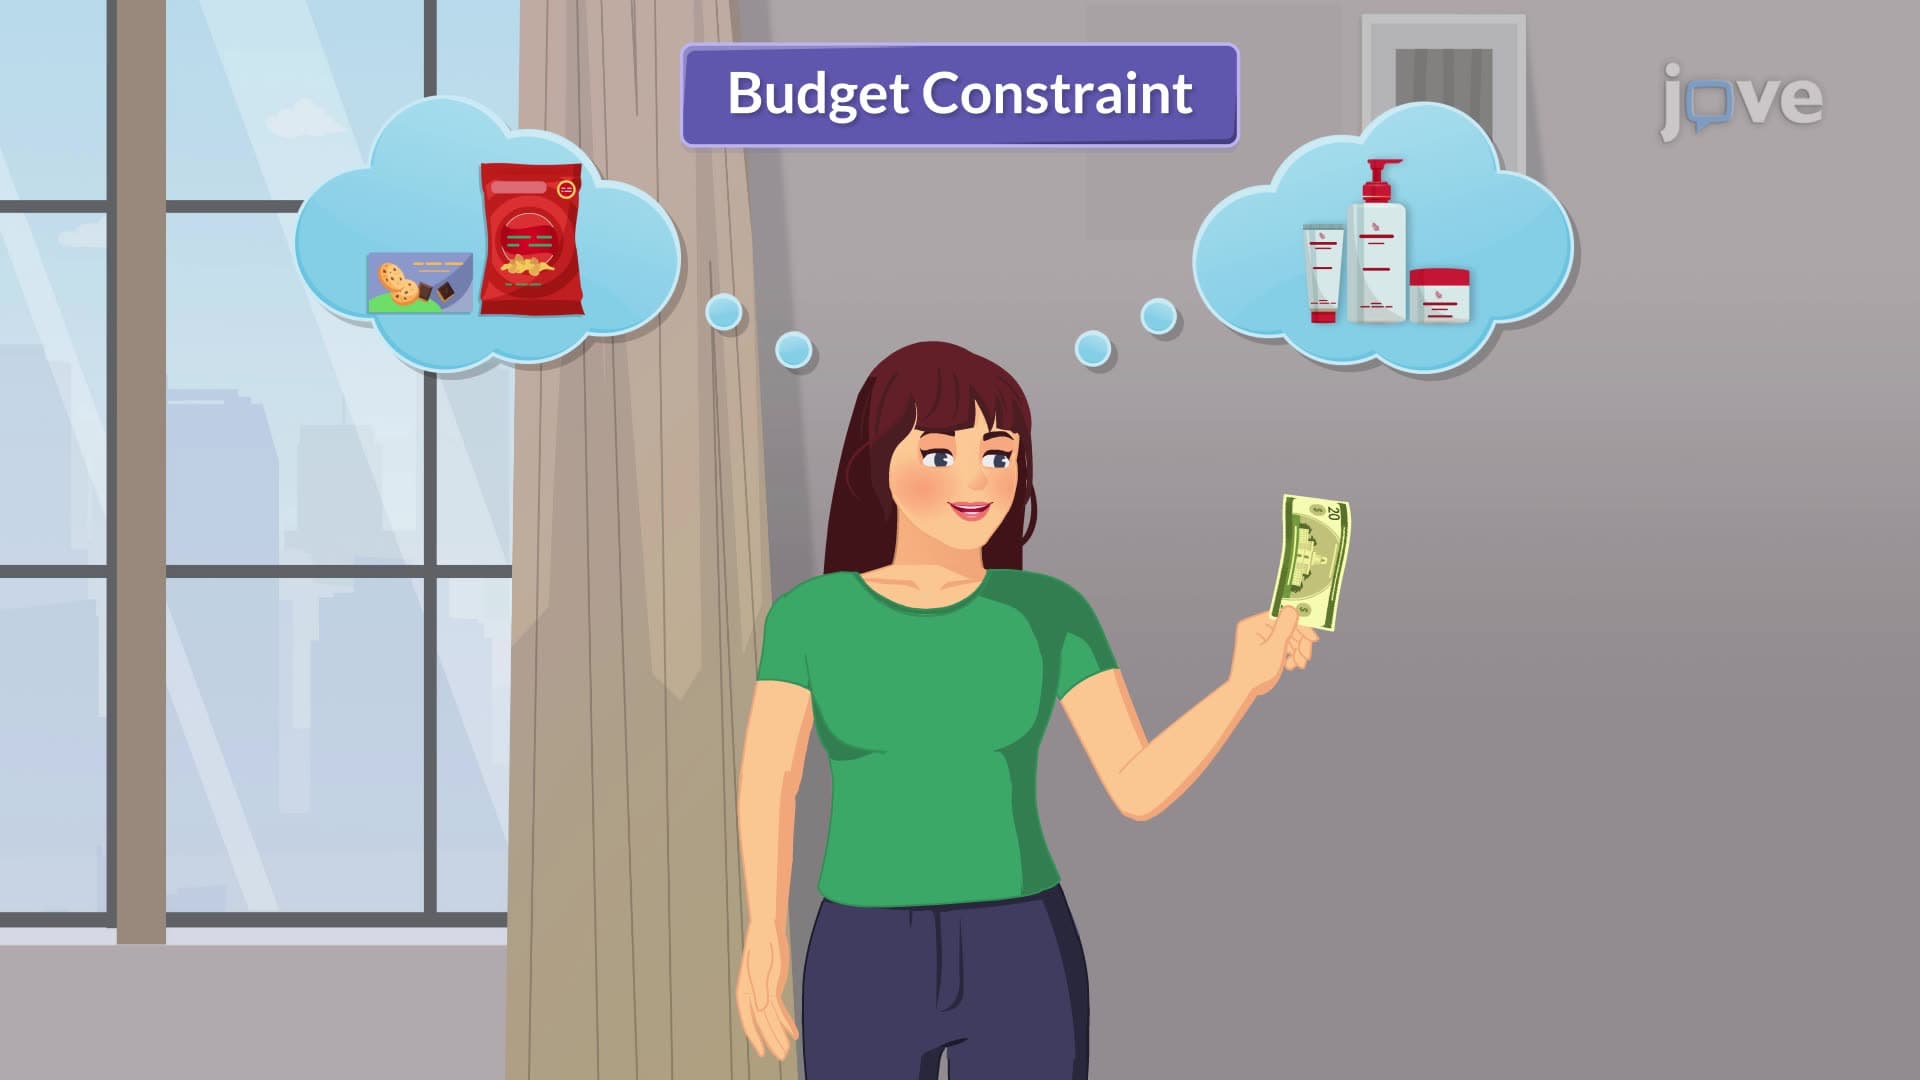
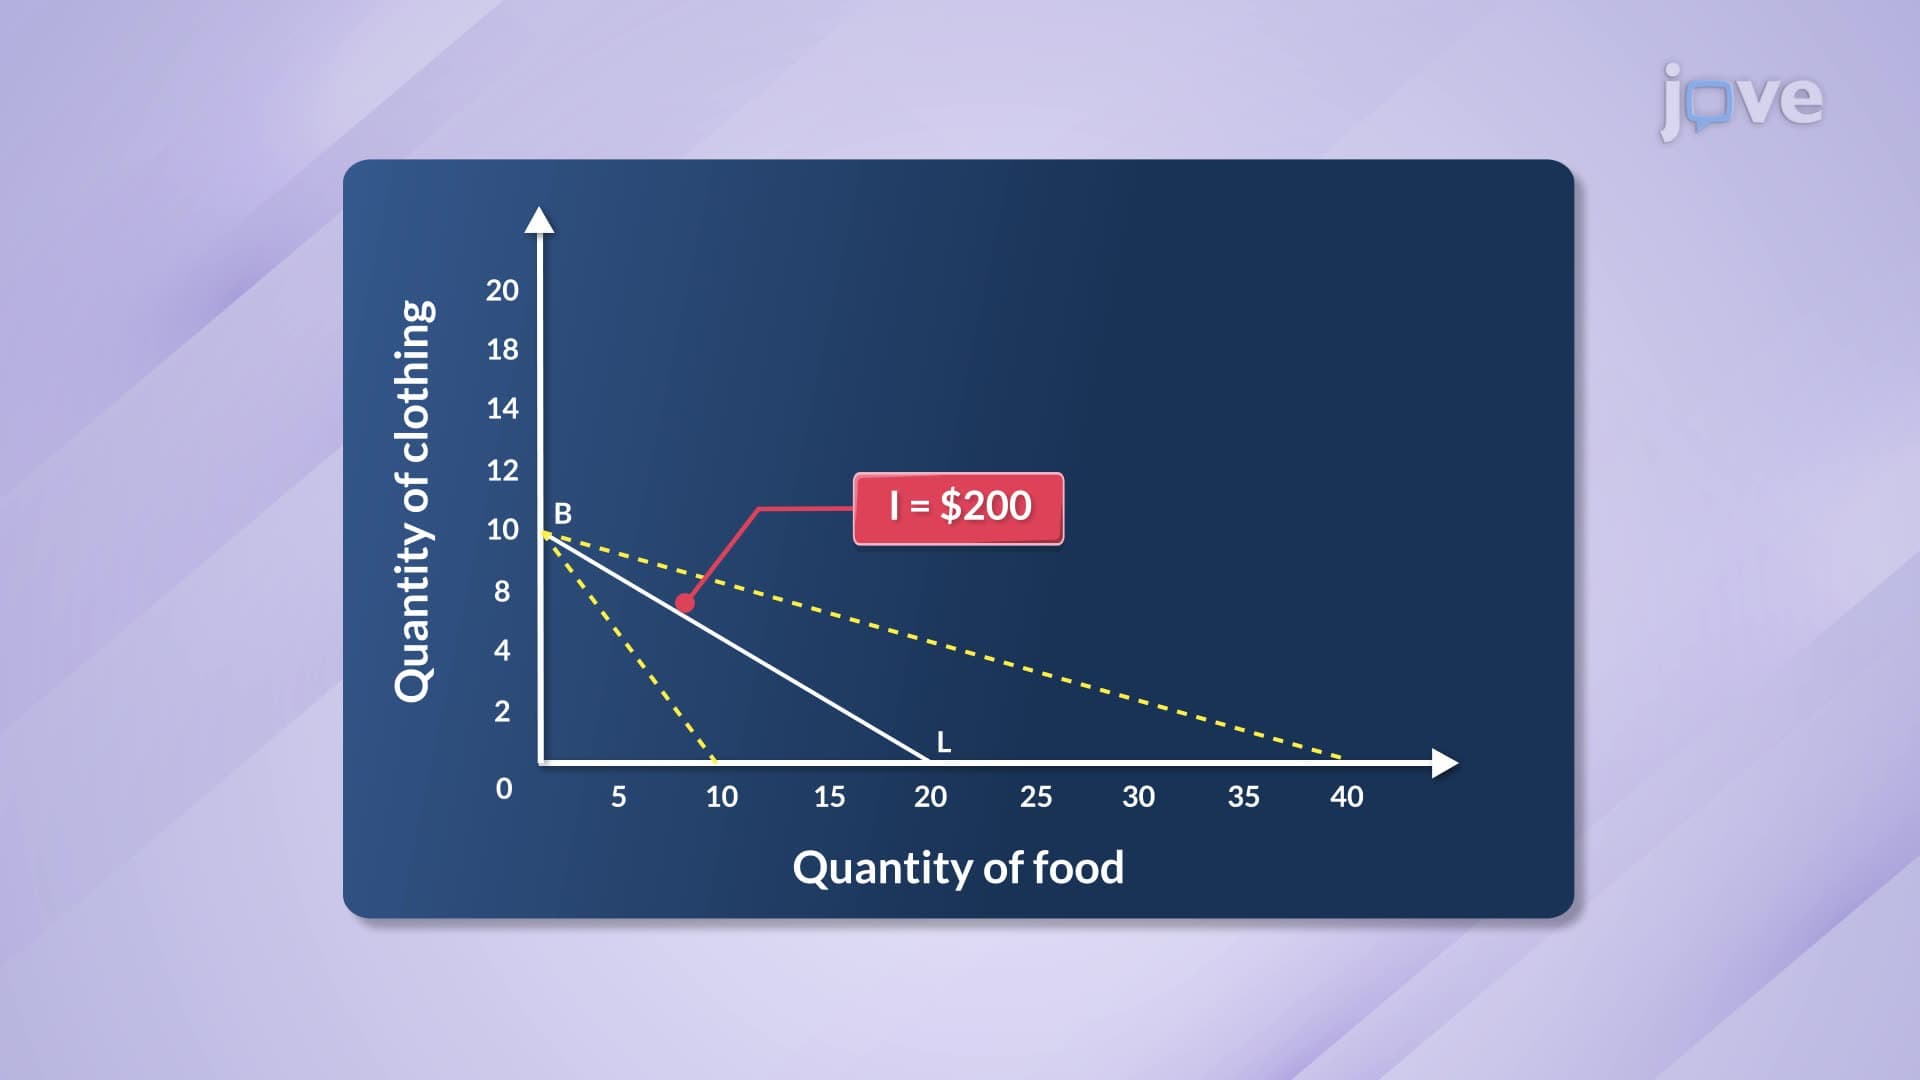
The foundation begins with budget constraints. Consider a college student with $200 weekly spending money choosing between textbooks ($50 each) and coffee shop visits ($5 each). Initially, she can afford 4 textbooks or 40 coffee visits, or any combination along her budget line. Her optimal choice occurs where her marginal utility per dollar spent equals across both goods.
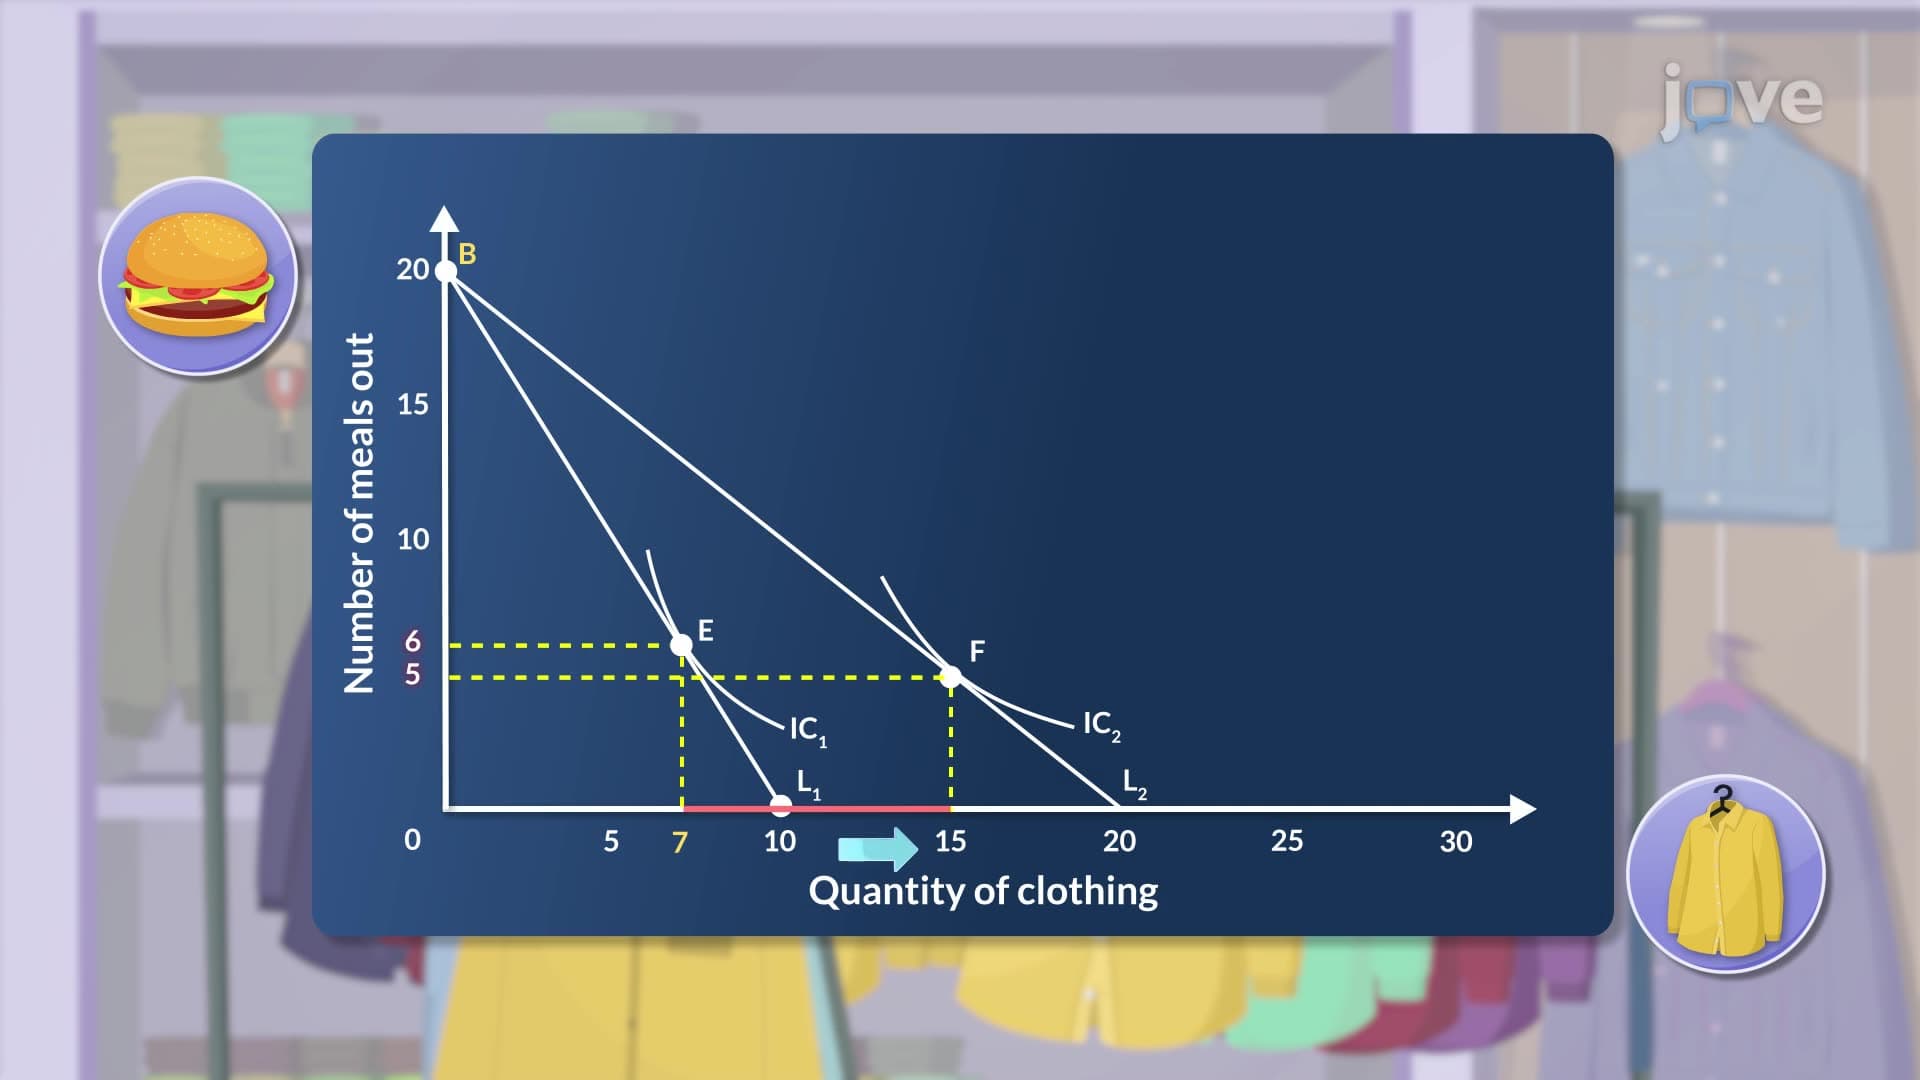
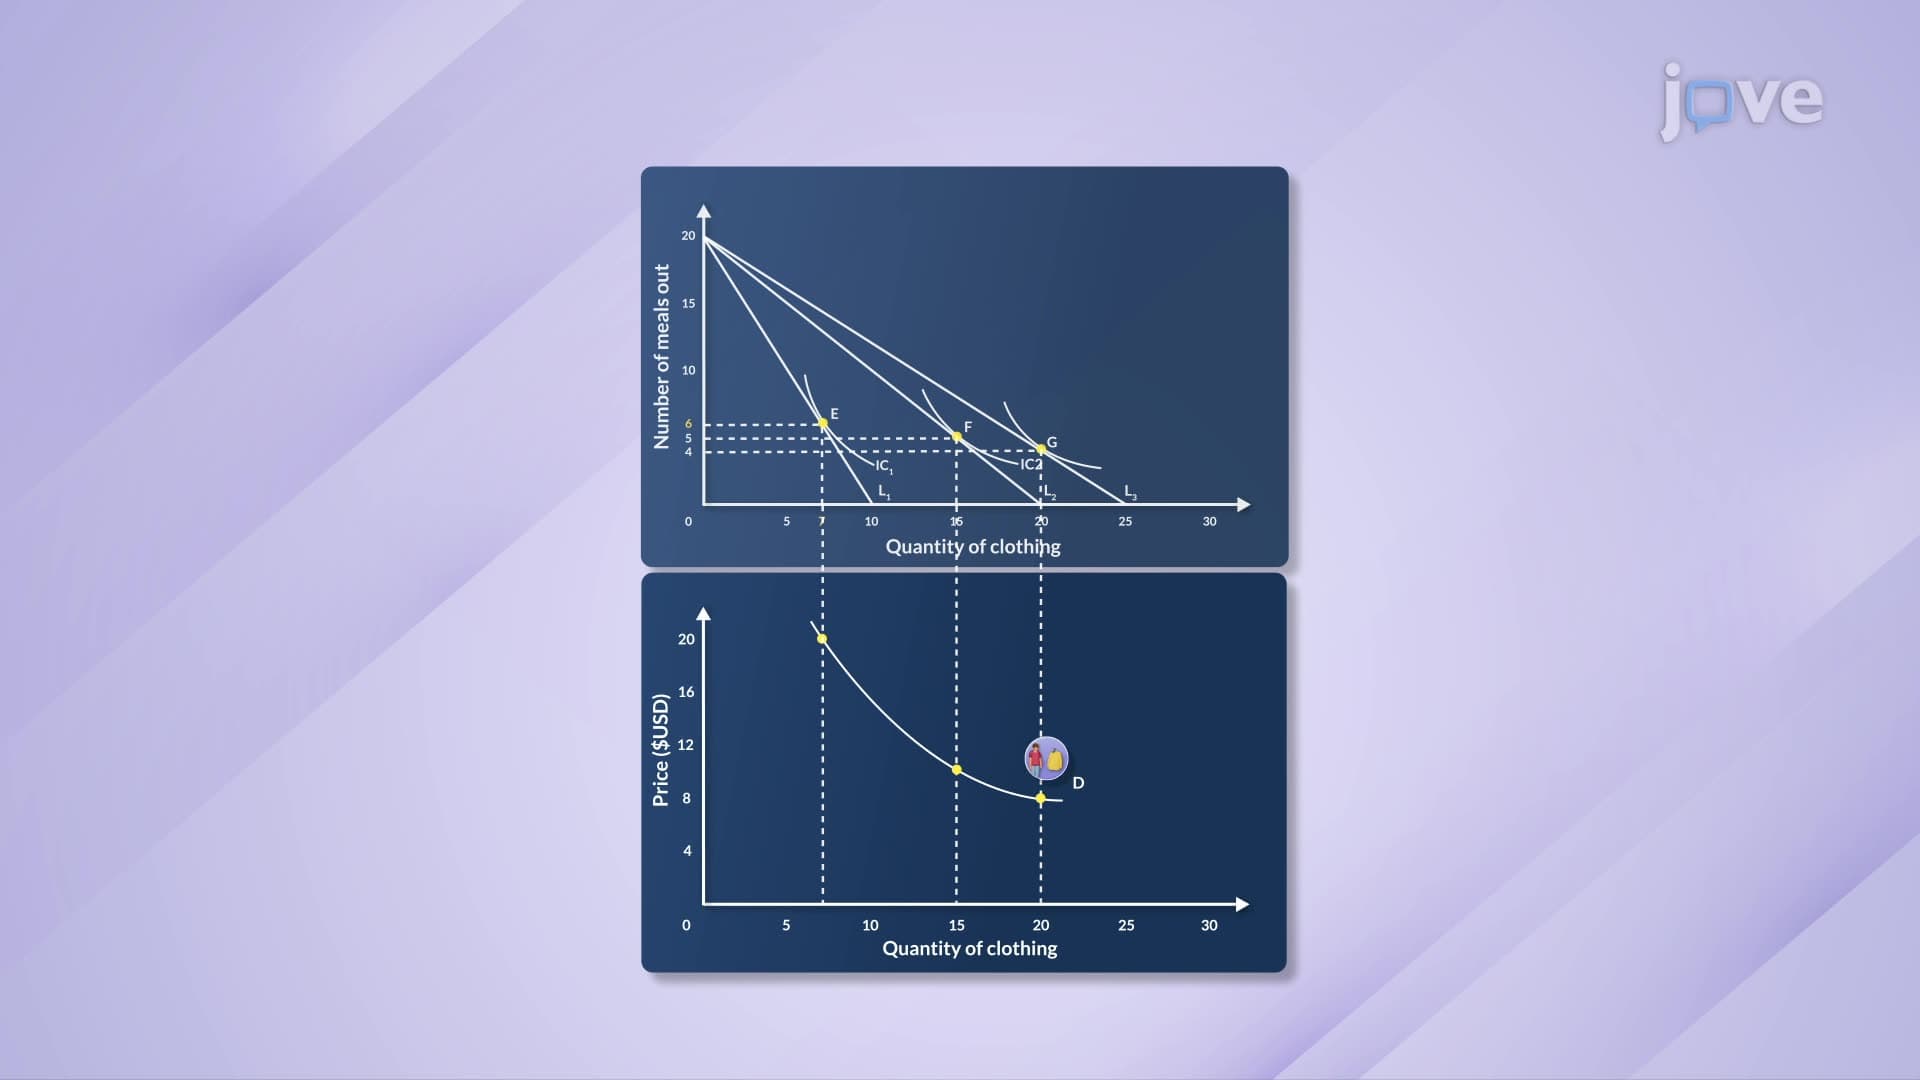
When textbook prices drop to $25, her budget line rotates outward, expanding consumption possibilities. She might now purchase 6 textbooks while maintaining similar coffee consumption. Each price change creates a new equilibrium point, and connecting these points forms the price consumption curve.
Deriving Demand Curves from Price Consumption Analysis
The price consumption curve's primary application involves constructing individual demand curves. By plotting the price-quantity combinations from each equilibrium point, economists create downward-sloping demand relationships. This process appears frequently on SAT Subject Tests and college microeconomics exams.
For instance, Netflix's pricing decisions demonstrate this relationship. When subscription costs decrease, households typically upgrade to premium plans or add additional screens. The price consumption curve captures these behavioral shifts, while the derived demand curve shows the mathematical relationship between price and quantity demanded.
Real-World Applications in American Markets
Major US retailers like Walmart and Target extensively use price consumption curve principles for pricing strategies. During Black Friday sales, when electronics prices drop significantly, consumers predictably increase purchases while potentially reducing spending on clothing or home goods. This cross-category effect illustrates the curve's practical importance in business decision-making and market analysis that students encounter in business school case studies.
Frequently Asked Questions
The price consumption curve shows how much of a product consumers buy when its price changes, assuming their income and other prices stay the same. It connects all the optimal consumption points when one product's price varies. This creates a visual representation of consumer response to price changes, helping economists understand demand patterns.
AP Microeconomics frequently tests price consumption curves through free-response questions requiring graph construction and interpretation. Students must demonstrate understanding of budget line rotations, equilibrium point identification, and demand curve derivation. Practice with College Board released exams shows these concepts appear in approximately 30% of microeconomics tests.
The price consumption curve plots optimal consumption bundles across different price levels on a two-good graph, while the demand curve shows the price-quantity relationship for a single good. The demand curve is actually derived from the price consumption curve by extracting price-quantity coordinates. Both tools serve different analytical purposes in consumer theory.
When Starbucks reduces coffee prices from $5 to $3, customers typically increase coffee purchases while maintaining similar spending on food items. The price consumption curve would show increased coffee consumption at each lower price point, demonstrating how American consumers respond to coffee price changes while keeping their total Starbucks budget relatively constant.
Basic algebra and graph reading skills suffice for understanding price consumption curves at the high school and introductory college level. You'll work with budget equations like Income = (Price A × Quantity A) + (Price B × Quantity B), but calculus isn't required. Most students who complete Algebra II successfully grasp these concepts with adequate practice.
Focus on drawing accurate graphs showing budget line rotations and equilibrium points, then practice deriving demand curves from price consumption data. Create flashcards for key terminology and work through numerical examples. Most importantly, connect theoretical concepts to real-world scenarios like retail pricing or utility company rate changes.
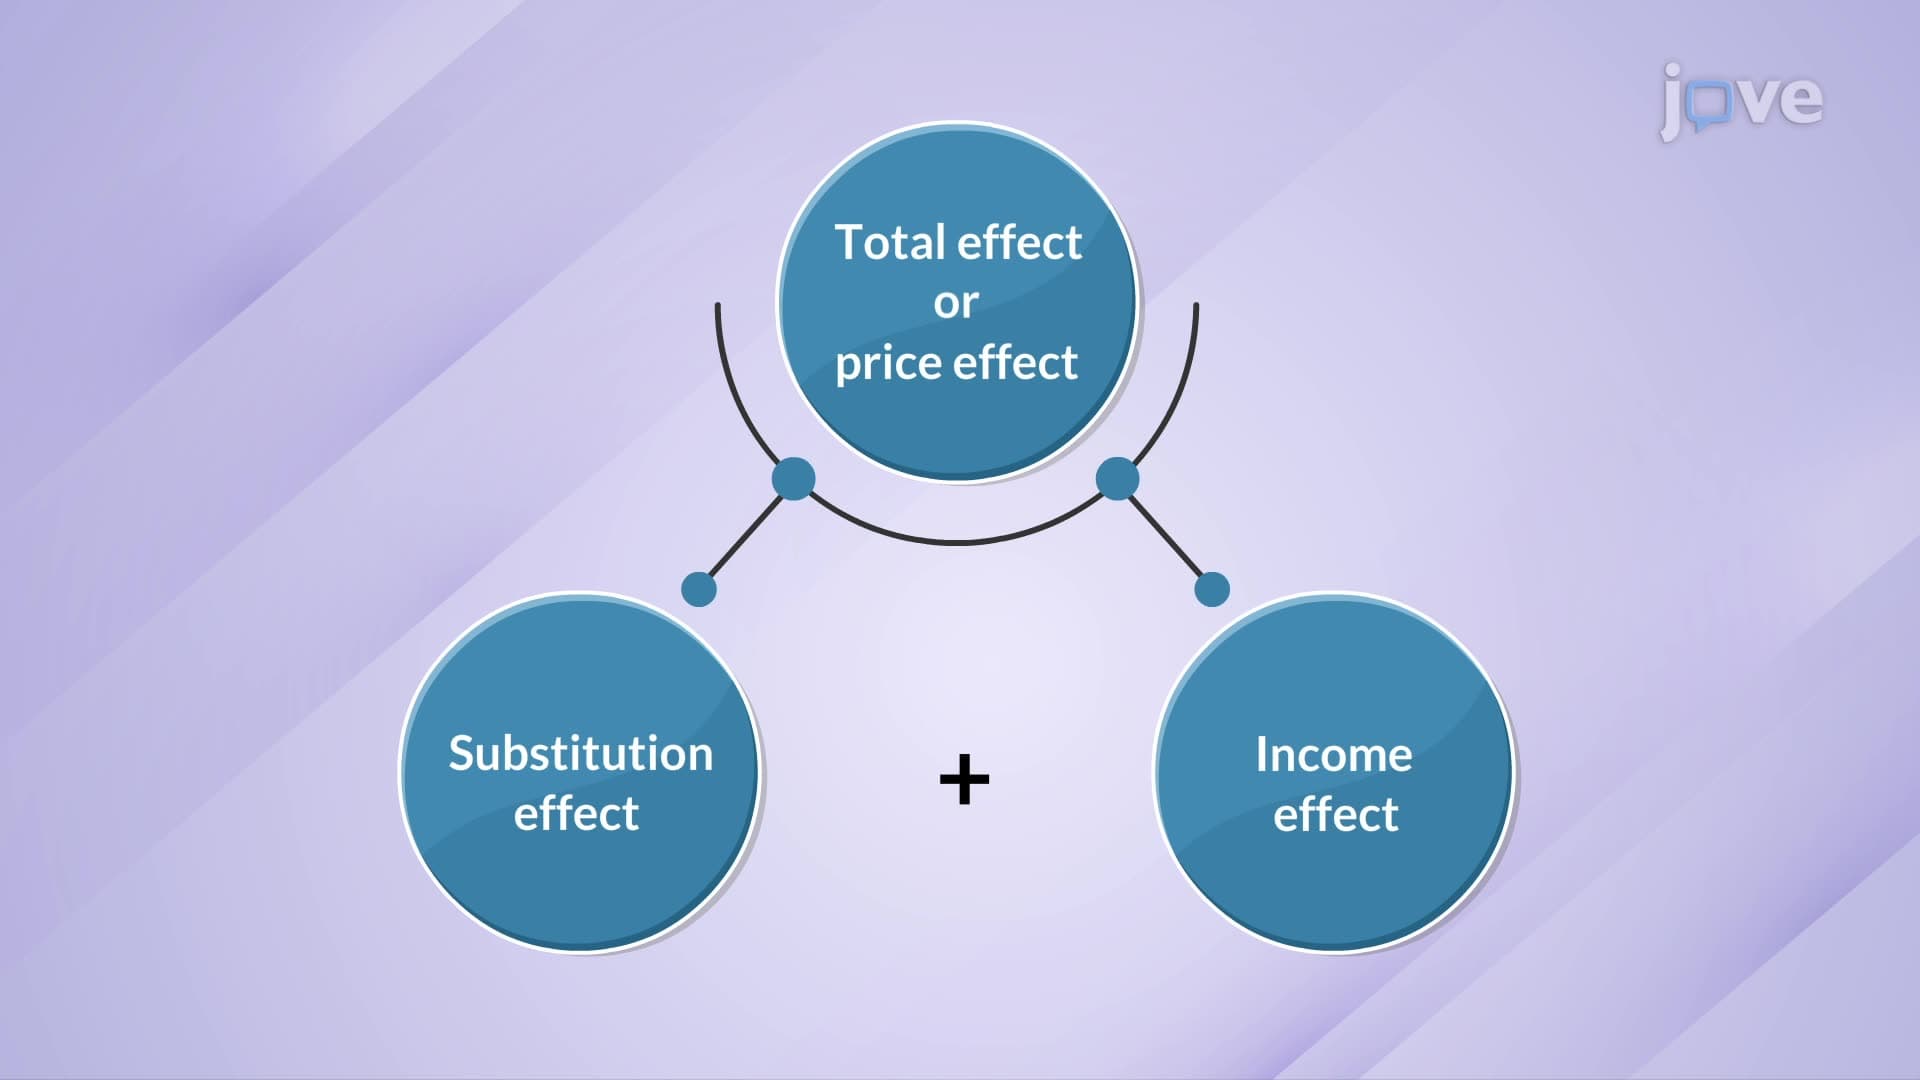
Progress to income consumption curves, substitution and income effects, and Engel curves for comprehensive consumer theory understanding. These concepts build directly on price consumption curve knowledge and frequently appear together on college economics exams. Understanding these relationships strengthens your overall microeconomic analysis skills.
College microeconomics courses use price consumption curves as foundational tools for advanced consumer theory, including welfare analysis and market efficiency studies. They're essential for understanding how policy changes affect consumer behavior and appear in intermediate microeconomics textbooks like those used at Harvard, MIT, and other leading economics programs.
Related Micro-courses