Loading subject page…
- Statistics
- Probability Distributions
- Applications of Normal Distribution
Micro-course: Probability Distributions
173,200 views
Learn key concepts and earn your certificate.








Applications of Normal Distribution

00:00
01:22
Video Summary: What are Applications of Normal Distribution
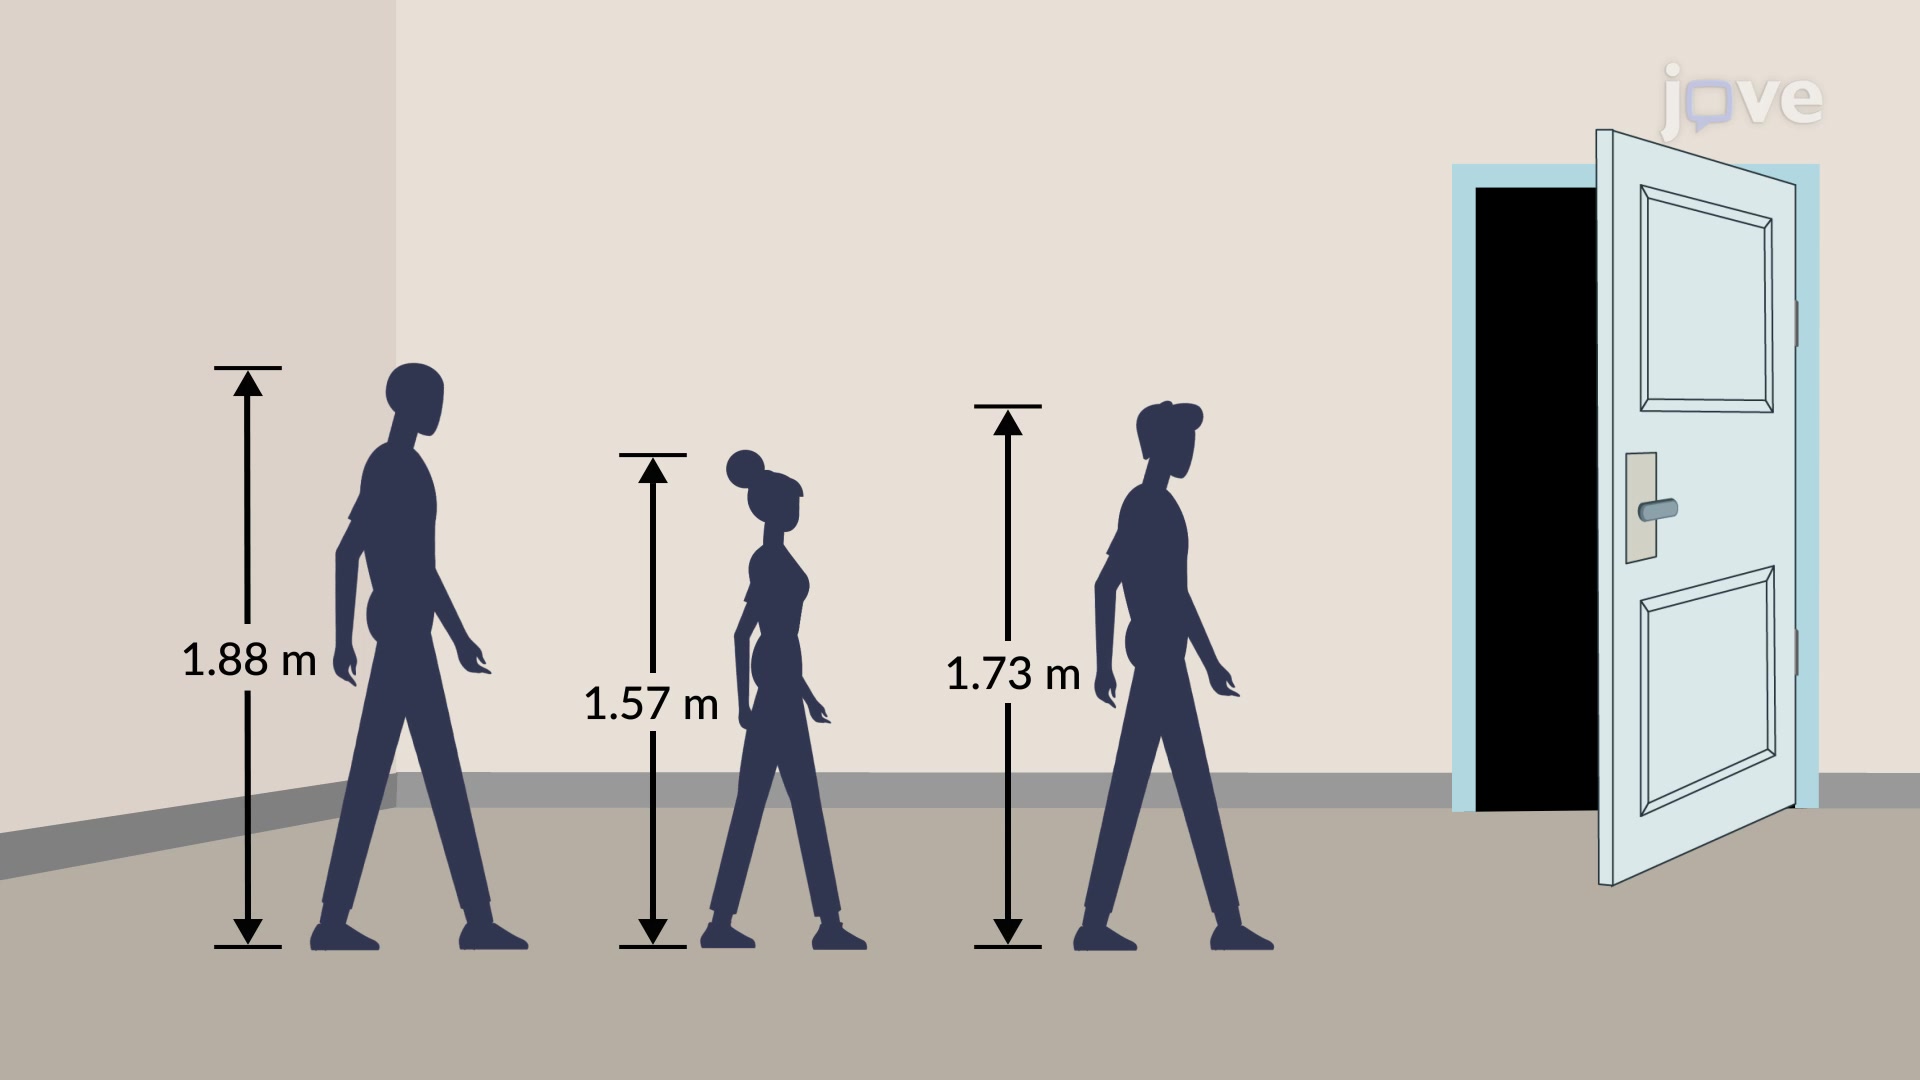
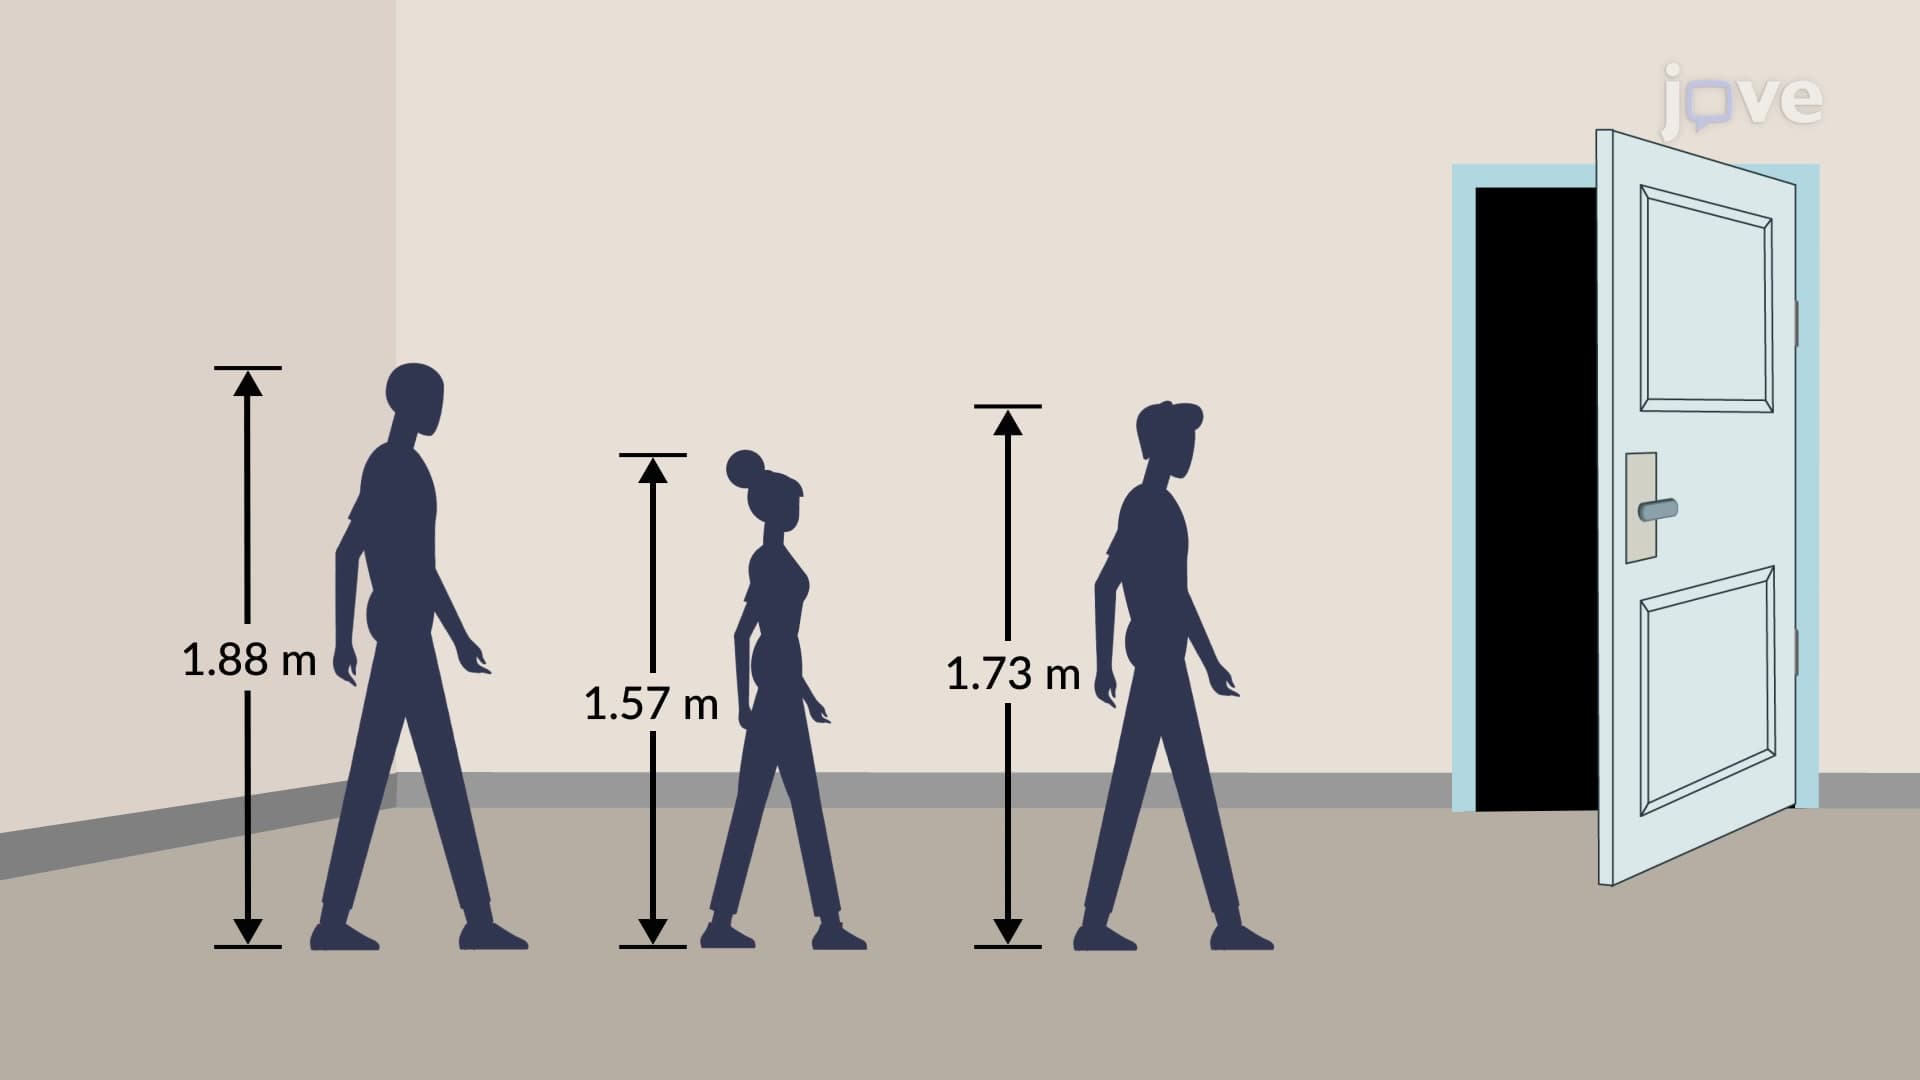
Ever wonder why airplane seats fit most passengers or why standardized test scores follow predictable patterns? Applications of normal distribution are everywhere, from determining optimal door heights in US buildings to analyzing SAT score distributions across millions of students. The normal distribution helps solve real-world problems by modeling how data clusters around an average value, like human height averaging 5'7" with predictable variation. Watch the full video on JoVE Coach to master this concept with expert-led visuals and step-by-step explanations.
- Understand what are applications of normal distribution and how they solve practical problems in engineering, medicine, and social sciences
- Identify real-world scenarios where normal distribution modeling provides valuable insights for decision-making
- Apply z-score calculations to determine probabilities and percentiles in normal distribution problems
- Analyze how mean and standard deviation parameters affect the shape and practical applications of normal curves
- Evaluate the appropriateness of normal distribution models for different types of data and situations
- Compare normal distribution applications across various fields, from quality control to psychological testing
- Recognize the connection between theoretical normal distribution concepts and standardized testing like SAT, ACT, and AP exams
- Explore how normal distribution principles guide design decisions in architecture, manufacturing, and public policy
Understanding What Are Applications of Normal Distribution
The applications of normal distribution extend far beyond academic exercises, forming the statistical backbone of countless real-world decisions. This bell-shaped probability distribution appears naturally when many small, independent factors influence an outcome, making it invaluable for modeling everything from manufacturing tolerances to biological measurements.
Engineering and Design Applications
In architectural design, normal distribution principles determine building specifications that accommodate the majority of users. For example, the Americans with Disabilities Act (ADA) guidelines for doorway widths (minimum 32 inches) consider the normal distribution of wheelchair dimensions and human body measurements. Similarly, automotive engineers use normal distribution data on driver height and reach to position steering wheels, pedals, and mirrors optimally.
Manufacturing industries rely heavily on types of applications of normal distribution for quality control. When producing pharmaceutical tablets, the weight distribution typically follows a normal curve. If tablets should weigh 500mg with a standard deviation of 5mg, manufacturers can calculate that 99.7% of tablets will fall within 485-515mg (three standard deviations), ensuring consistent dosing for patients.
Medical and Healthcare Applications
Healthcare professionals encounter normal distribution applications daily. Blood pressure readings, cholesterol levels, and medication dosages all follow approximately normal patterns in large populations. For instance, systolic blood pressure in healthy adults averages around 120 mmHg with a standard deviation of about 15 mmHg, helping physicians identify patients requiring intervention.
The applications of normal distribution overview in medical testing is particularly crucial. Laboratory reference ranges for blood tests are typically established using normal distribution principles, where "normal" values fall within two standard deviations of the population mean. This standardization ensures consistent interpretation across different hospitals and clinics nationwide.
Educational Assessment and Standardized Testing
Perhaps the most familiar application for students involves standardized testing. SAT scores are designed to follow a normal distribution with a mean of 1060 and standard deviation of about 217. This design allows colleges to interpret scores consistently-a student scoring 1277 (one standard deviation above the mean) performed better than approximately 84% of test-takers.
AP exam scores, while reported on a 1-5 scale, are initially calculated using normal distribution principles to ensure consistent difficulty across different test administrations. Understanding these applications of normal distribution basics helps students contextualize their performance and set realistic academic goals.
Frequently Asked Questions
Normal distribution applications appear in architecture (door heights), manufacturing (product quality control), finance (investment risk assessment), and healthcare (establishing medical reference ranges). These applications help professionals make data-driven decisions that affect millions of Americans daily, from designing safer buildings to ensuring consistent medication dosing.
AP Statistics commonly tests normal distribution through quality control scenarios, standardized test score analysis, and biological measurement problems. Students should master z-score calculations, probability determinations, and interpreting normal distribution graphs. Practice problems often involve manufacturing tolerances, exam score distributions, and population health statistics.
MCAT questions frequently test normal distribution concepts in psychology and sociology sections, particularly regarding population data and research methodology. Understanding how medical research uses normal distributions for establishing treatment efficacy and population health baselines strengthens both quantitative reasoning and scientific inquiry skills essential for medical school success.
College statistics courses emphasize normal distribution because it underlies many advanced statistical methods, including hypothesis testing, confidence intervals, and regression analysis. Mastering these applications provides the foundation for understanding research methodology across disciplines, from business analytics to psychological research, making it essential for most undergraduate majors.
McDonald's uses normal distribution to optimize food preparation timing and staffing levels based on customer arrival patterns. By analyzing historical data showing lunch rushes follow predictable patterns (typically peaking around 12:30 PM with known standard deviation), managers can schedule appropriate staff levels and prepare food quantities that minimize waste while ensuring customer satisfaction.
Basic algebra and percentage calculations are sufficient for most normal distribution applications. The key skills involve reading z-score tables, calculating means and standard deviations, and interpreting probability values. Students comfortable with high school algebra can successfully master these concepts with focused practice on real-world application problems.
Create a formula sheet with z-score calculations and probability relationships, then practice diverse application problems from different fields (medical, engineering, business). Focus on translating word problems into statistical notation, identifying given parameters, and interpreting results in context. Regular practice with graphing calculator functions for normal distribution calculations builds both speed and accuracy.
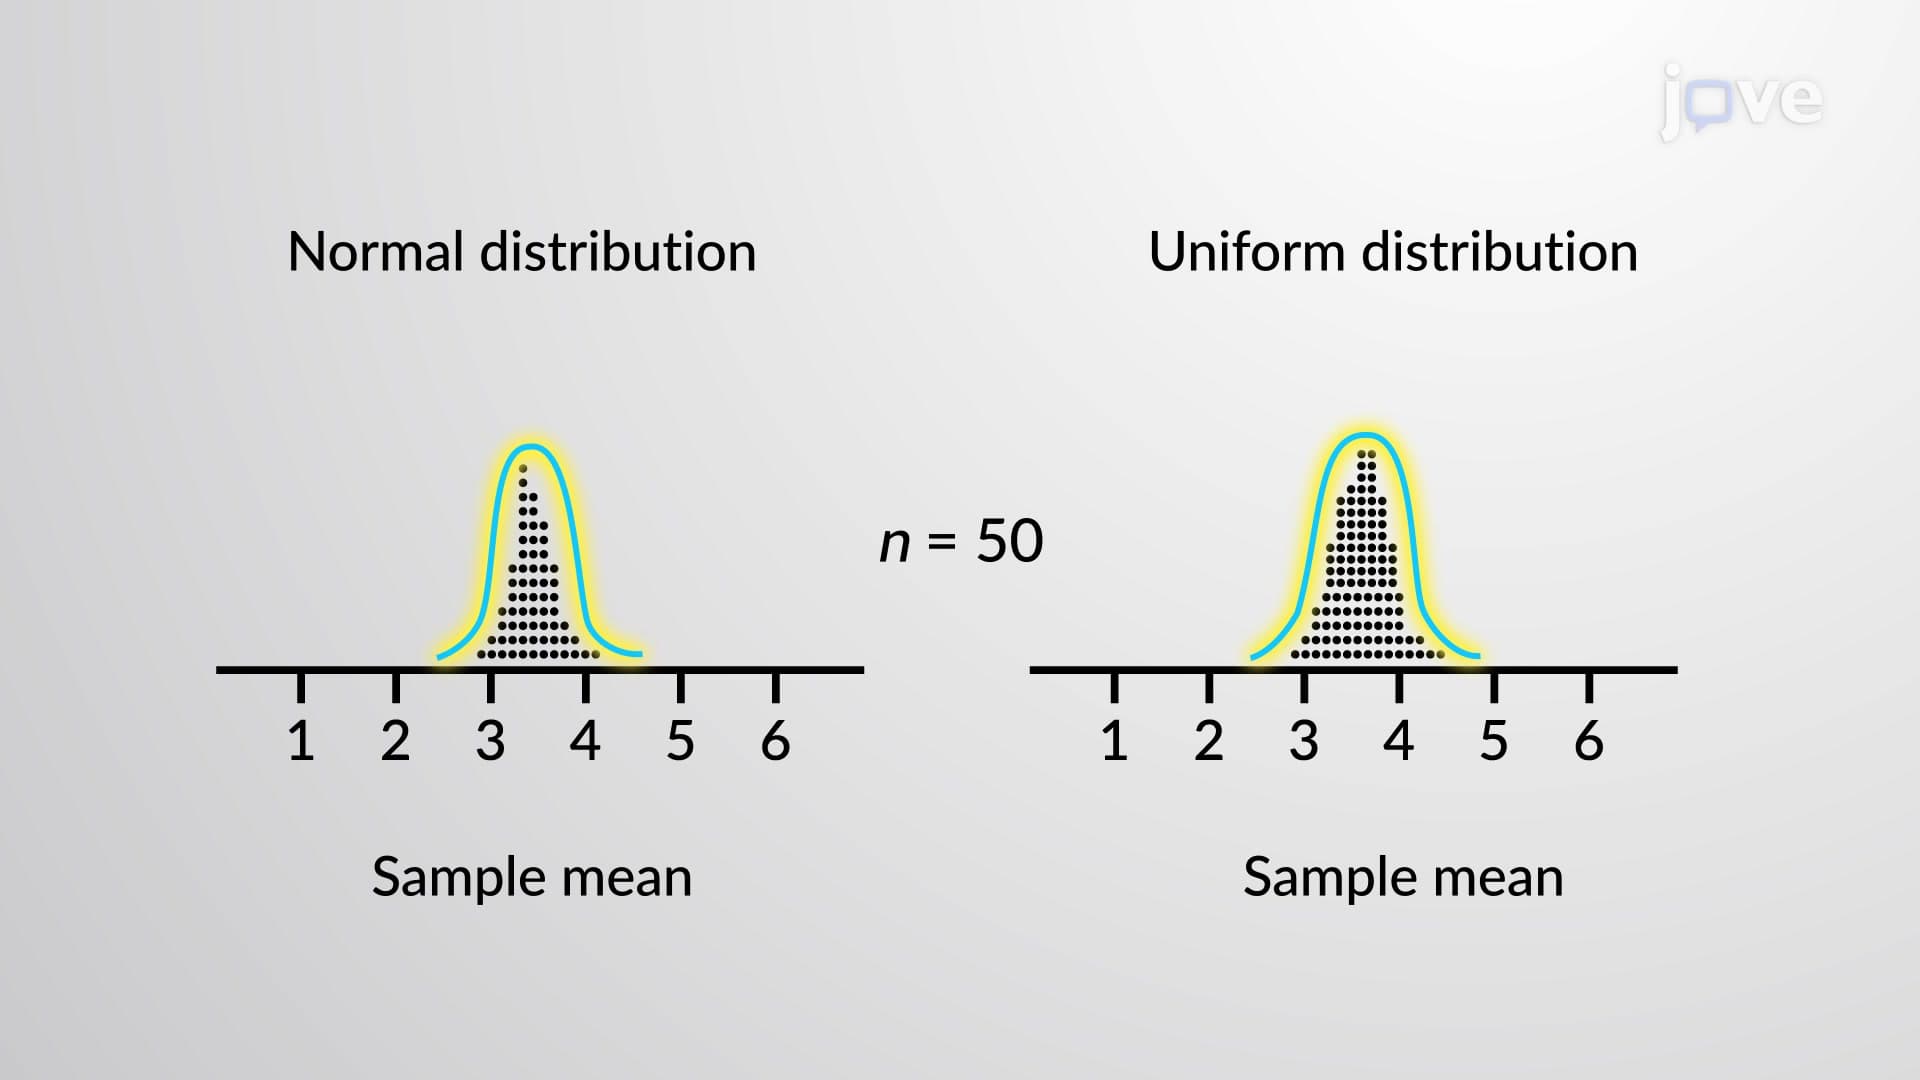
Consider studying sampling distributions, central limit theorem applications, and confidence interval construction. These topics build directly on normal distribution foundations and appear frequently in advanced statistics courses, research methodology, and professional certification exams across multiple fields including healthcare, business, and social sciences.
Related Micro-courses