Loading subject page…

- Statistics
- Understanding Statistics
- Interval Level of Measurement
Micro-course: Understanding Statistics
340,618 views
Learn key concepts and earn your certificate.










Interval Level of Measurement

00:00
00:55
Video Summary: What Is Interval Level of Measurement
Ever wondered why a temperature of 0°F doesn't mean "no temperature exists"? The interval level of measurement explains this fascinating statistical concept where data can be ordered and differences between values are meaningful, but there's no true zero point. Unlike nominal or ordinal data, interval-level data allows us to calculate meaningful differences-such as understanding that the temperature difference between 70°F and 80°F in Phoenix equals the difference between 30°F and 40°F in Minnesota. Watch the full video on JoVE Coach to master this concept with expert-led visuals and step-by-step explanations.
- Understand what is interval level of measurement and how it differs from nominal, ordinal, and ratio levels of measurement
- Identify interval-level data by recognizing its two key characteristics: meaningful order and equal intervals between values
- Analyze why interval data lacks a true zero point using temperature scales and standardized test scores as examples
- Compare interval level of measurement with other measurement levels to determine appropriate statistical analyses
- Evaluate real-world datasets to classify whether they represent interval-level measurements
- Apply interval level of measurement concepts to solve statistics problems on standardized tests and college exams
- Recognize common examples of interval data in psychology, education, and meteorology
- Explore appropriate statistical techniques (mean, standard deviation, correlation) for interval-level data analysis
Understanding Interval Level of Measurement Fundamentals
The interval level of measurement represents the third tier in Stevens' hierarchy of measurement scales, positioned between ordinal and ratio levels. This measurement type captures data where both the order of values matters and the distances between consecutive points remain consistent and meaningful. Unlike ordinal data, where we only know relative rankings, interval data allows us to quantify exactly how much difference exists between any two measurements.
Key Characteristics of Interval Level Data
Two defining features distinguish interval level of measurement from other scales. First, the data maintains a logical order-values can be arranged from lowest to highest in a meaningful sequence. Second, equal intervals between numbers represent equal differences in the measured attribute. For instance, the difference between SAT scores of 1200 and 1300 represents the same magnitude of improvement as the difference between 1300 and 1400. However, interval data lacks a true zero point, meaning zero doesn't indicate the complete absence of the measured characteristic.
Real-World Applications in American Education and Testing
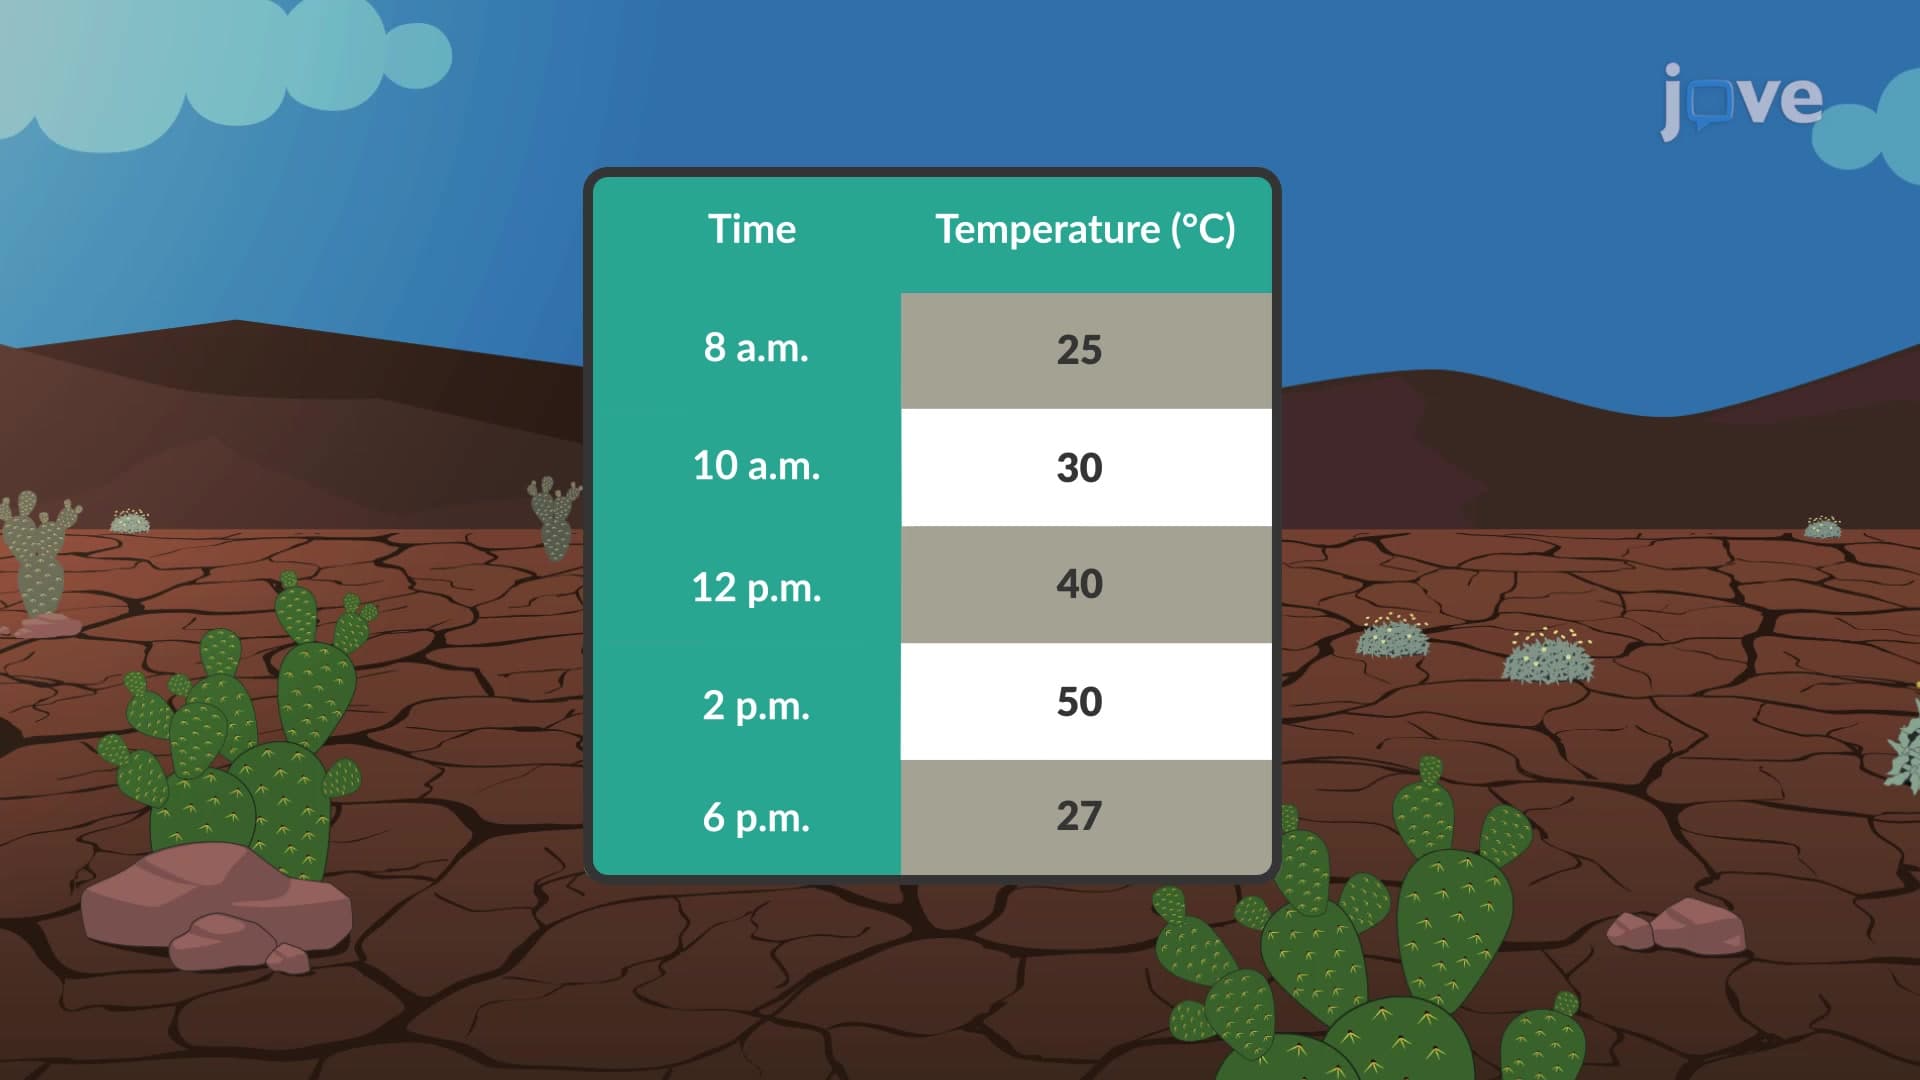
Interval level of measurement appears frequently in U.S. educational assessment systems. Standardized test scores like the SAT, ACT, and GRE utilize interval scales. A student scoring 0 on a section doesn't mean they possess zero knowledge-they simply answered no questions correctly under that specific testing format. Similarly, IQ scores represent interval data where the average is set at 100, but a score of 0 wouldn't mean "no intelligence." Temperature measurements in Fahrenheit or Celsius also exemplify interval data, as 0°F doesn't represent the absence of heat-it's simply a reference point on the scale.
Statistical Analysis and Academic Applications
Students encountering interval level of measurement in AP Statistics, college research methods, or MCAT preparation should understand its analytical implications. Interval data supports meaningful mathematical operations like addition and subtraction, enabling calculation of means and standard deviations. However, ratios become meaningless without a true zero-you can't say 80°F is "twice as hot" as 40°F. This concept frequently appears on standardized tests where students must identify appropriate statistical techniques based on measurement levels, making it crucial for academic success in statistics and research-based courses.
Frequently Asked Questions
Interval level of measurement describes data that can be ordered and has equal spacing between values, but lacks a true zero point. Think of temperature in Fahrenheit-you can order temperatures from cold to hot, and the difference between 70°F and 80°F equals the difference between 30°F and 40°F. However, 0°F doesn't mean "no temperature exists."
These exams frequently test your ability to identify interval data and choose appropriate statistical analyses. You might see questions asking you to classify SAT scores, temperature readings, or pH levels, then select whether to use means, medians, or specific correlation techniques. Understanding that interval data allows mean calculations but not meaningful ratios is crucial for exam success.
Students often confuse interval and ratio data by focusing only on equal intervals while ignoring the zero point. For example, they might incorrectly classify Kelvin temperature as interval data when it's actually ratio data because 0 Kelvin represents absolute zero-the complete absence of molecular motion.
Grade Point Averages (GPAs) on a 4.0 scale represent interval data. The difference between a 3.0 and 3.5 GPA equals the difference between 3.5 and 4.0 in terms of academic performance measurement. However, a 0.0 GPA doesn't mean "zero academic ability"-it indicates failing grades under that specific grading system.
Not at all! Most students already work with interval data daily through temperature readings and test scores. The key is recognizing the pattern: ordered data with equal intervals but no meaningful zero. Start with familiar examples like Fahrenheit temperatures or standardized test scores, then apply the same logic to new datasets.
Create comparison charts showing all four measurement levels with real examples from your daily life. Practice identifying interval data by asking two questions: "Can I order these values?" and "Does zero mean complete absence?" If yes to the first and no to the second, you likely have interval data.
Interval data supports means, standard deviations, correlations, and most parametric statistical tests like t-tests and ANOVA. You can add, subtract, and find averages meaningfully. However, avoid ratios and percentages that imply multiplication or division, since the absence of a true zero makes these operations misleading.
Study ratio level of measurement to understand how a true zero point changes analytical possibilities, then explore how measurement levels determine appropriate statistical tests. Understanding when to use parametric versus non-parametric analyses based on your data's measurement level will strengthen your statistical reasoning skills significantly.
Related Micro-courses

15 Concepts
13 Concepts
11 Concepts