Loading subject page…


340,619 views

Video Summary: What Is Ordinal Level of Measurement
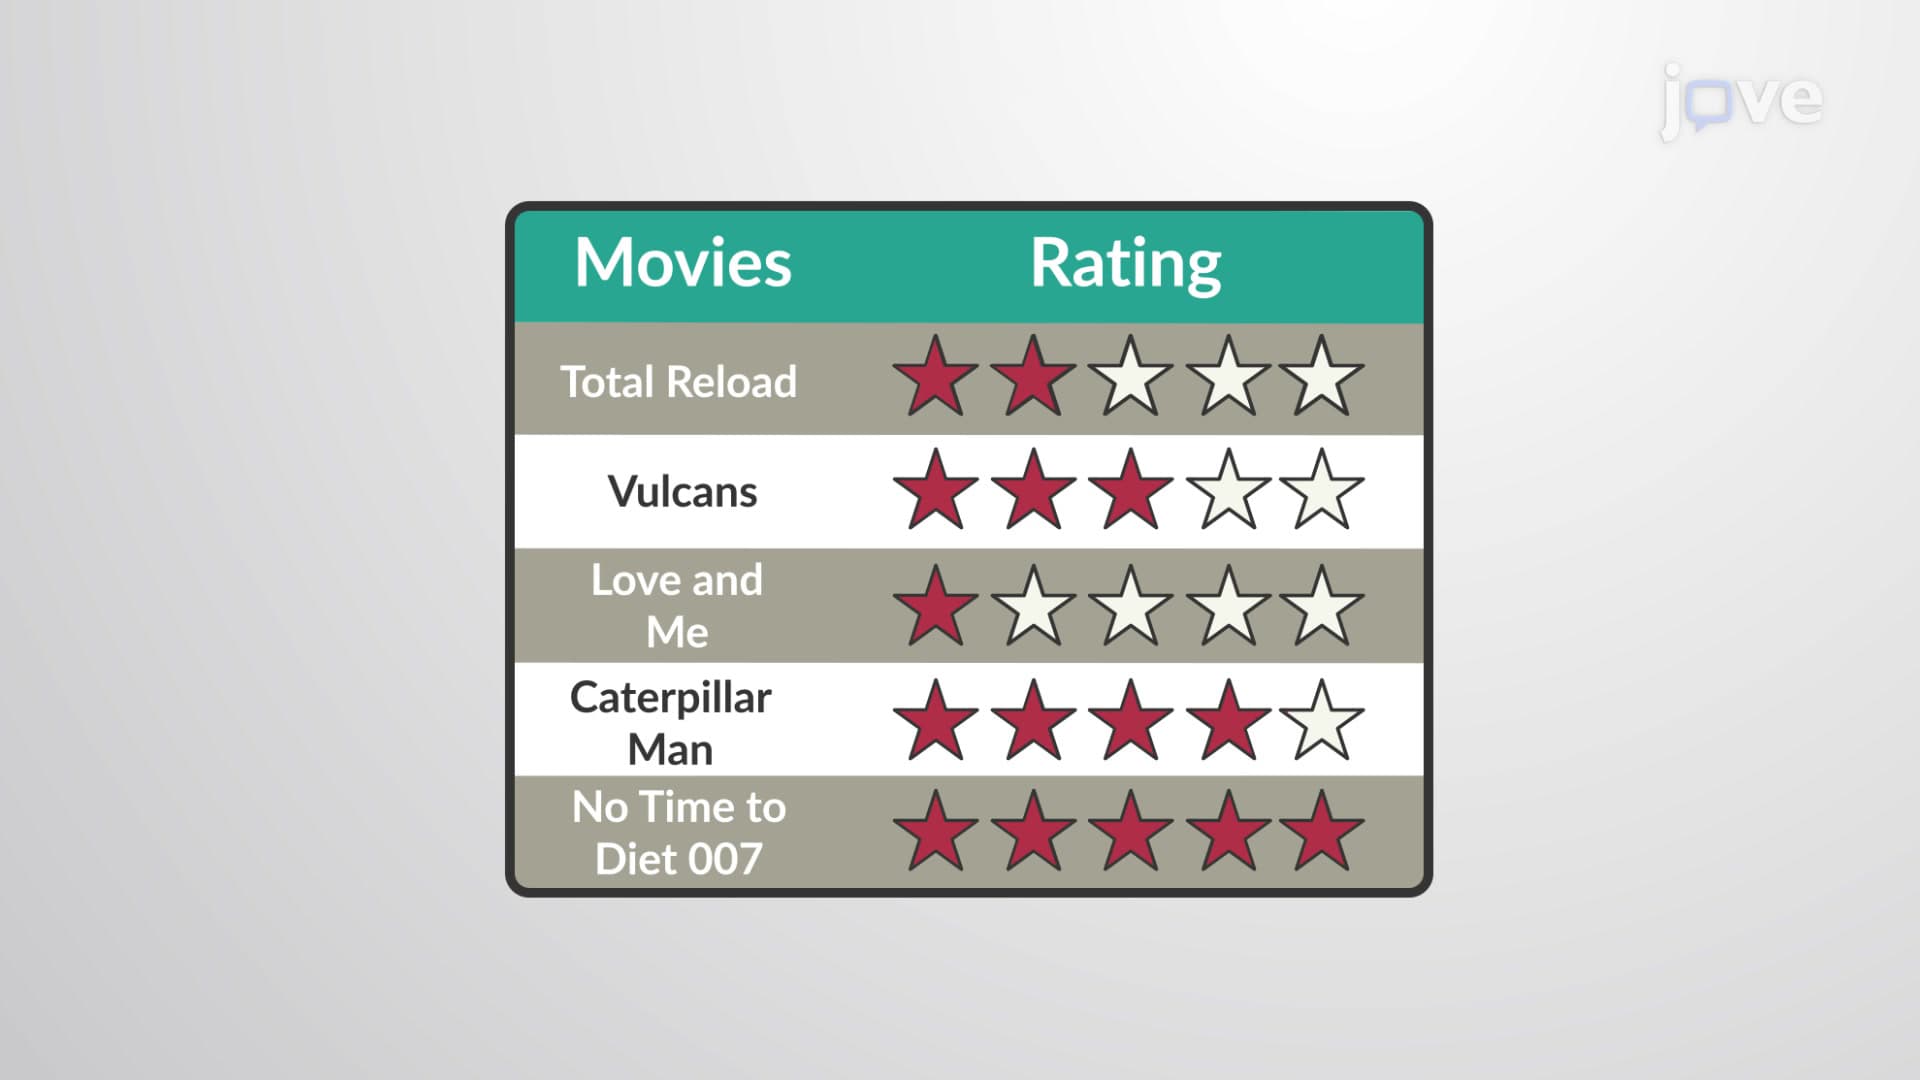
Why do Netflix ratings tell you which movies are better but not by how much? The ordinal level of measurement creates ranked data where order matters, but the gaps between values don't provide meaningful information. Consider how US college rankings place Harvard above other schools-we know the order, but the numerical difference doesn't quantify actual quality gaps. This measurement level appears everywhere from customer satisfaction surveys to medical pain scales used in American hospitals. Watch the full video on JoVE Coach to master this concept with expert-led visuals and step-by-step explanations.
The ordinal level of measurement represents data that can be ranked or ordered, but where the intervals between consecutive values lack consistent meaning. Unlike nominal data that simply categorizes without order, ordinal data establishes a clear hierarchy while maintaining the limitation that mathematical differences between ranks don't translate to real-world significance.
Ordinal measurement possesses three key characteristics that distinguish it from other measurement levels. First, data points can be arranged in meaningful order-think of how US News ranks colleges from first to hundredth position. Second, we can determine which values are greater or lesser, such as knowing that "strongly agree" represents a stronger opinion than "agree" on survey scales. Third, the intervals between consecutive ranks remain mathematically meaningless-the performance gap between the #1 and #2 ranked football teams isn't necessarily equal to the gap between #5 and #6.
This measurement level frequently appears in American standardized testing contexts. The SAT Subject Test scores create ordinal data when students receive percentile rankings, and medical school applicants encounter ordinal scales in MCAT preparation materials when rating their confidence levels from "not confident" to "extremely confident."
Healthcare professionals across US hospitals extensively use ordinal scales. The Glasgow Coma Scale rates patient consciousness from 3 to 15, where higher numbers indicate better neurological function, but the difference between scores 10 and 11 doesn't represent the same improvement magnitude as between 14 and 15. Similarly, the Likert scale dominates American market research, with responses ranging from "strongly disagree" to "strongly agree."
Educational assessment frequently employs ordinal measurement. When AP exam graders assign scores of 1 through 5, they create ordinal data where 5 exceeds 4, but the learning difference between these scores varies significantly across different point ranges. College admission committees use ordinal rankings when evaluating applications, understanding that their "first choice" candidate isn't necessarily twice as qualified as their "second choice."
Ordinal data restricts statistical analysis options compared to interval or ratio measurements. Researchers can calculate median values and use non-parametric tests like the Mann-Whitney U test, commonly taught in undergraduate statistics courses. However, calculating meaningful averages or using standard parametric tests becomes inappropriate because ordinal intervals lack uniform spacing.
Understanding these limitations proves crucial for students preparing for advanced placement statistics exams or college research methods courses, where proper measurement level identification determines appropriate analytical approaches.
Related Micro-courses