Loading subject page…


340,619 views


Video Summary: What Is Ratio Level of Measurement
Did you know that when a Starbucks grande coffee costs $5 and a venti costs $6, you're experiencing the ratio level of measurement in action? The ratio level of measurement represents the most sophisticated form of data classification, featuring both meaningful differences between values and a true zero point that indicates complete absence. Unlike other measurement levels, ratio data allows us to make statements like "Product A costs twice as much as Product B" with mathematical precision. This concept appears frequently in statistics courses, market research, and standardized testing scenarios across American high schools and colleges. Watch the full video on JoVE Coach to master this concept with expert-led visuals and step-by-step explanations.
The ratio level of measurement represents the pinnacle of data sophistication in statistical analysis, combining all properties of lower measurement levels while adding the crucial element of a true zero point. This measurement type allows researchers to make the most comprehensive comparisons and perform the widest range of mathematical operations on their data.
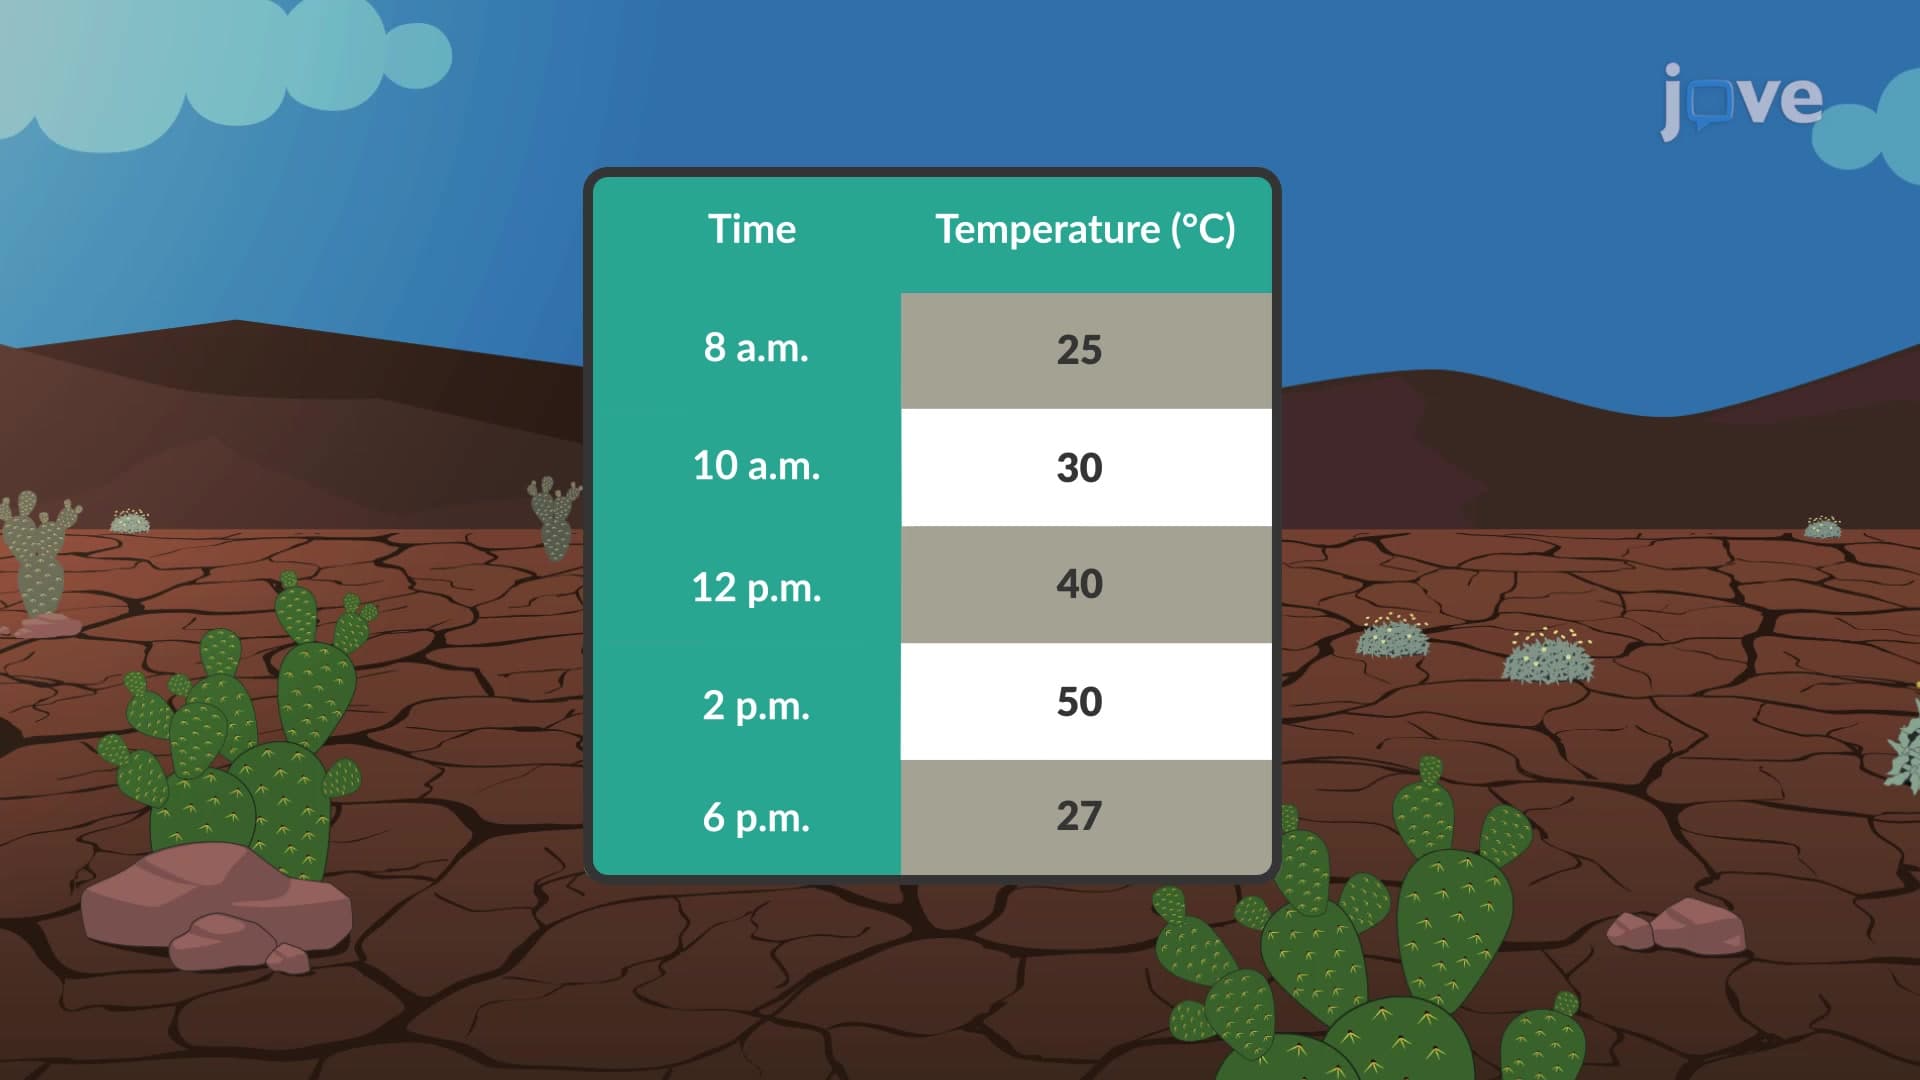
What distinguishes ratio level measurement from its interval counterpart is the presence of an absolute zero-a point that represents the complete absence of the measured attribute. Consider temperature measurements: while Celsius and Fahrenheit scales are interval (since 0° doesn't mean "no temperature"), Kelvin operates at the ratio level because 0K represents absolute zero, the complete absence of molecular motion.
Ratio level data possesses four fundamental properties that build upon each other hierarchically. First, it maintains identity-each value represents a distinct quantity. Second, it demonstrates magnitude-values can be ordered from least to greatest. Third, it features equal intervals-the difference between consecutive units remains consistent throughout the scale. Finally, and most importantly, it contains a true zero point that represents the complete absence of the measured variable.
This true zero enables meaningful ratio statements. When analyzing SAT scores (which are interval level), we cannot say one student scored "twice as well" as another. However, with ratio data like income, we can definitively state that someone earning $60,000 makes exactly twice as much as someone earning $30,000.
Ratio level measurement appears extensively throughout American academic and professional environments. In AP Statistics courses, students frequently encounter ratio data when analyzing economic indicators, population demographics, and scientific measurements. College entrance exam preparation often includes ratio-level examples such as test duration (measured in minutes with a true zero), student heights and weights, and family income levels.
Healthcare professionals regularly work with ratio data in clinical settings. A patient's blood pressure reading of 120/80 mmHg represents ratio level measurement-zero pressure would indicate no blood flow. Similarly, medication dosages, body temperatures measured in Kelvin, and treatment duration all exemplify ratio level measurement in medical practice.
Business applications abound in American commerce. Retail sales figures, inventory quantities, market share percentages, and profit margins all operate at the ratio level. When Amazon reports quarterly revenue growth, analysts can make meaningful multiplicative comparisons because revenue has a true zero point-no sales would equal zero revenue.
The ratio level of measurement unlocks the full spectrum of statistical operations. Unlike nominal or ordinal data, ratio measurements support all four basic arithmetic operations: addition, subtraction, multiplication, and division. This mathematical flexibility enables sophisticated analyses including geometric means, coefficients of variation, and proportional comparisons.
For students preparing for standardized tests like the MCAT or college statistics exams, understanding these operational capabilities proves crucial. Ratio data supports the most powerful statistical tests and allows researchers to draw the strongest conclusions about relationships between variables.
Related Micro-courses