Loading video…


 15 Concepts
 61.9K views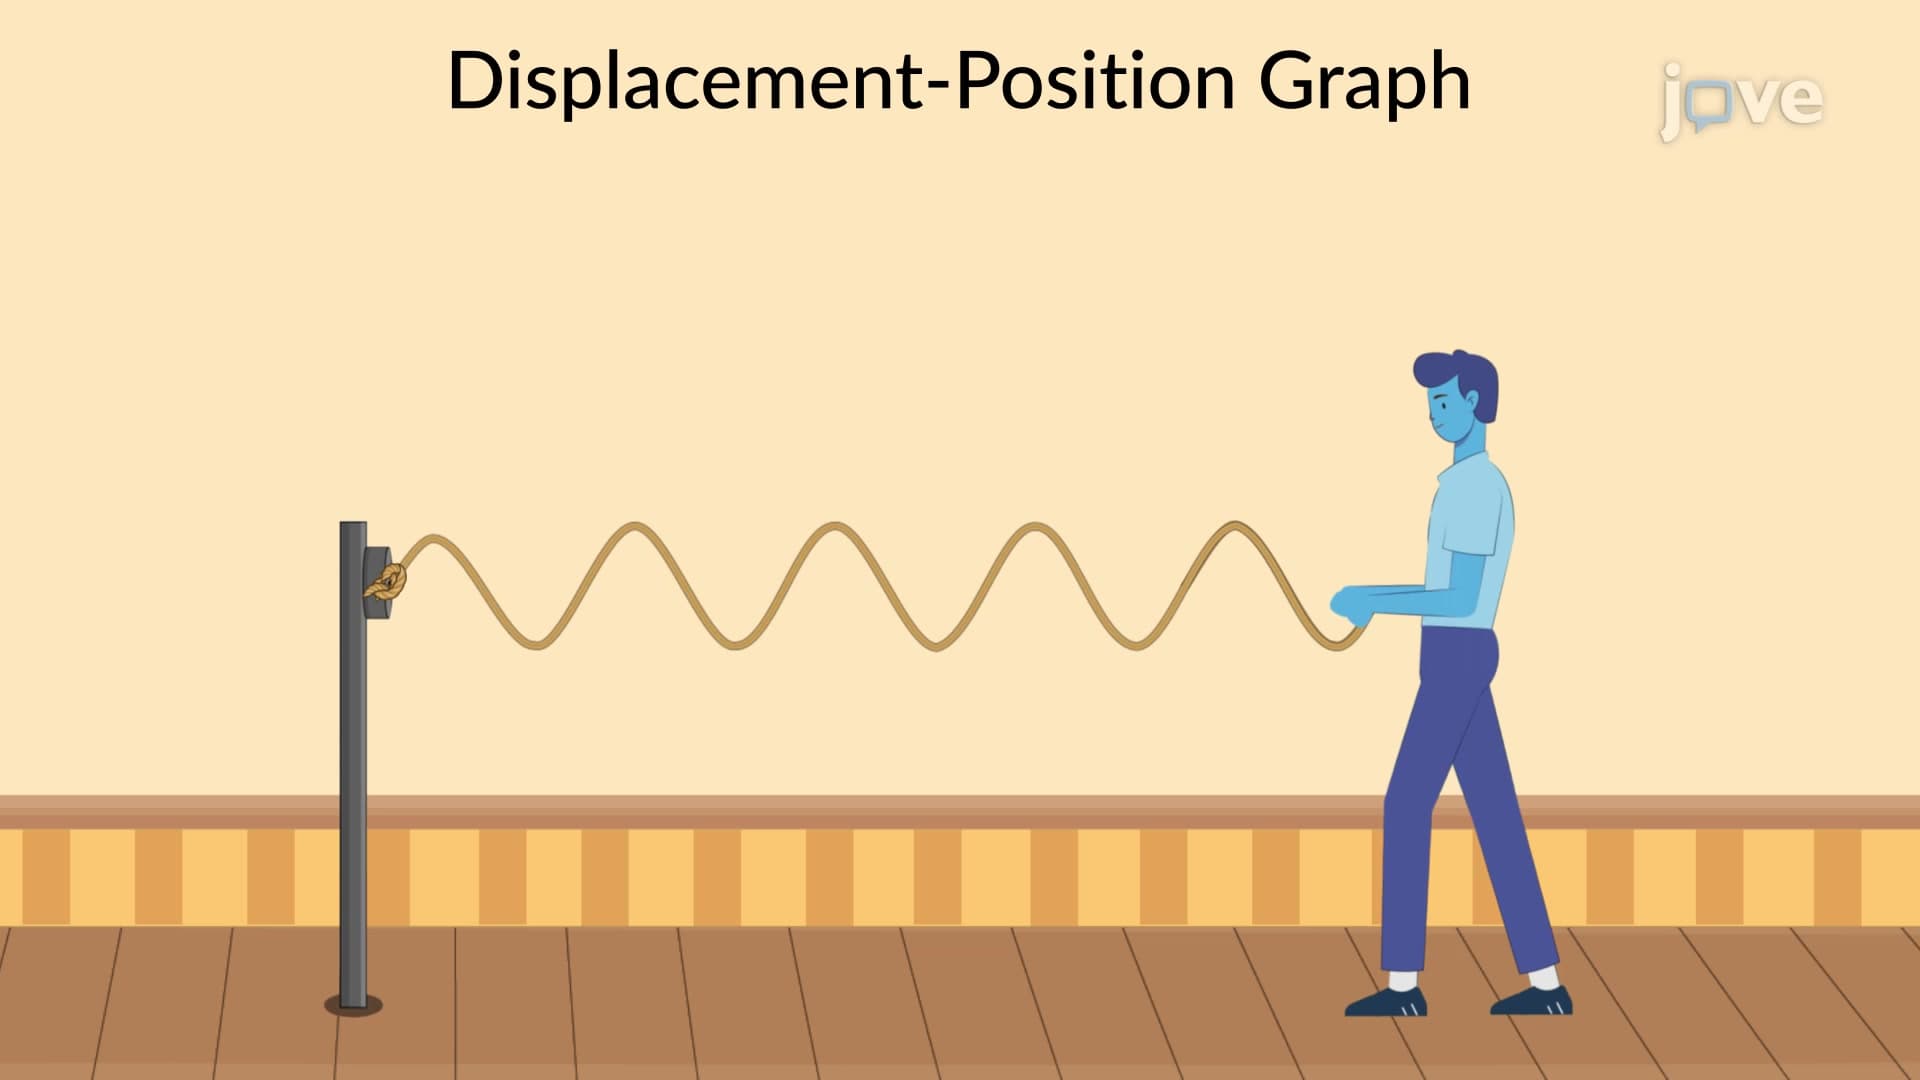

Video Summary: What Is Graphing the Wave Function
Did you know that when a guitar string vibrates, its shape at any moment can be captured as a mathematical graph? Graphing the wave function reveals how particles move in waves, whether it's sound waves traveling through concert halls or seismic waves detected by US Geological Survey monitoring stations. This fundamental physics concept shows how displacement varies with both position and time, allowing scientists to determine crucial wave properties like wavelength and period. What is Graphing The Wave Function becomes clear through visual representations that transform abstract mathematics into understandable patterns. Watch the full video on JoVE Coach to master this concept with expert-led visuals and step-by-step explanations.
Graphing the wave function transforms abstract wave mathematics into visual representations that reveal how waves behave in real systems. When physicists study phenomena like the vibrations in suspension bridges during earthquakes or the sound waves in Carnegie Hall's acoustics, they rely on these graphical tools to understand wave motion. The wave function describes how particles in a medium are displaced from their equilibrium positions as waves pass through.
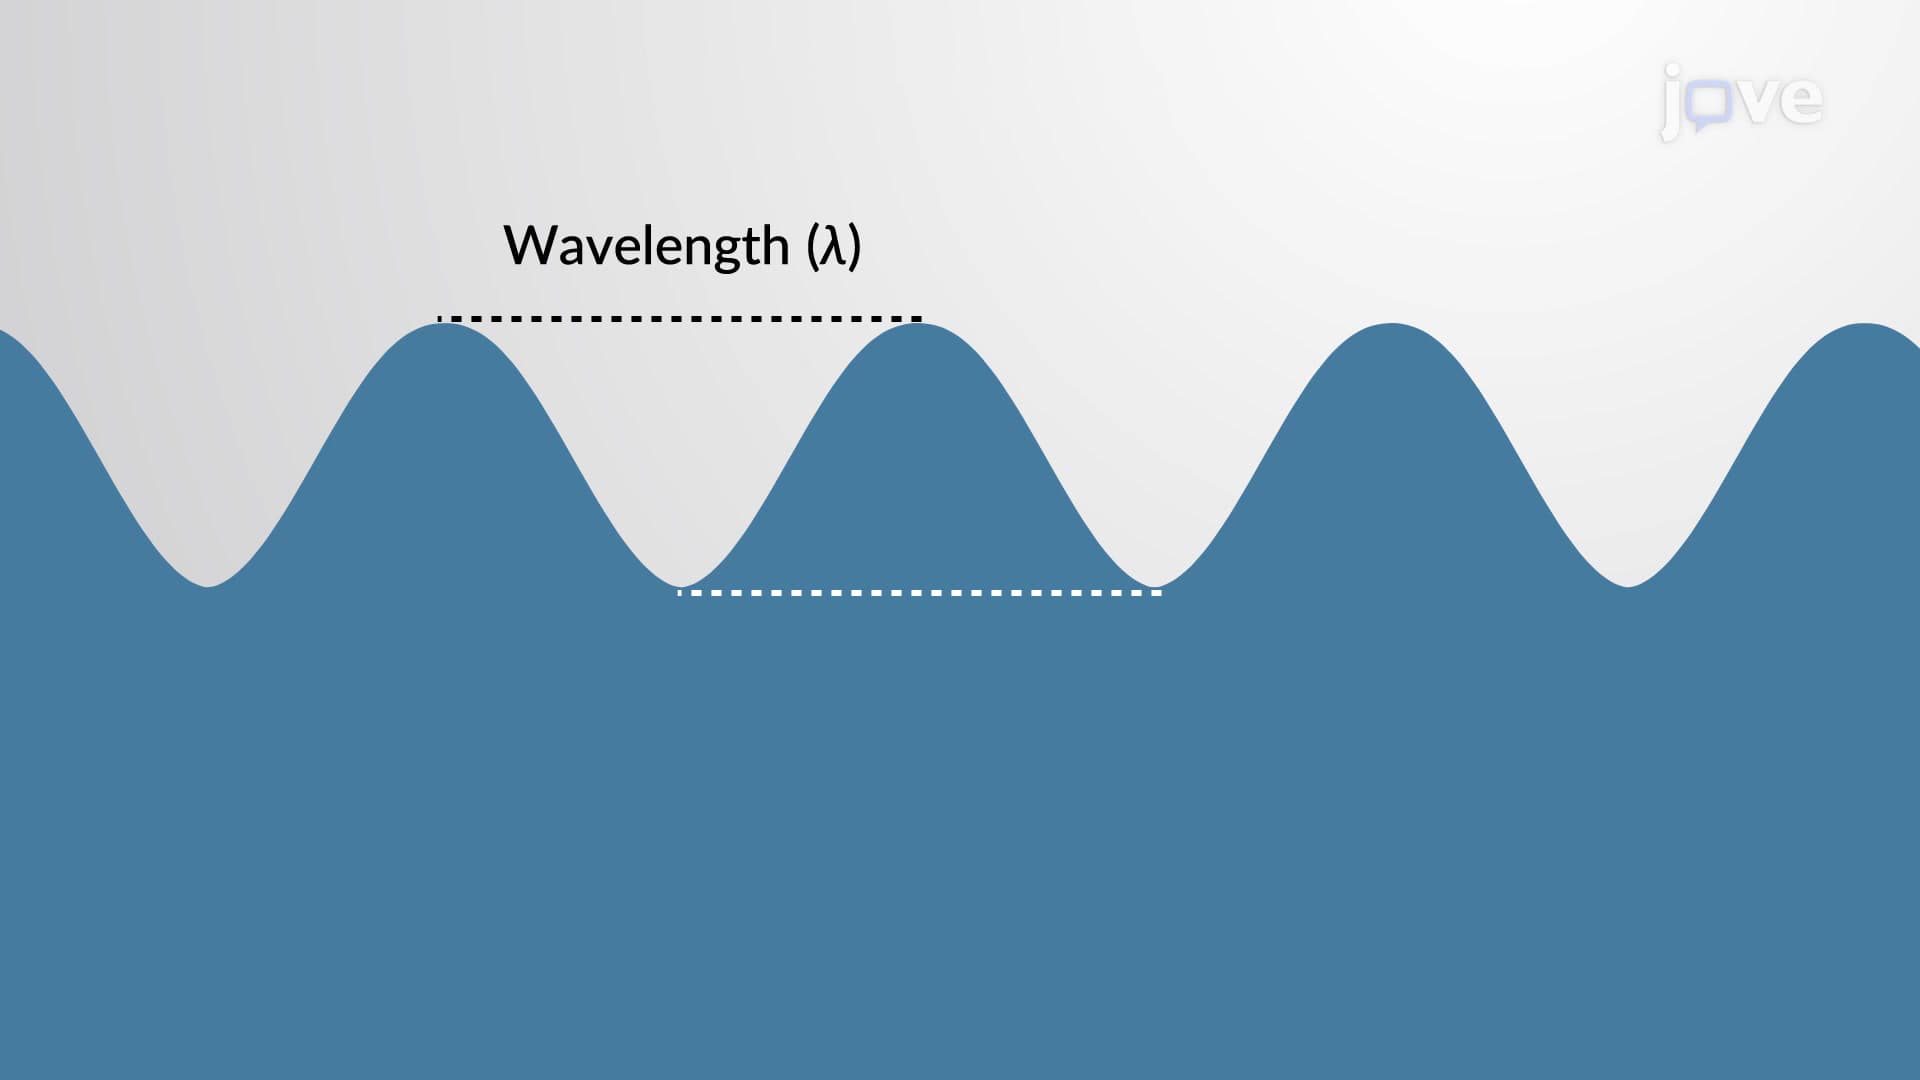
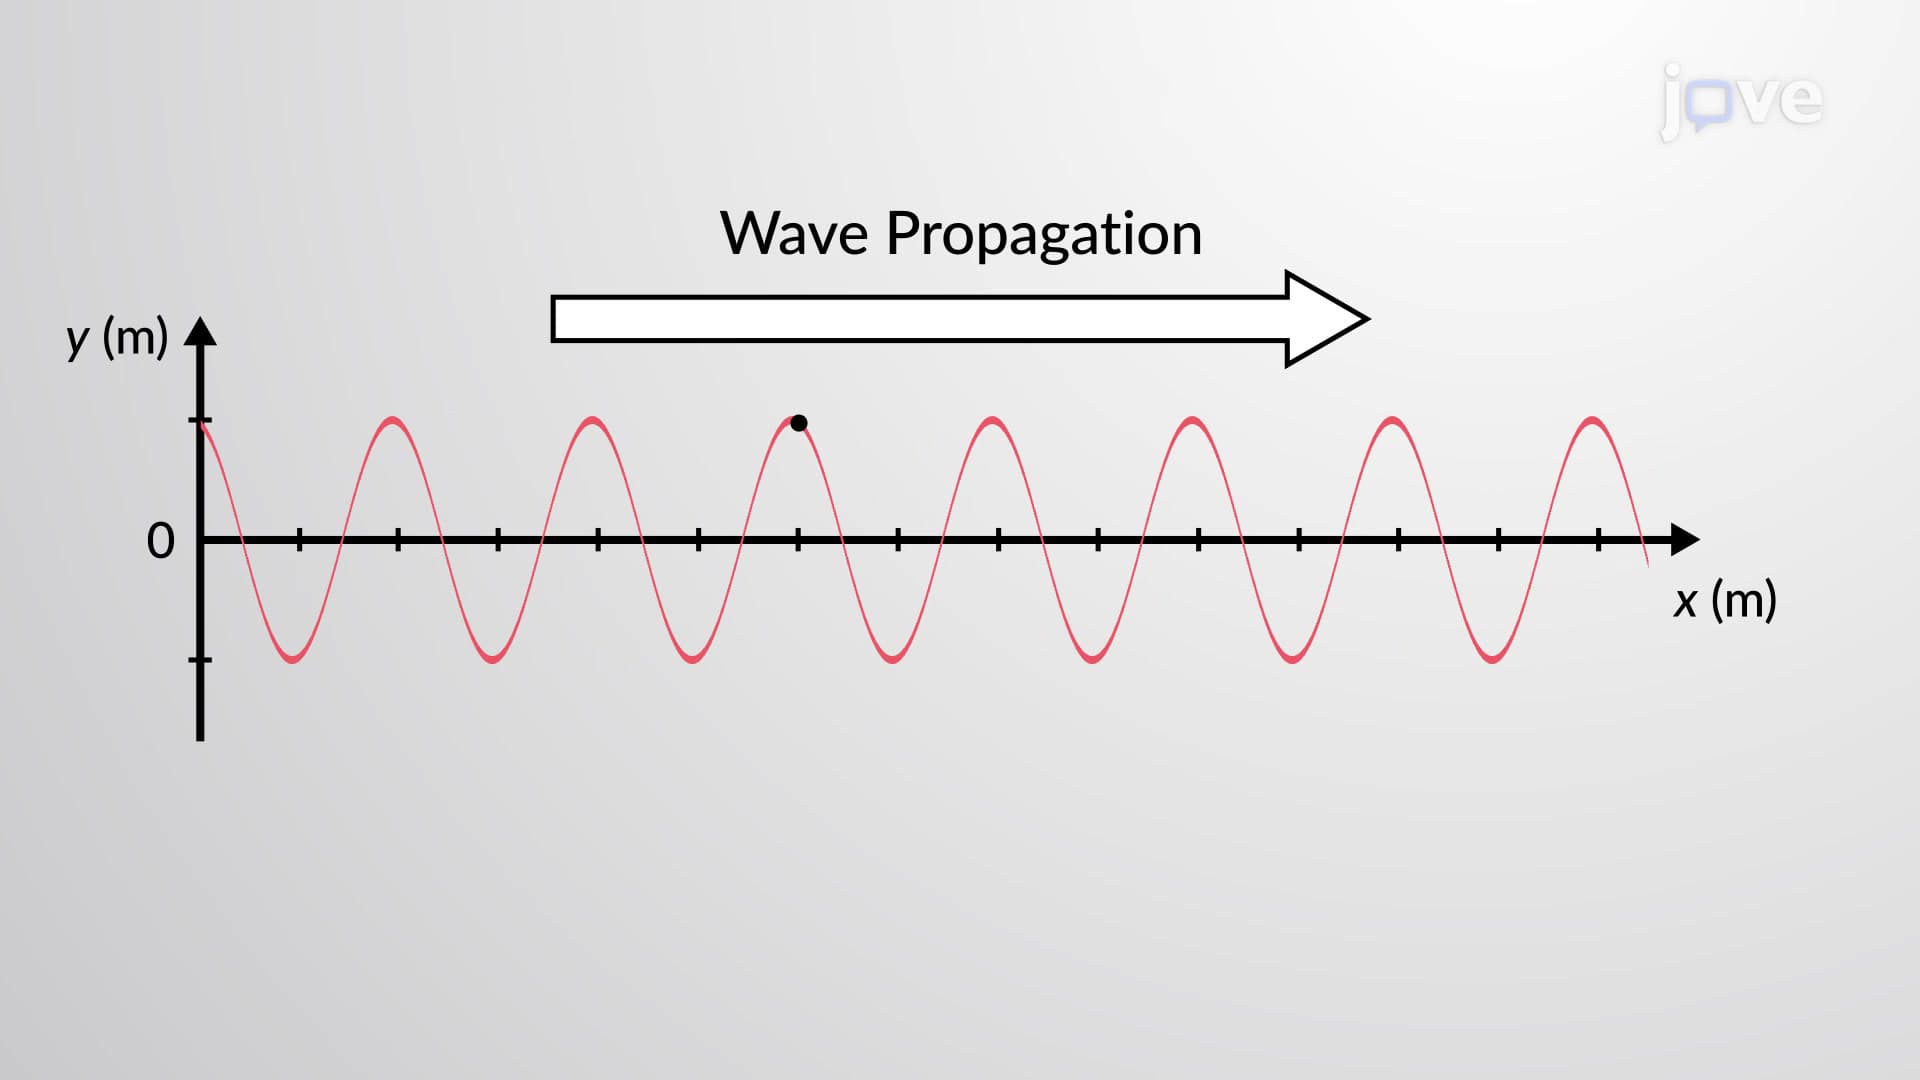
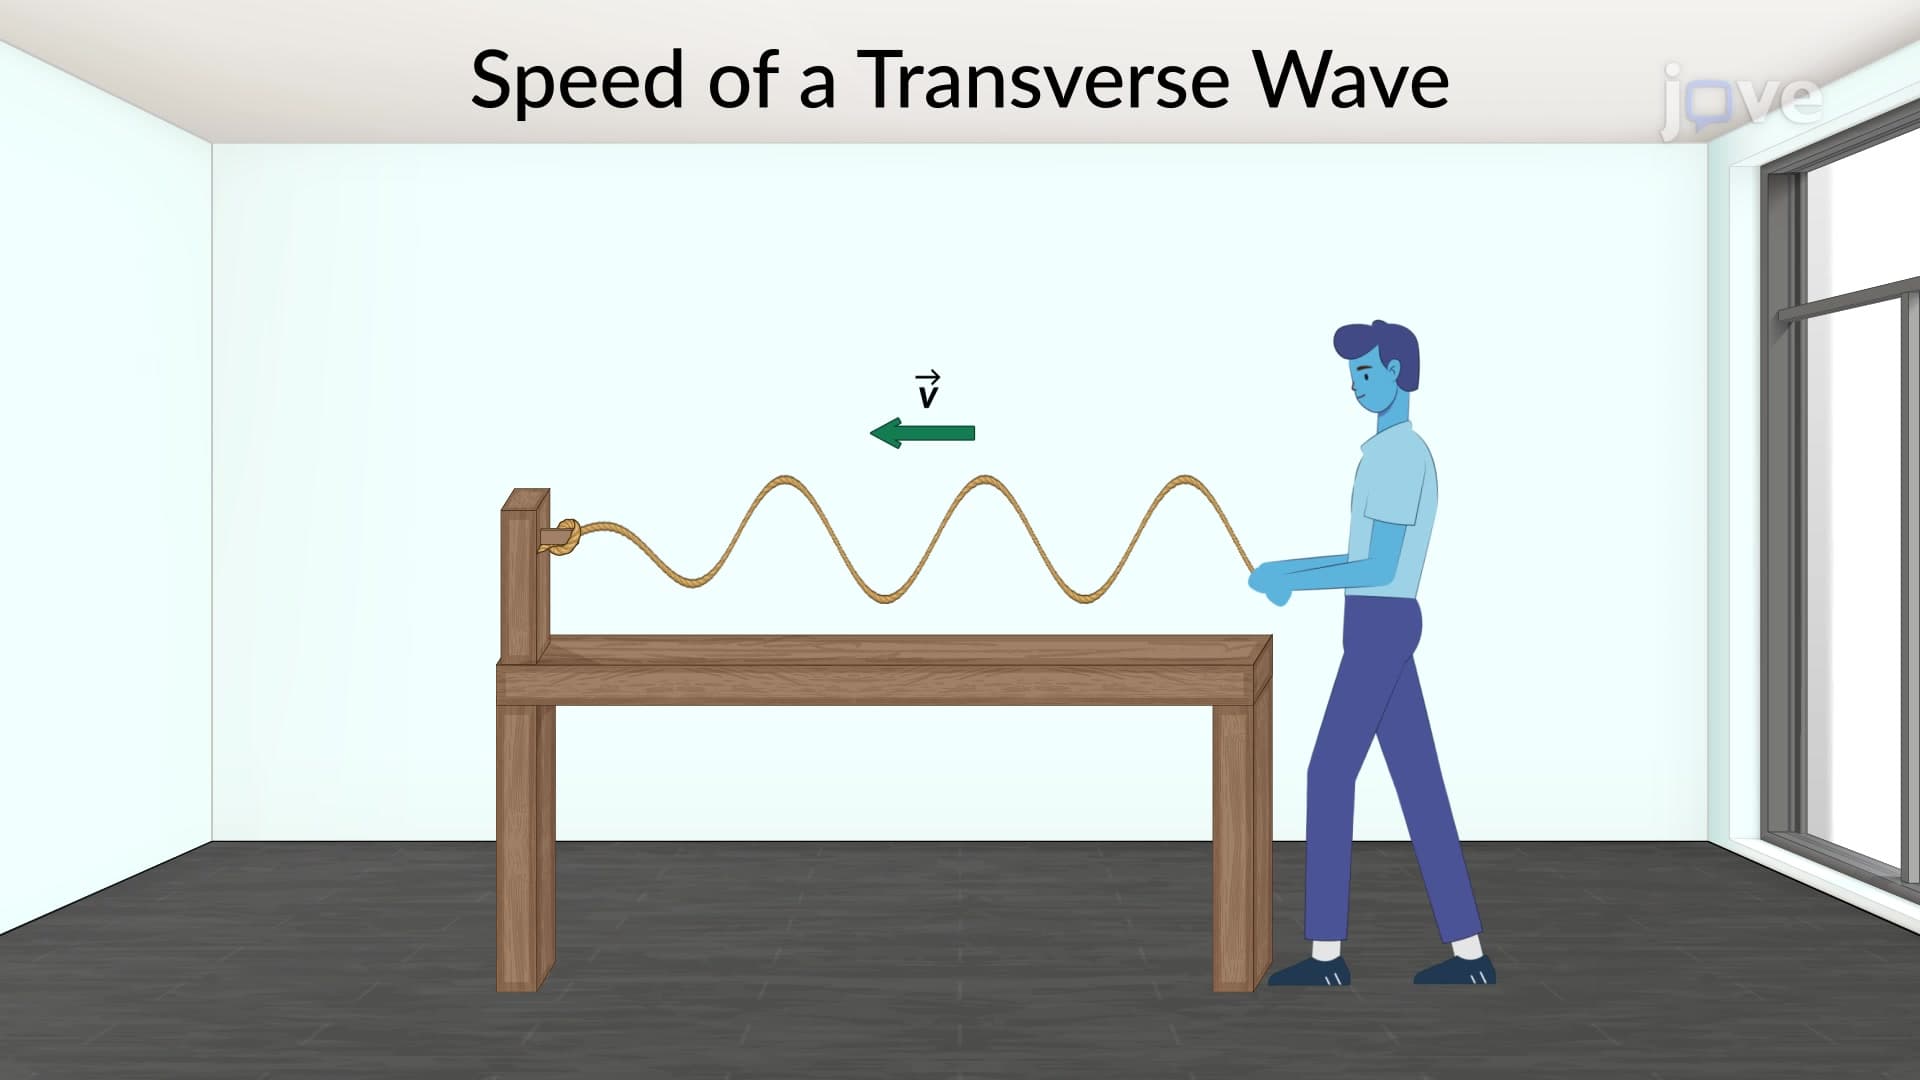
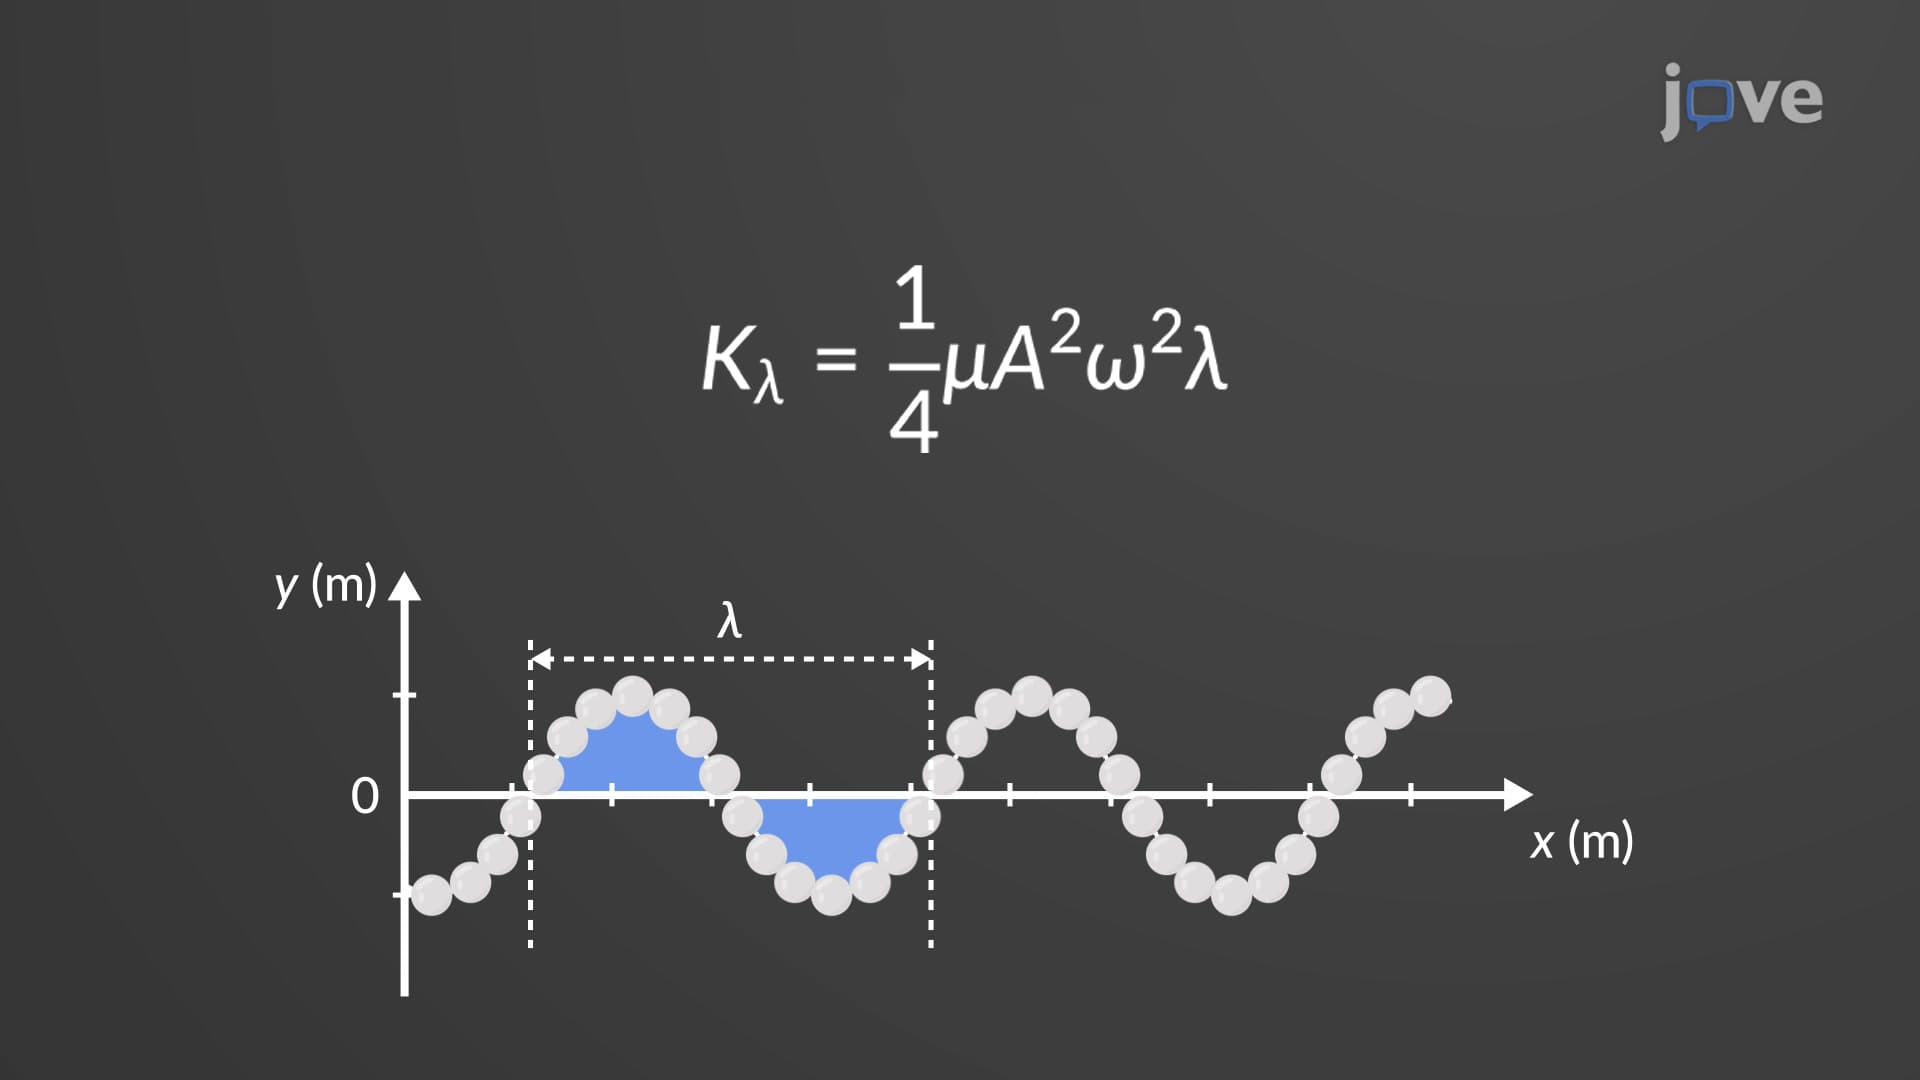
The displacement-position graph shows a "snapshot" of the wave at a specific moment in time. Imagine photographing a rope being shaken up and down, the resulting image captures the rope's curved shape, which directly corresponds to this type of graph. For transverse waves like those on guitar strings, this graph literally shows the string's physical shape. The horizontal distance between repeating patterns reveals the wavelength (λ), a crucial parameter that determines properties like pitch in musical instruments or the resolution capabilities of medical ultrasound equipment used in US hospitals.
Students preparing for AP Physics exams frequently encounter problems requiring them to read wavelength values directly from these position graphs. The key insight is recognizing that one complete cycle, from peak to peak, or trough to trough, represents one wavelength.
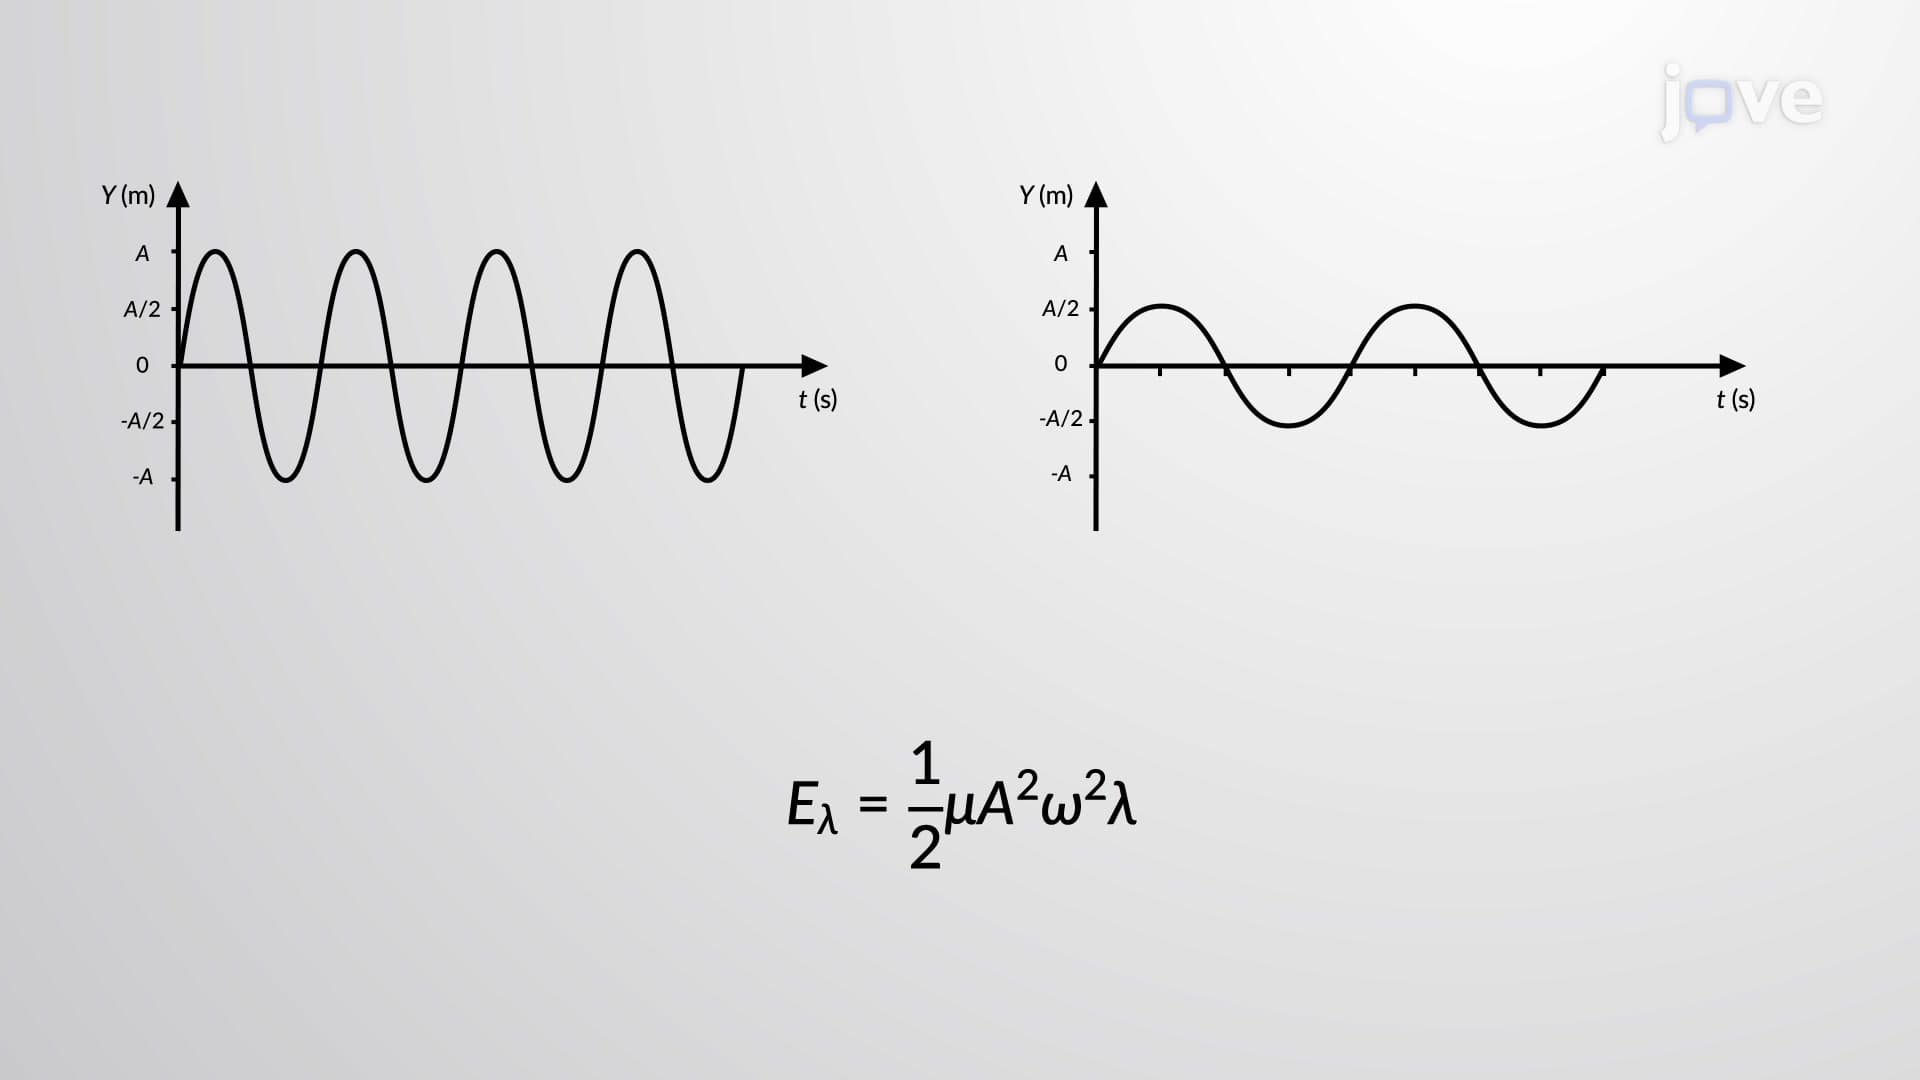
When focusing on a single point in space, the displacement-time graph reveals how one particle oscillates as waves pass by. This is analogous to watching a single cork bobbing on ocean waves, the cork's up-and-down motion over time creates this graph type. From this representation, physicists determine the period (T), which is the time required for one complete oscillation cycle.
This concept proves essential in fields like seismology, where US Geological Survey scientists analyze earthquake data. The time between successive wave peaks helps determine earthquake characteristics and predict aftershock patterns.
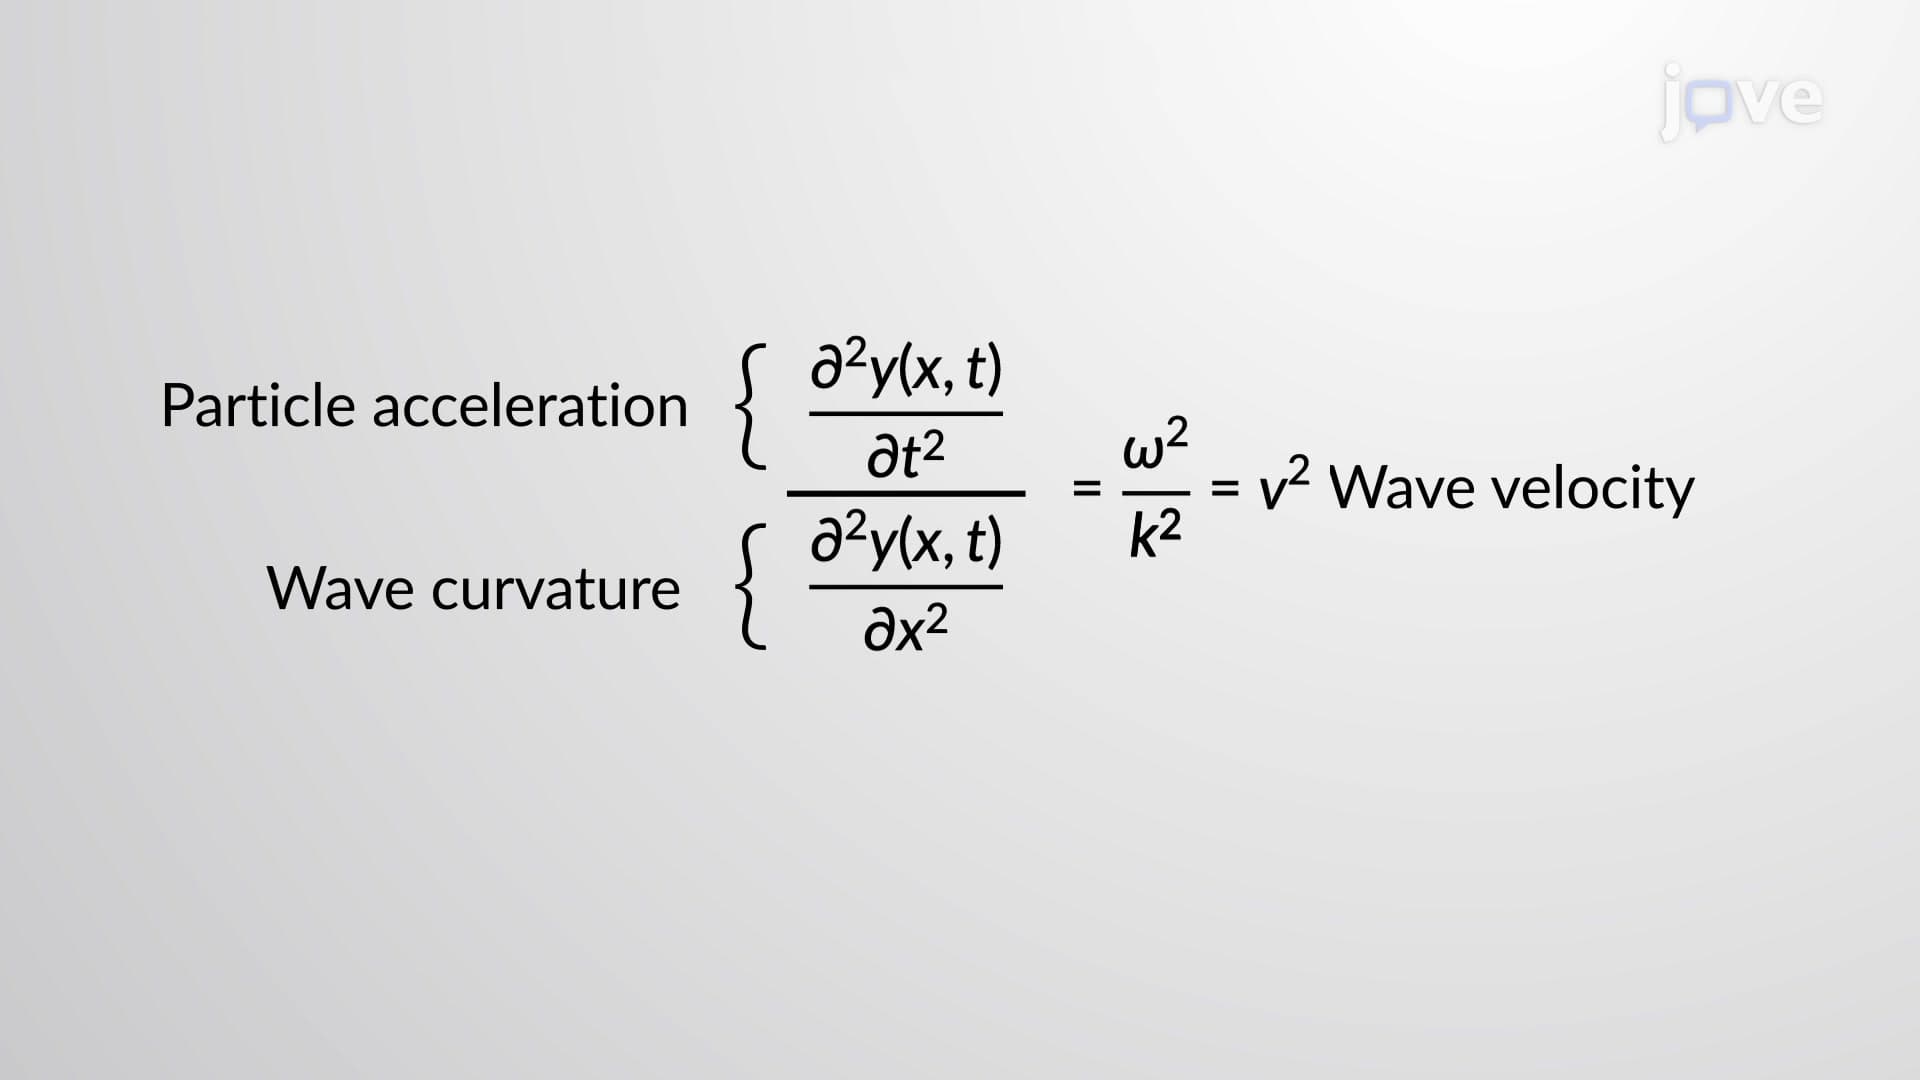
The phase of a wave function, the argument inside trigonometric functions like cosine or sine, determines which part of the wave cycle a particle experiences at any given moment. Phase velocity represents how quickly wave patterns propagate through the medium while maintaining constant phase values. Understanding this concept helps explain why sound travels faster in warm air than cold air, affecting everything from concert hall acoustics to weather radar systems used by the National Weather Service.
Related Micro-courses