Loading subject page…

- Microeconomics
- Consumer Behavior
- Features of Indifference Curves I
Micro-course: Consumer Behavior
9,930 views
Learn key concepts and earn your certificate.











Features of Indifference Curves I


00:00
01:23
Video Summary: Features of Indifference Curves I Explained
Ever wonder why choosing between a Starbucks latte and a subway sandwich feels so complex? The features of indifference curves reveal the hidden mathematics behind everyday consumer choices. These economic tools map how Americans trade off between goods like coffee and food while maintaining equal satisfaction levels. Understanding Features of Indifference Curves I Explained helps decode why consumers willingly sacrifice one product for another. Watch the full video on JoVE Coach to master this concept with expert-led visuals and step-by-step explanations.
- Understand the fundamental Features of Indifference Curves I Explained and their role in consumer choice theory
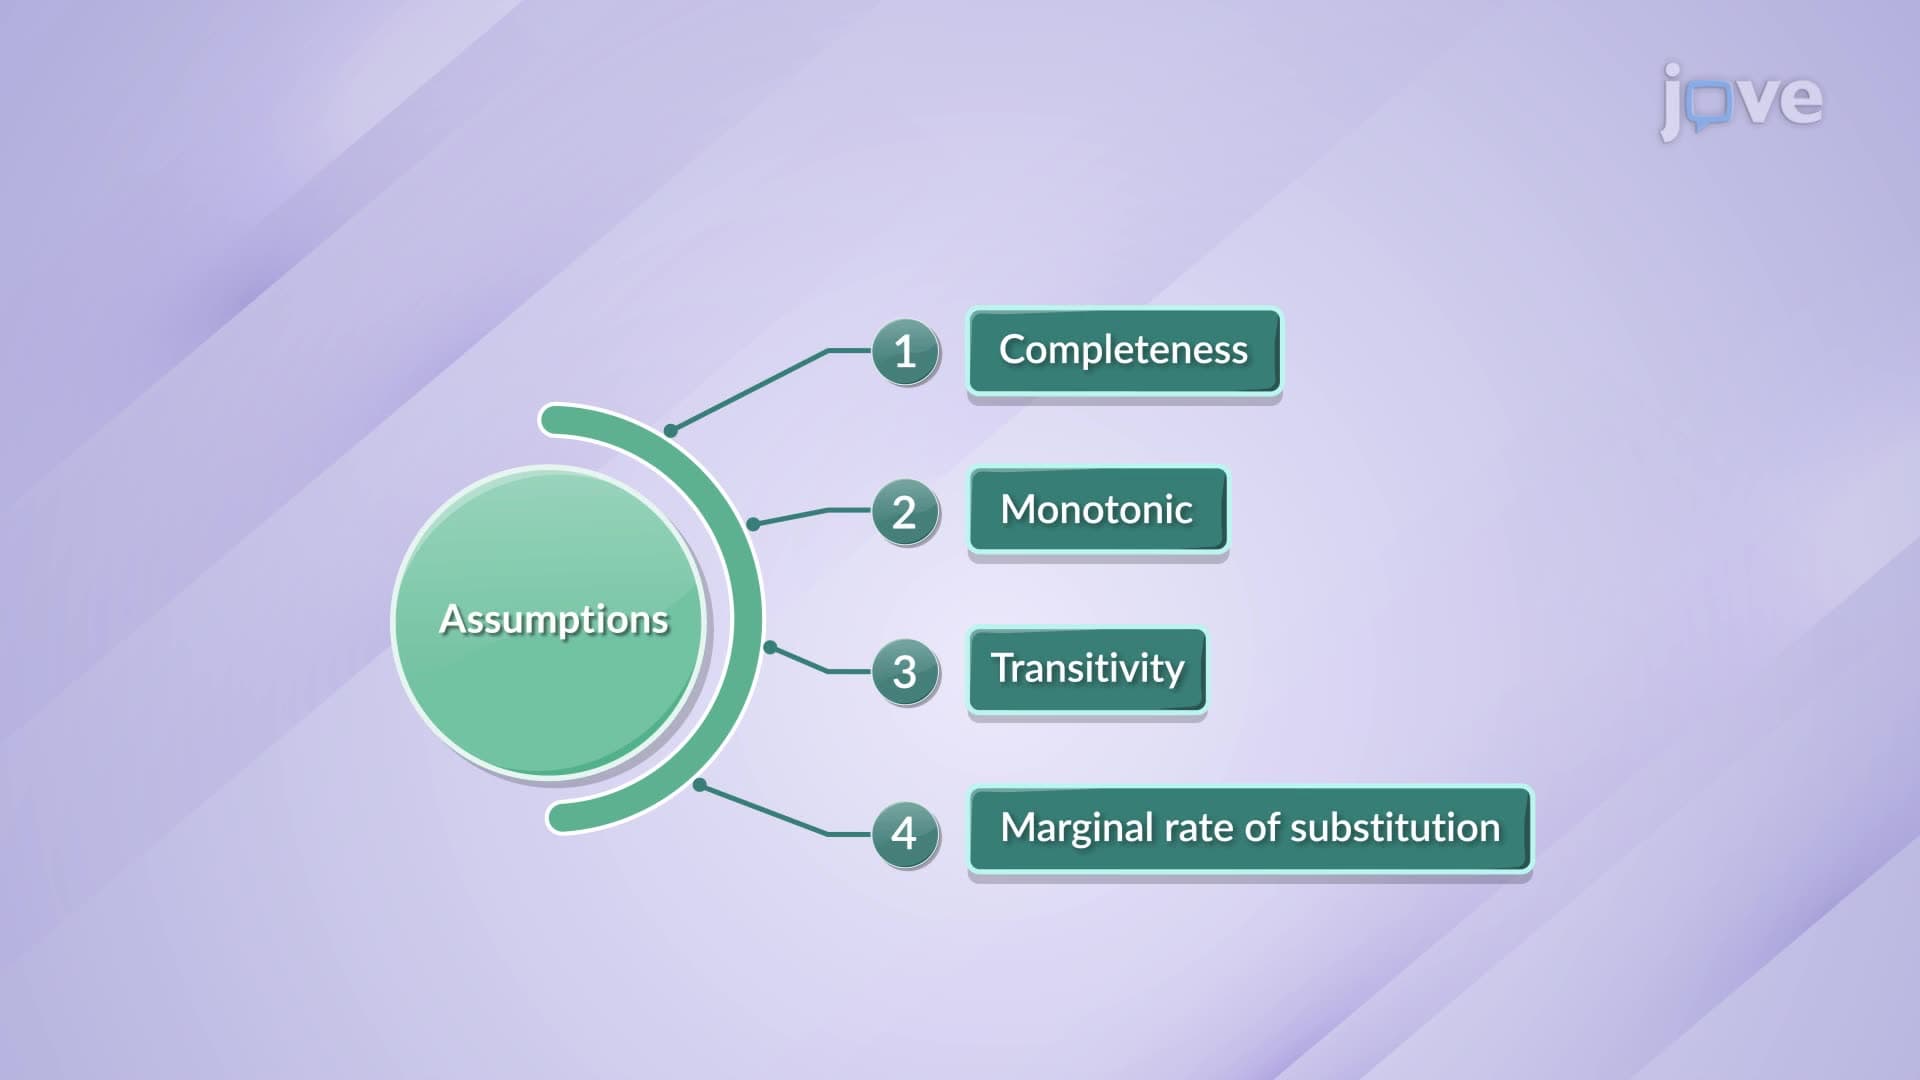
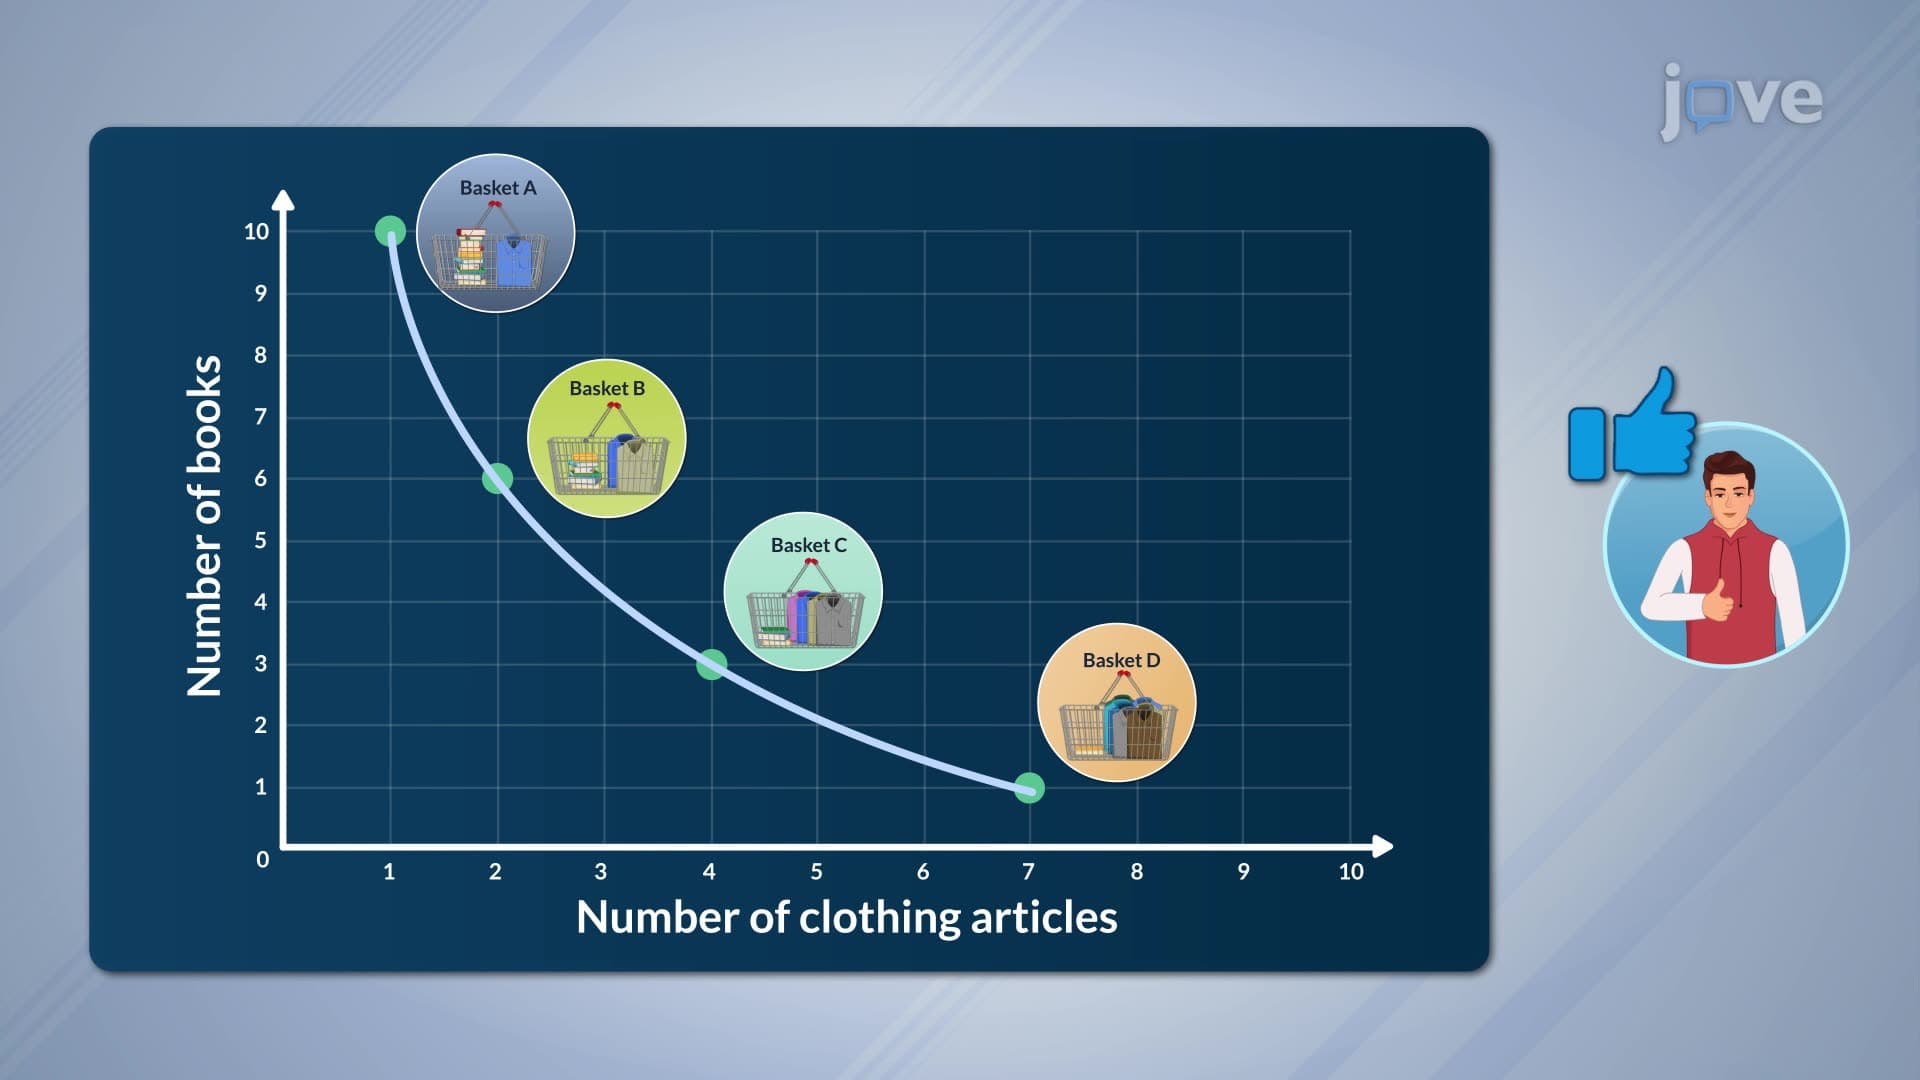
- Identify why indifference curves slope downward due to trade-offs between goods
- Analyze how monotonic preferences drive consumers to prefer higher indifference curves over lower ones
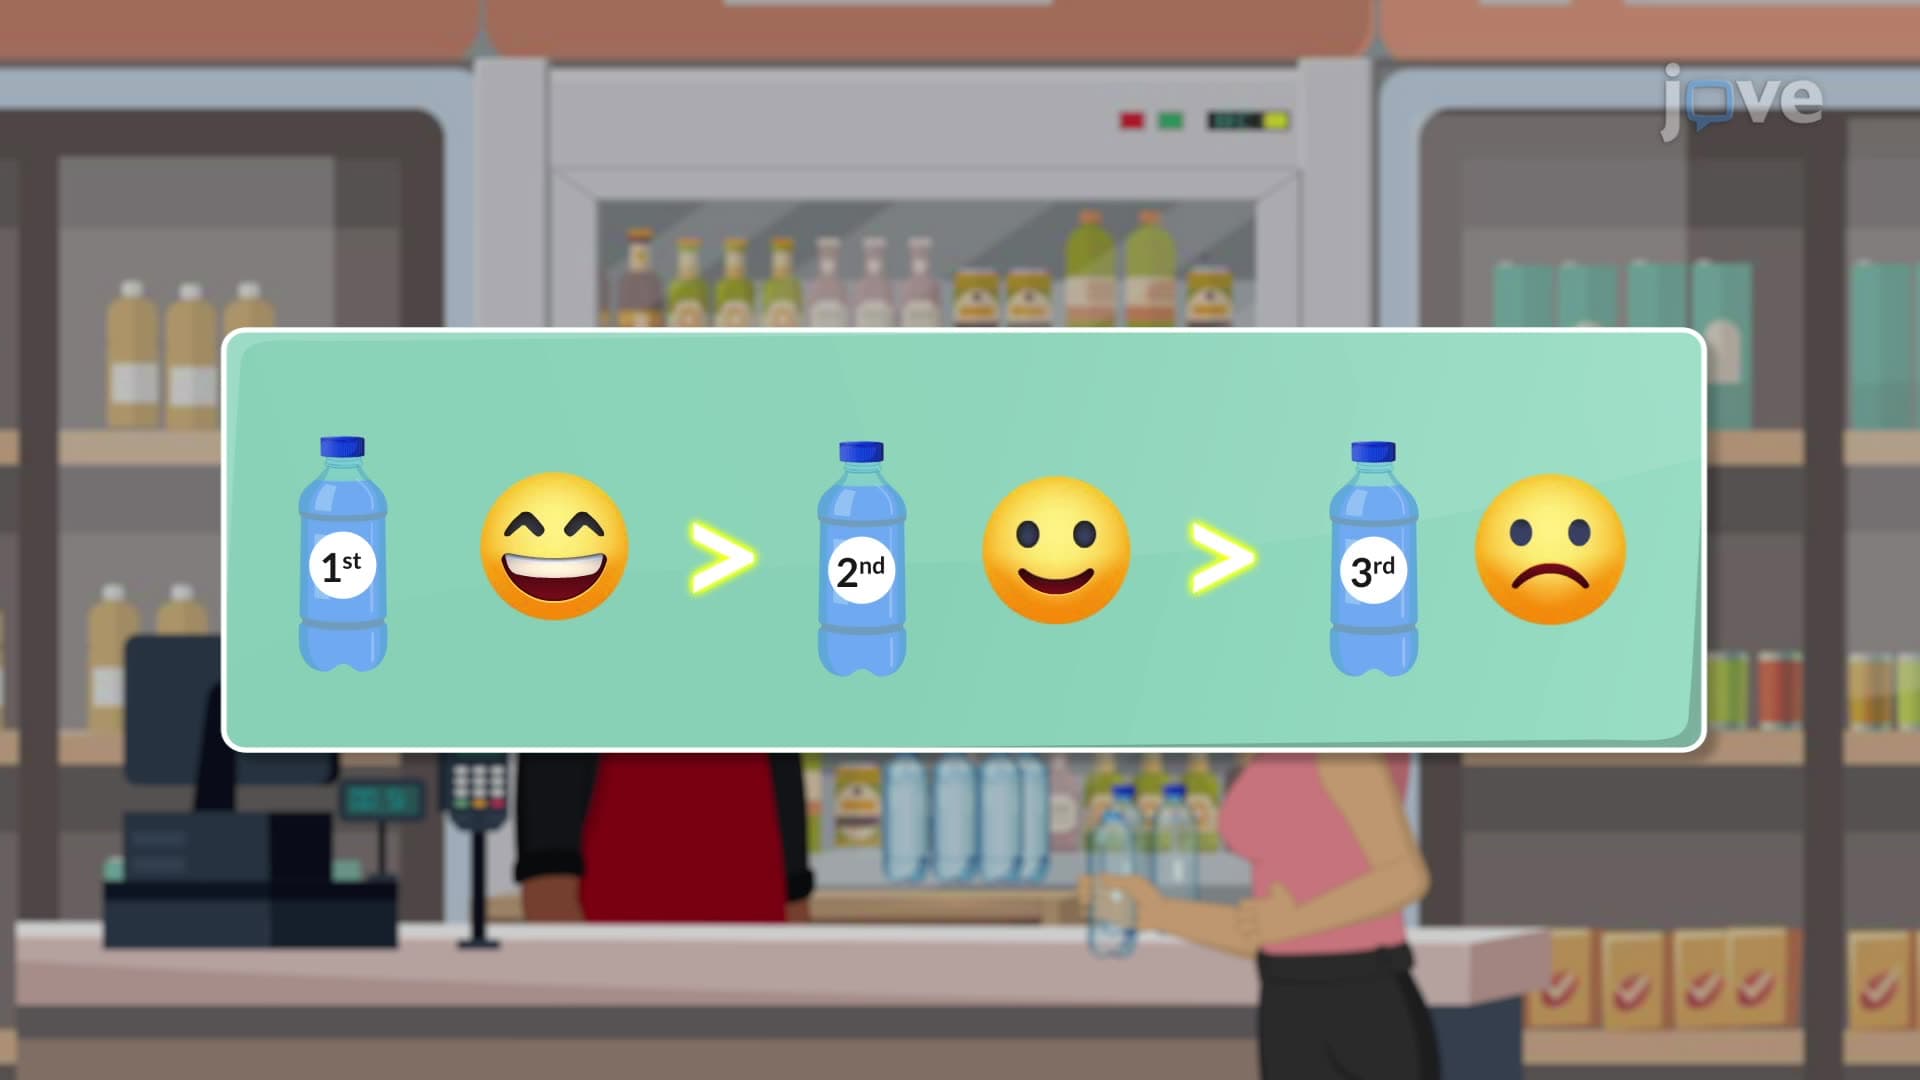
- Compare different combinations of goods that provide equal utility levels
- Evaluate real-world scenarios where consumers make substitution decisions between products
- Apply indifference curve principles to predict consumer behavior in various market situations
- Recognize the mathematical relationship between utility maximization and consumer preferences
- Explore how these economic concepts connect to business strategy and market analysis
Understanding the Features of Indifference Curves I Explained
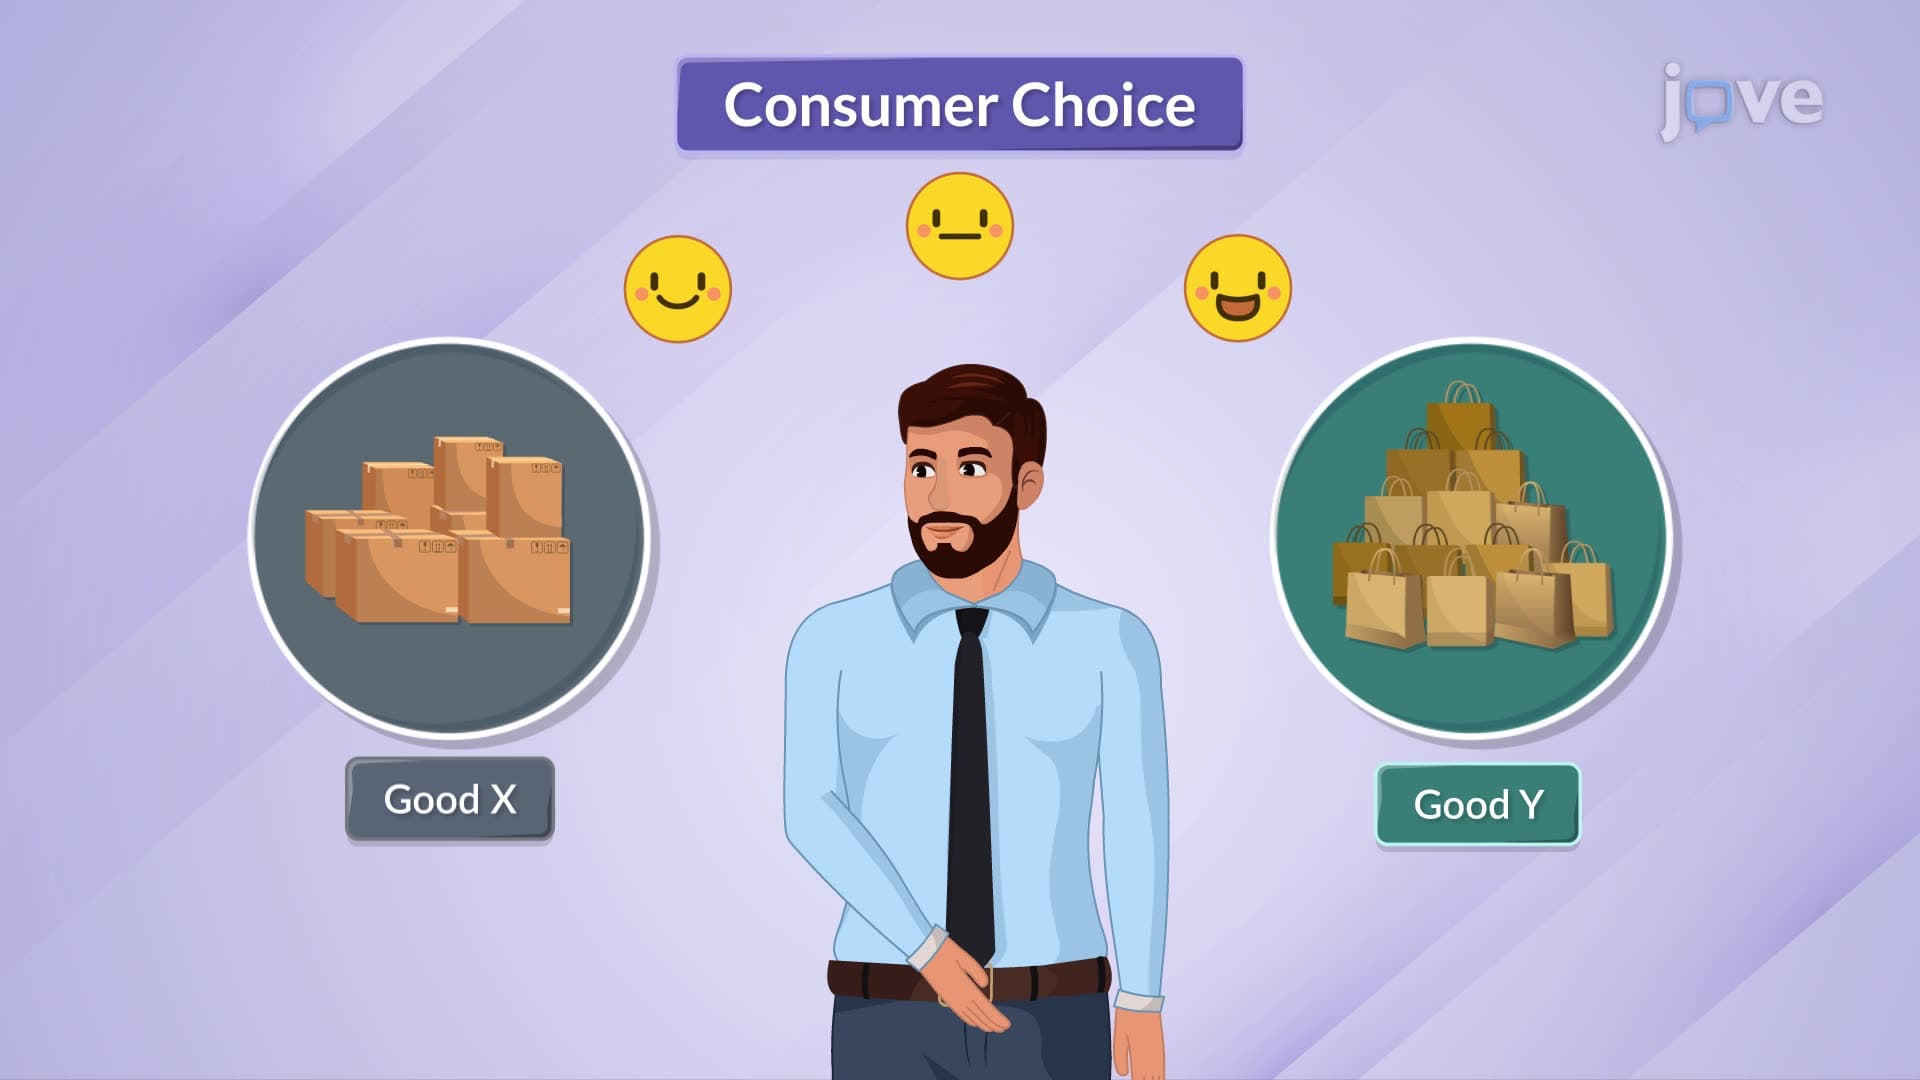
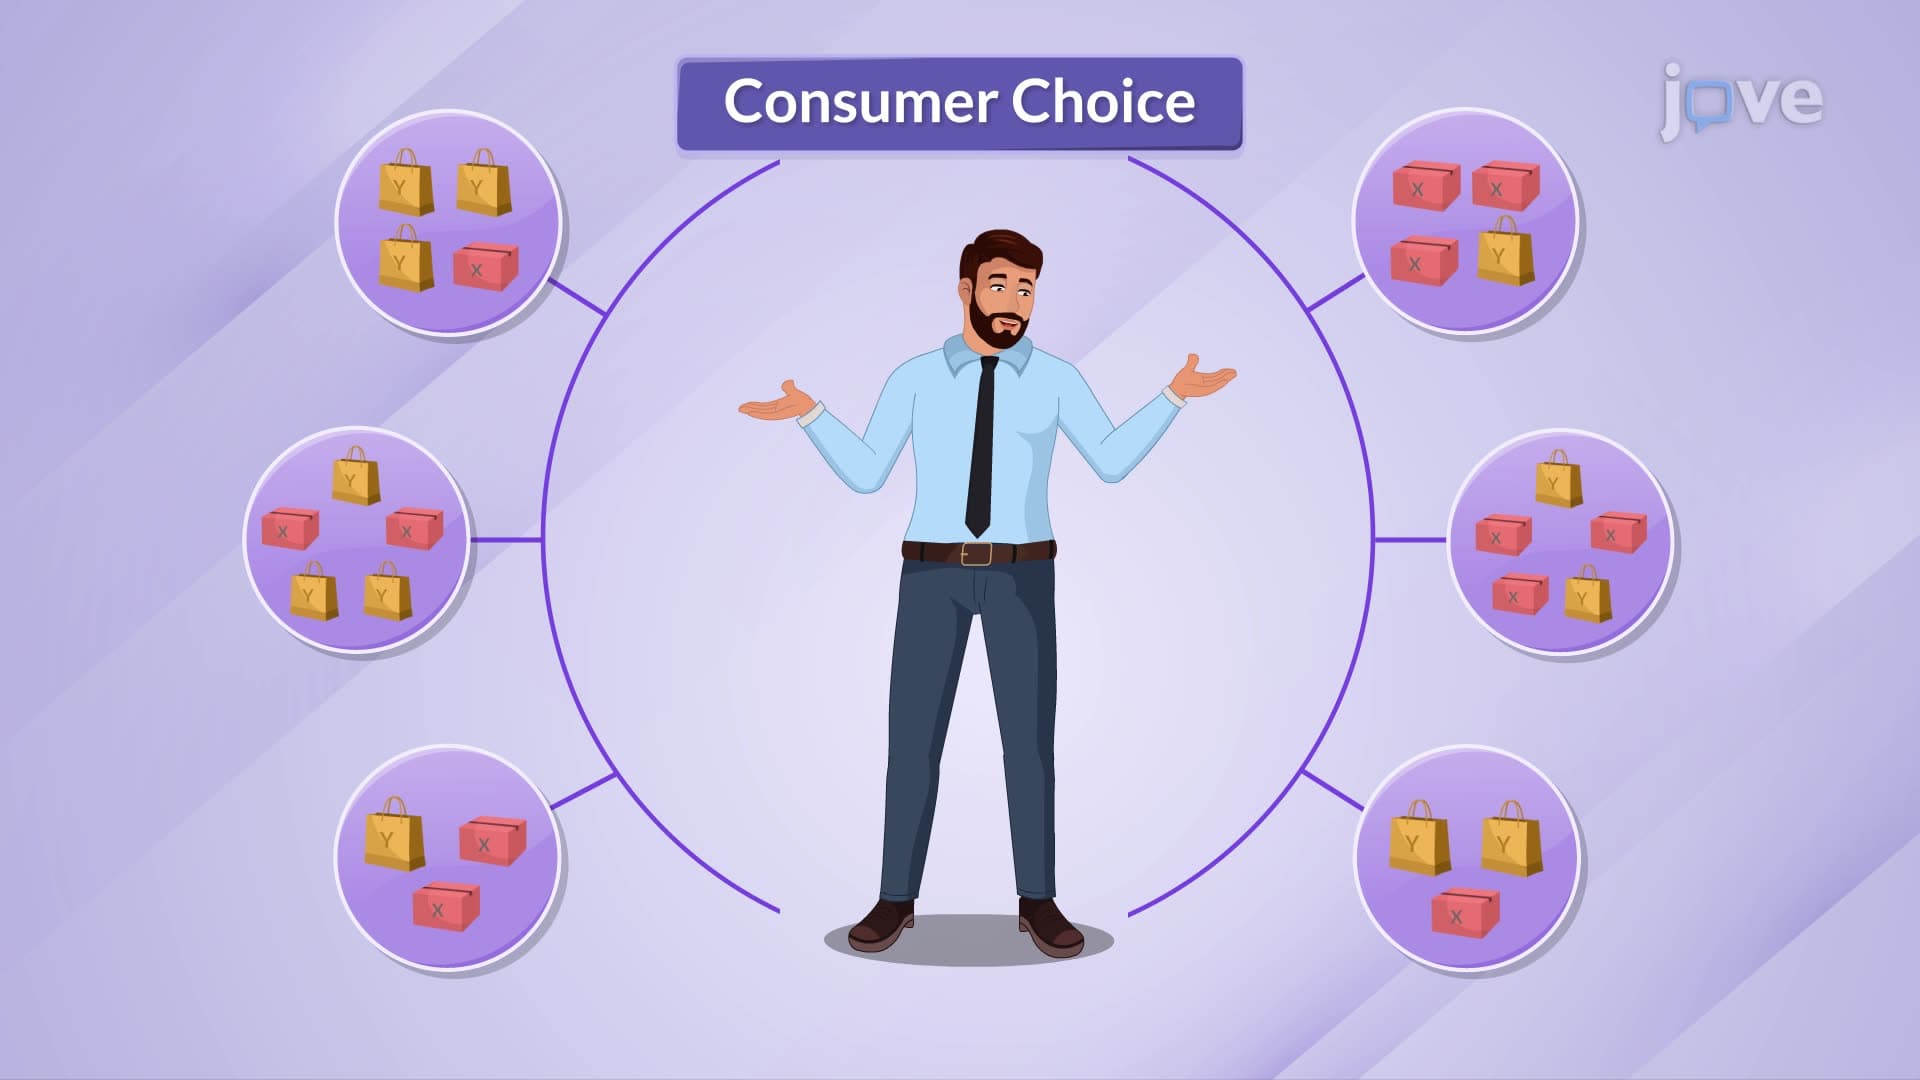
Indifference curves represent one of microeconomics' most powerful tools for analyzing consumer behavior. These graphical representations show all combinations of two goods that provide a consumer with identical levels of satisfaction or utility. For high school students preparing for AP Economics or college undergraduates tackling intermediate microeconomics, mastering these concepts proves essential for understanding market dynamics and consumer choice theory.
The Downward Slope: Trade-offs in Action
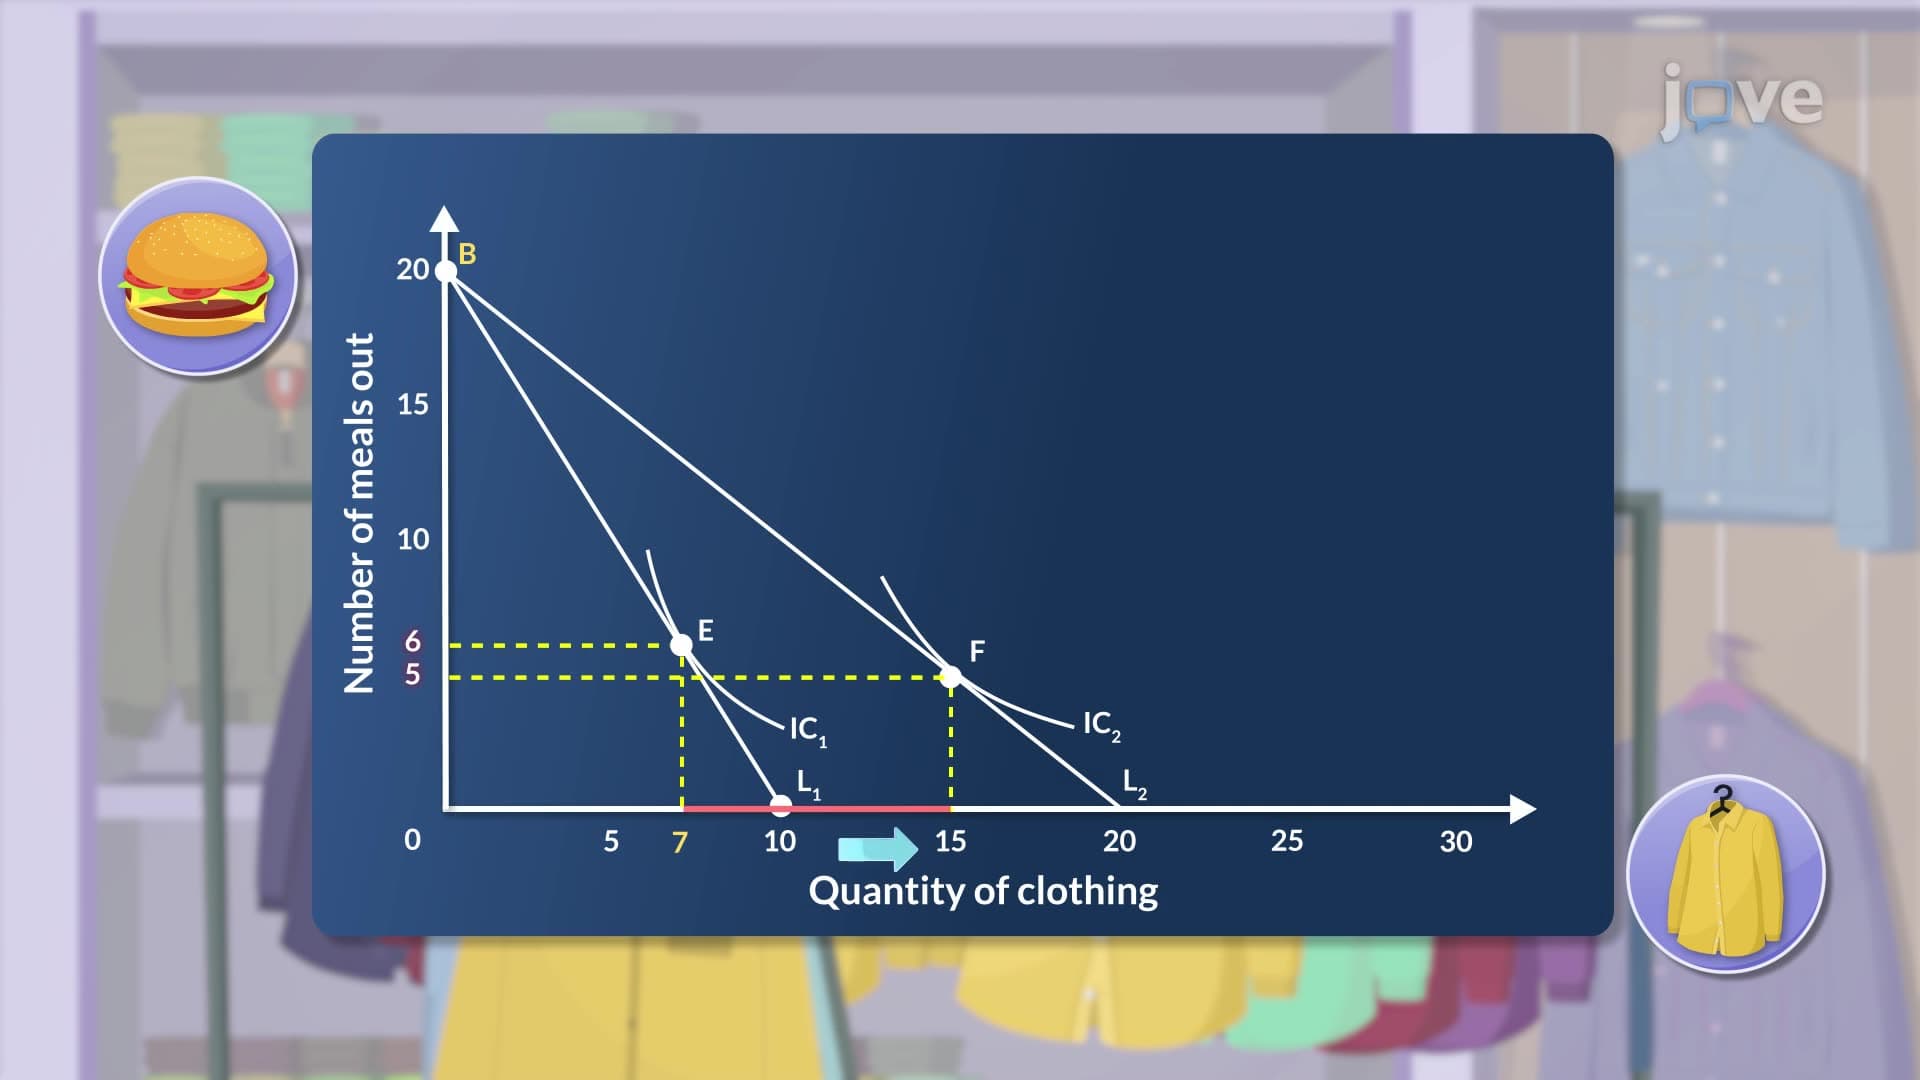
The most distinctive feature of indifference curves is their downward slope, which reflects the fundamental economic principle of trade-offs. When American consumers choose between goods-whether deciding between Netflix subscriptions and movie theater visits, or gas money versus ride-sharing services-they demonstrate this trade-off principle. The negative slope indicates that to maintain the same level of satisfaction, consumers must give up some quantity of one good to obtain more of another.
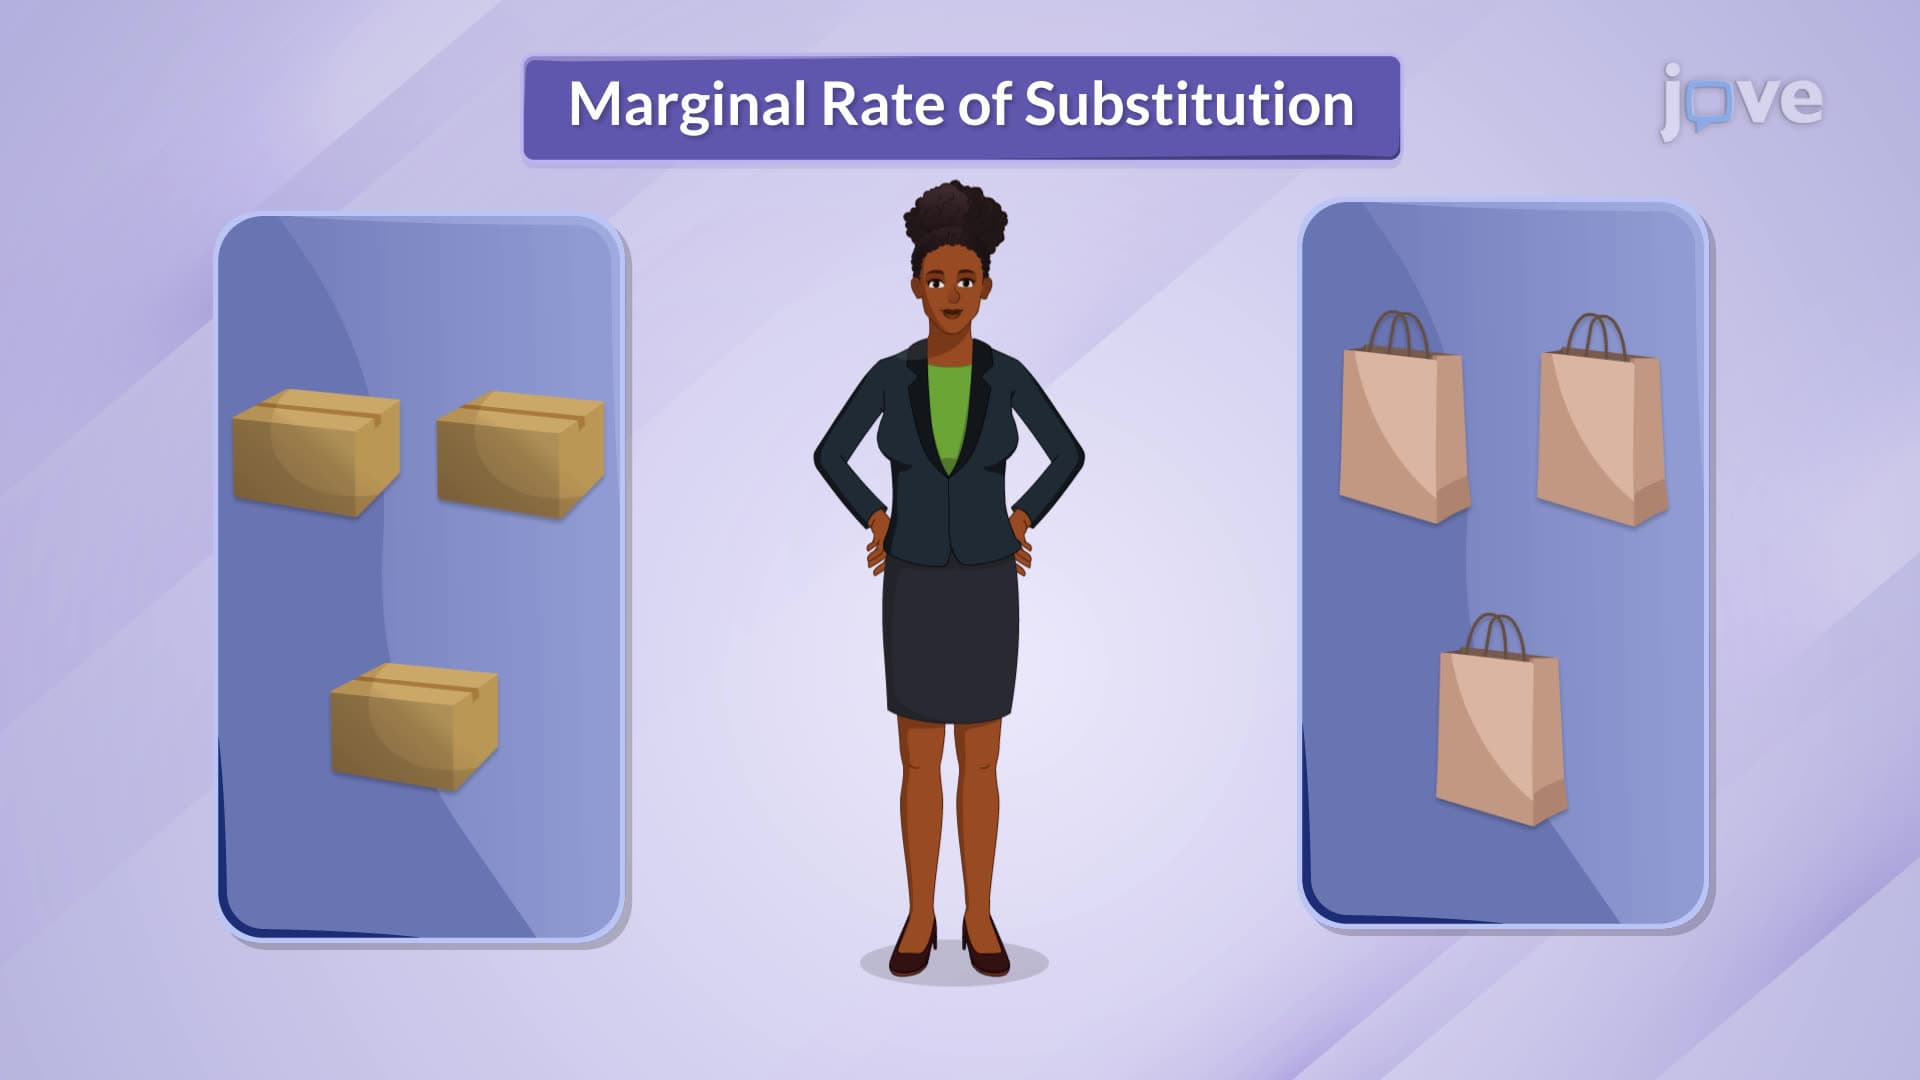
This trade-off behavior appears frequently in college economics exams, particularly in questions asking students to explain consumer equilibrium. The slope's steepness indicates the marginal rate of substitution, showing how much of one good a consumer willingly sacrifices for additional units of another good while remaining equally satisfied.
Monotonic Preferences and Higher Curves
Another crucial feature involves the assumption of monotonic preferences-consumers prefer more goods to fewer goods, all else being equal. This principle explains why higher indifference curves (those farther from the origin) represent greater utility levels. When students encounter this concept in SAT Subject Test Economics or college midterms, they should remember that rational consumers always prefer combinations on higher curves when given the choice.
Consider a college student choosing between textbooks and coffee purchases. A combination of five textbooks and ten coffee purchases provides higher utility than three textbooks and eight coffee purchases, assuming the student values both goods positively. This relationship helps explain why businesses often bundle products or offer loyalty programs-they're essentially helping consumers reach higher indifference curves.
Practical Applications in Economic Analysis
These features become particularly relevant when analyzing real market scenarios. Retail chains like Target or Walmart use indifference curve principles when designing product layouts and promotional strategies. Understanding how consumers substitute between similar products helps businesses predict demand changes when prices fluctuate.
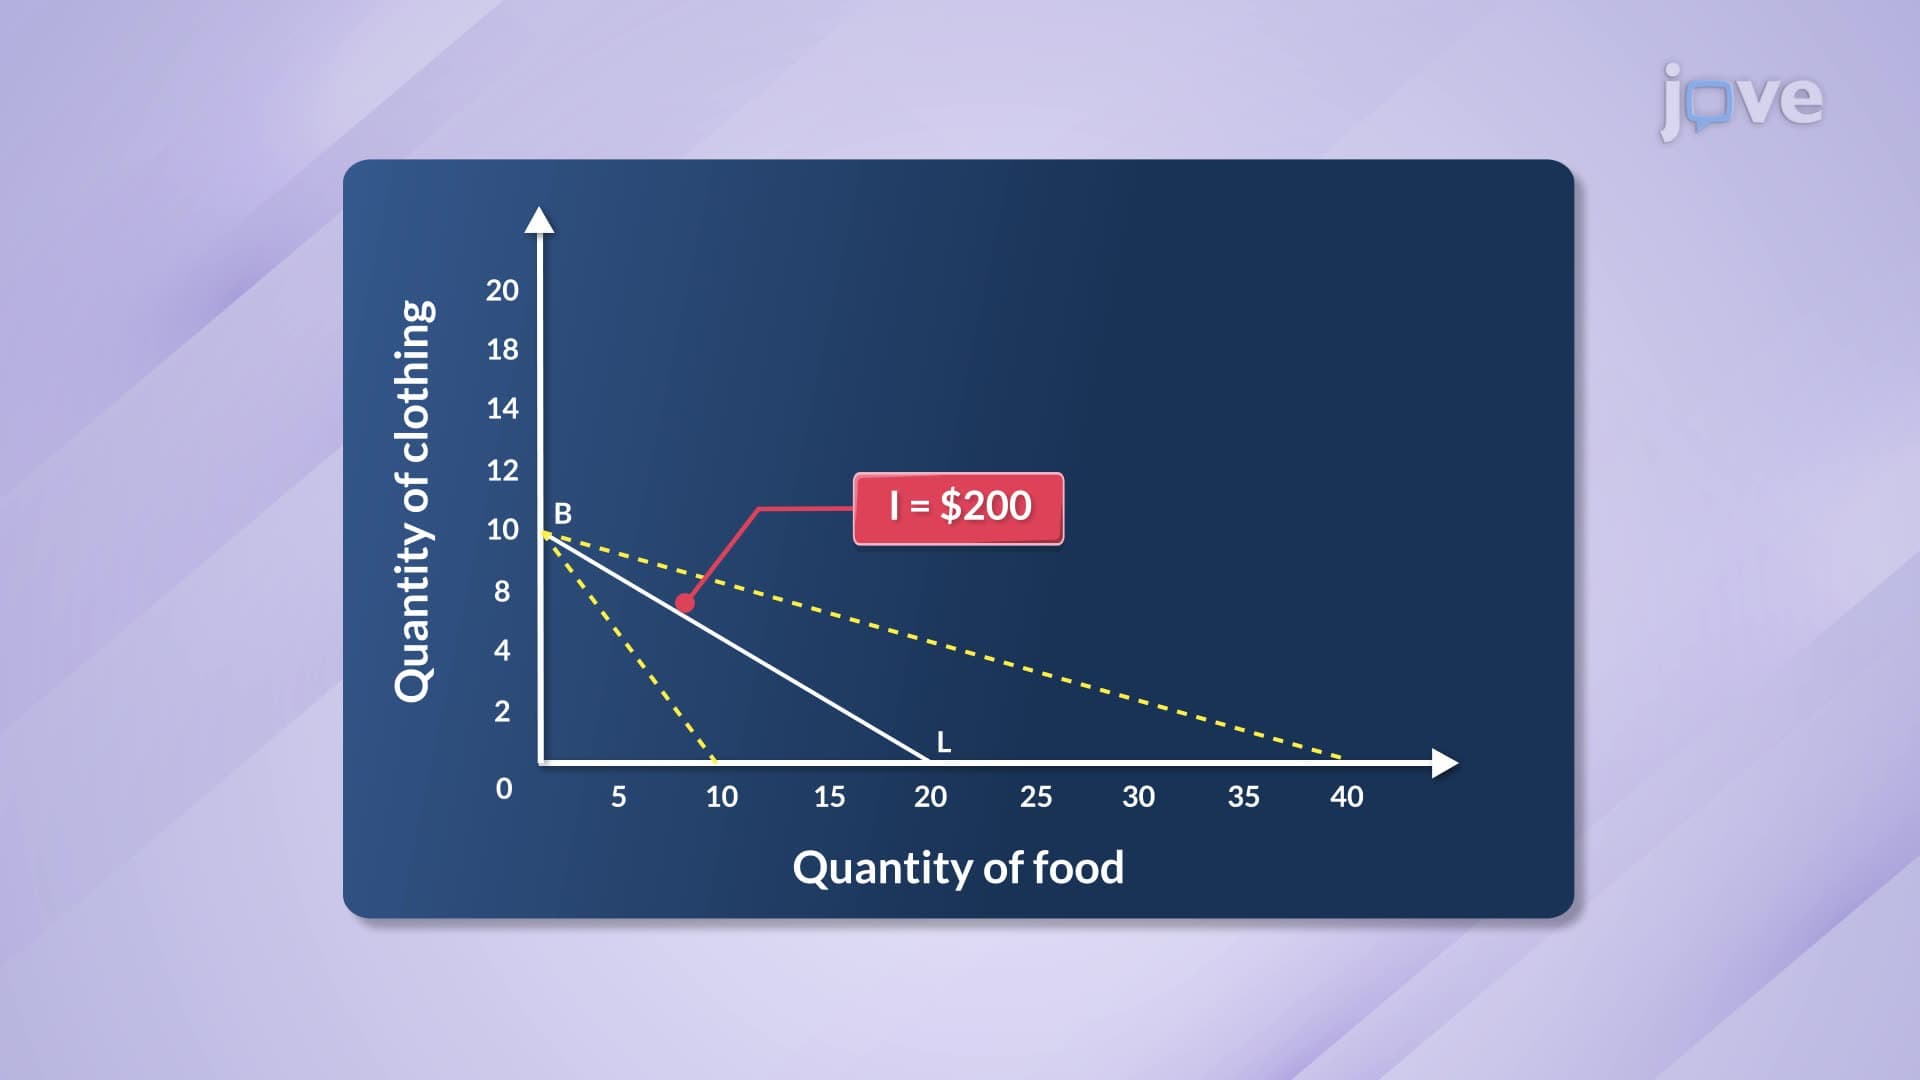
For students preparing for economics competitions or Advanced Placement exams, recognizing these patterns in practice problems proves invaluable. Questions often present scenarios requiring analysis of consumer choice under budget constraints, where indifference curve features determine optimal consumption bundles.
Frequently Asked Questions
Features of indifference curves include their downward slope, higher curves representing greater satisfaction, and points along the same curve providing equal utility. These characteristics help economists model how consumers make trade-off decisions between different goods while maintaining constant satisfaction levels.
AP Economics frequently tests understanding of downward-sloping curves and monotonic preferences through graph analysis questions. Students must identify optimal consumption points, explain why curves cannot intersect, and analyze how changes in income or prices affect consumer choices using these fundamental features.
Intermediate microeconomics, consumer behavior, and mathematical economics courses extensively cover these concepts. Students typically encounter them in Economics 101 and 102 sequences, where professors use them to build foundation knowledge for advanced topics like welfare economics and market analysis.
American retailers like Amazon use these principles for product recommendations and pricing strategies. Understanding how consumers substitute between similar products helps companies predict demand changes, design product bundles, and optimize inventory management based on consumer preference patterns.
Absolutely-while advanced applications require calculus, the basic features rely on intuitive economic reasoning about trade-offs and preferences. High school students can grasp these concepts using graphical analysis and real-world examples without complex mathematical derivations.
Practice drawing curves and identifying their key characteristics, work through consumer choice problems step-by-step, and connect abstract concepts to familiar scenarios like choosing between entertainment options or food purchases. Focus on understanding why curves slope downward and what different curve positions represent.
Consumer surplus analysis, welfare economics, game theory applications, and behavioral economics all extend these foundational concepts. Graduate students encounter sophisticated versions in courses on advanced microeconomic theory and experimental economics research.
These features link directly to budget constraints, consumer equilibrium, elasticity of substitution, and utility maximization. Understanding them provides the foundation for analyzing market demand curves, consumer welfare changes, and policy impact assessments in advanced coursework.
Related Micro-courses