Loading subject page…

- Microeconomics
- Consumer Behavior
- Budget Constraint II
Micro-course: Consumer Behavior
9,930 views
Learn key concepts and earn your certificate.








Budget Constraint II


00:00
01:18
Video Summary: What Is Budget Constraint Ii
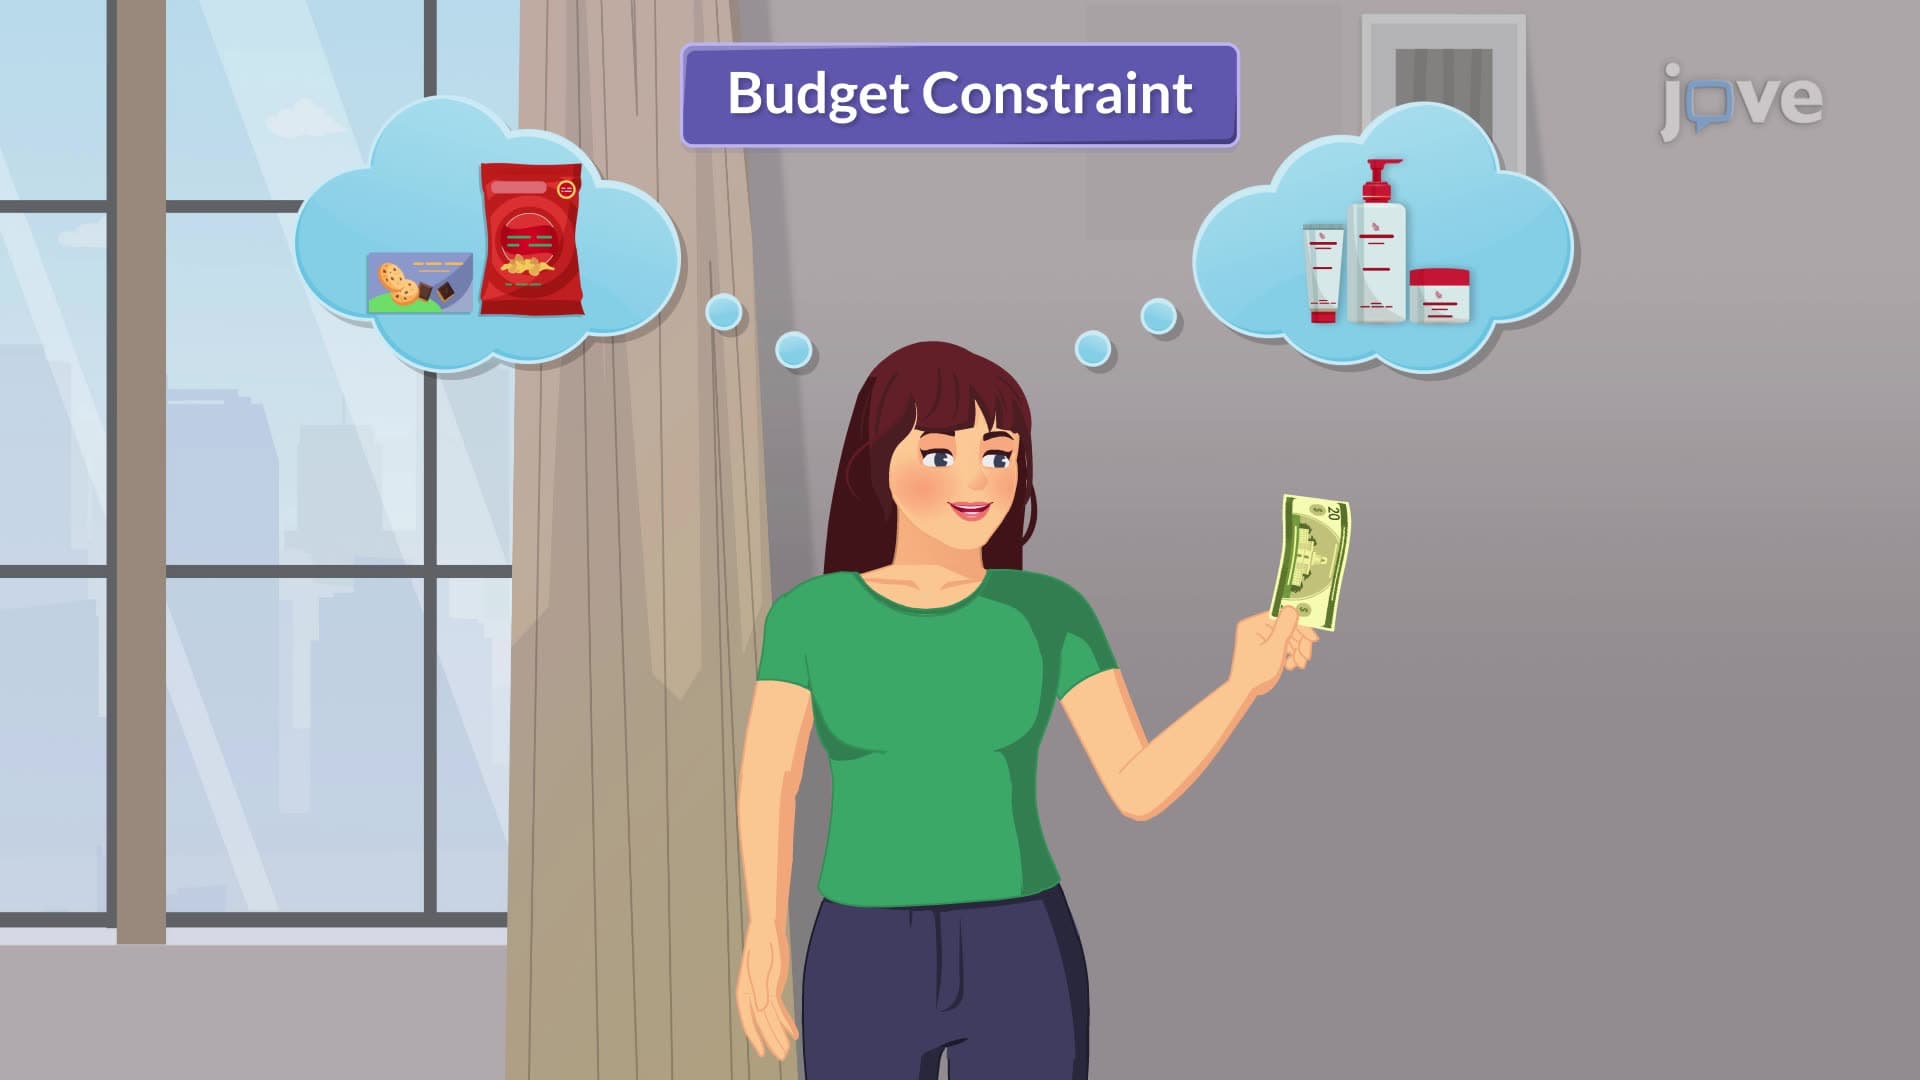
Ever wonder why choosing that expensive coffee means skipping lunch? A budget constraint represents the fundamental economic reality that forces us to make trade-offs with limited resources. Consider a typical American college student with $200 weekly spending money who must choose between textbooks and entertainment-every dollar spent on one means less available for the other. What is Budget Constraint II explores this critical economic principle through practical examples and mathematical relationships that govern our daily purchasing decisions. Watch the full video on JoVE Coach to master this concept with expert-led visuals and step-by-step explanations.
- Understand What is Budget Constraint II as the mathematical relationship between income, prices, and consumption choices
- Identify feasible and infeasible consumption bundles using budget line analysis
- Analyze how changes in income or prices shift the budget constraint and affect consumer choice
- Apply the budget constraint formula to calculate maximum affordable quantities of goods
- Recognize the opportunity cost principle embedded in the budget line's slope
- Evaluate trade-offs between different goods when facing financial limitations
- Compare budget constraints across different income levels and price scenarios
- Explore real-world applications of budget constraints in personal finance and business decisions
Understanding What is Budget Constraint II: The Foundation
The budget constraint definition represents one of economics' most practical concepts-the mathematical relationship that limits what we can purchase based on our income and market prices. Unlike abstract economic theories, budget constraints directly impact every American's daily life, from a high school student deciding between a $5 Starbucks latte and a $5 sandwich to a family allocating their monthly $4,000 income between housing, food, and transportation.
The fundamental budget constraint concept explained through mathematics: Total Expenditure ≤ Total Income. More specifically, if we consider two goods (Good X and Good Y), the constraint becomes: (Price of X × Quantity of X) + (Price of Y × Quantity of Y) ≤ Income. This inequality captures the harsh reality that we cannot spend more than we earn without borrowing or depleting savings.
The Budget Line: Visualizing Economic Trade-offs
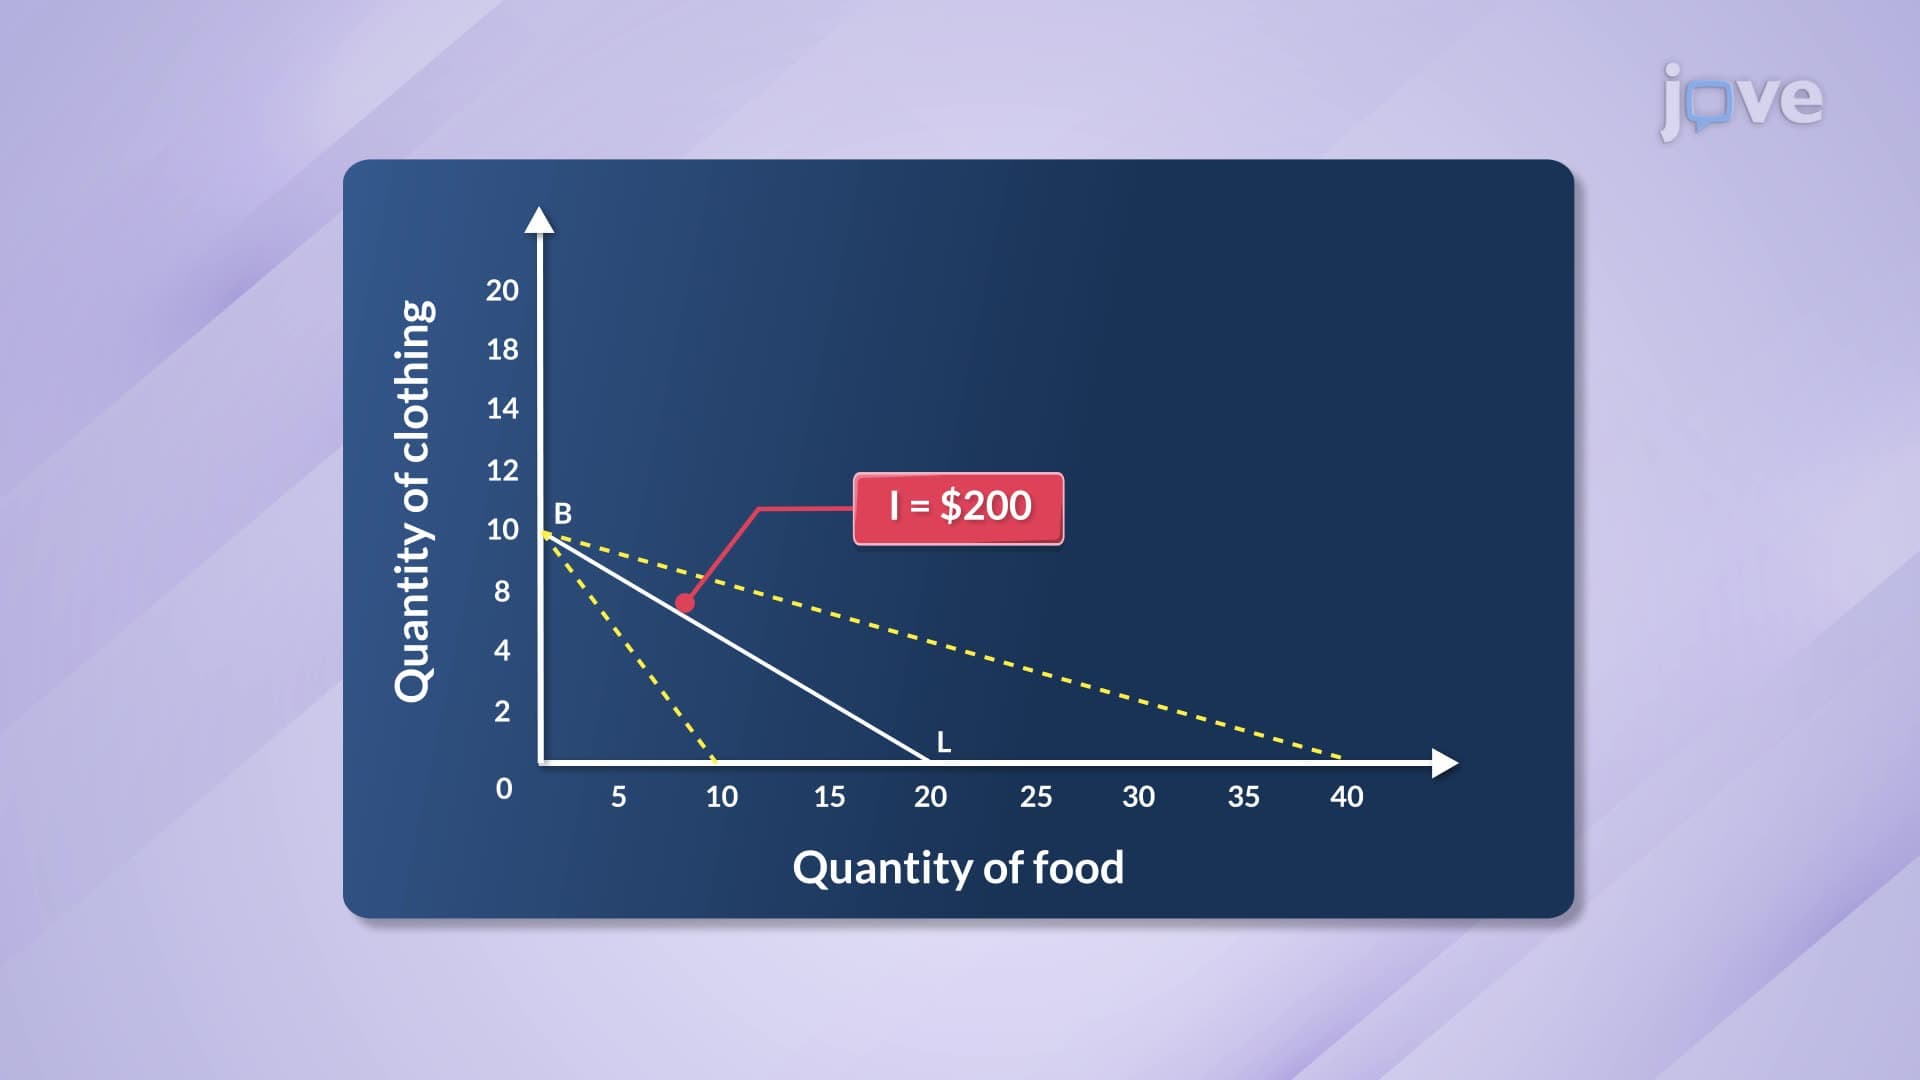
Graphically, the budget constraint transforms into the budget line-a powerful visual tool that appears frequently on AP Economics exams and college microeconomics courses. Points on this line represent combinations where consumers spend their entire income. The line's position depends on two factors: income level and relative prices.
Consider Maria, a University of California student with $800 monthly discretionary income choosing between textbooks ($100 each) and concert tickets ($50 each). Her budget line equation becomes: 100T + 50C = 800, where T represents textbooks and C represents concert tickets. She could afford 8 textbooks and zero concerts, 16 concerts and zero textbooks, or any combination along the line connecting these extremes.
Slope Analysis and Opportunity Cost
The budget line's slope reveals the budget constraint overview's most crucial insight: opportunity cost. The slope equals the negative ratio of the two goods' prices (-Px/Py), indicating how many units of one good must be sacrificed to obtain one additional unit of the other.
In Maria's case, the slope equals -100/50 = -2, meaning each additional textbook costs her two concert tickets. This mathematical relationship appears consistently in standardized tests, making it essential for students preparing for AP Microeconomics or college economics exams.
Shifts and Practical Applications
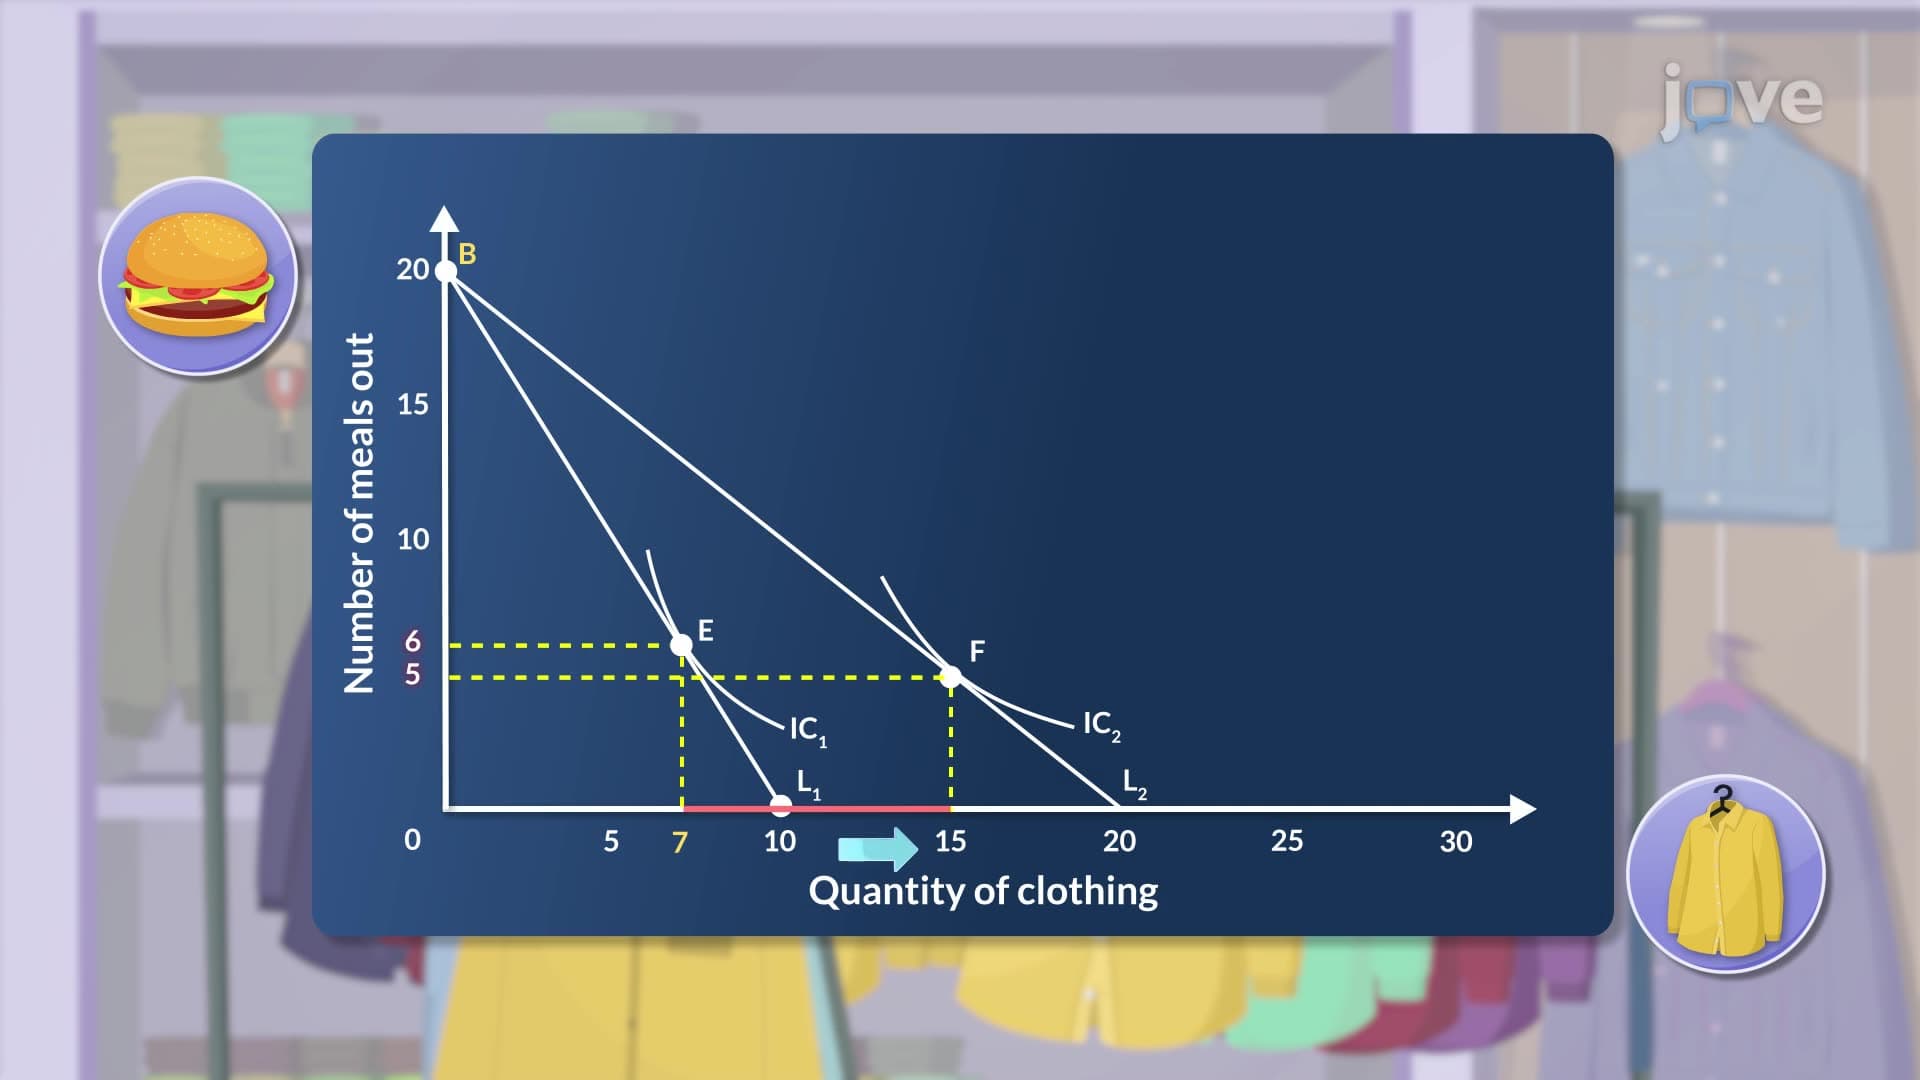
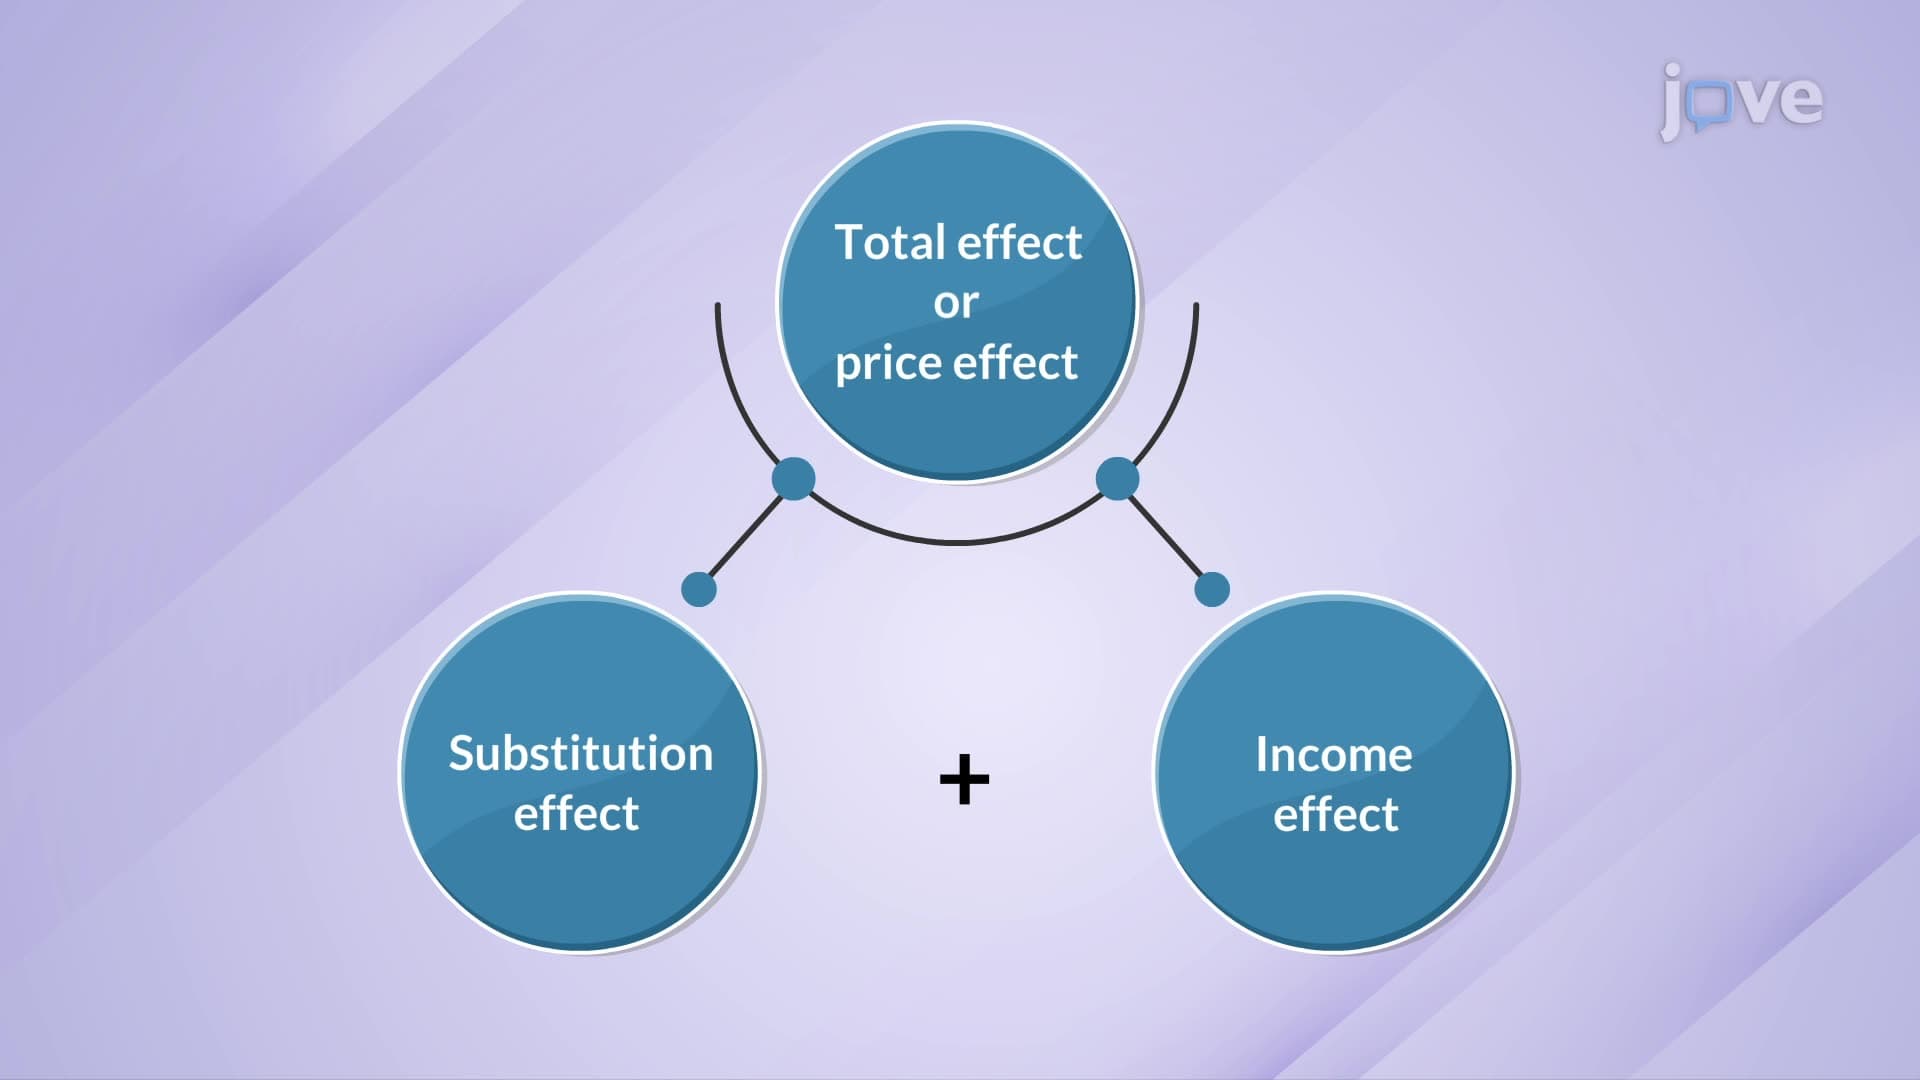
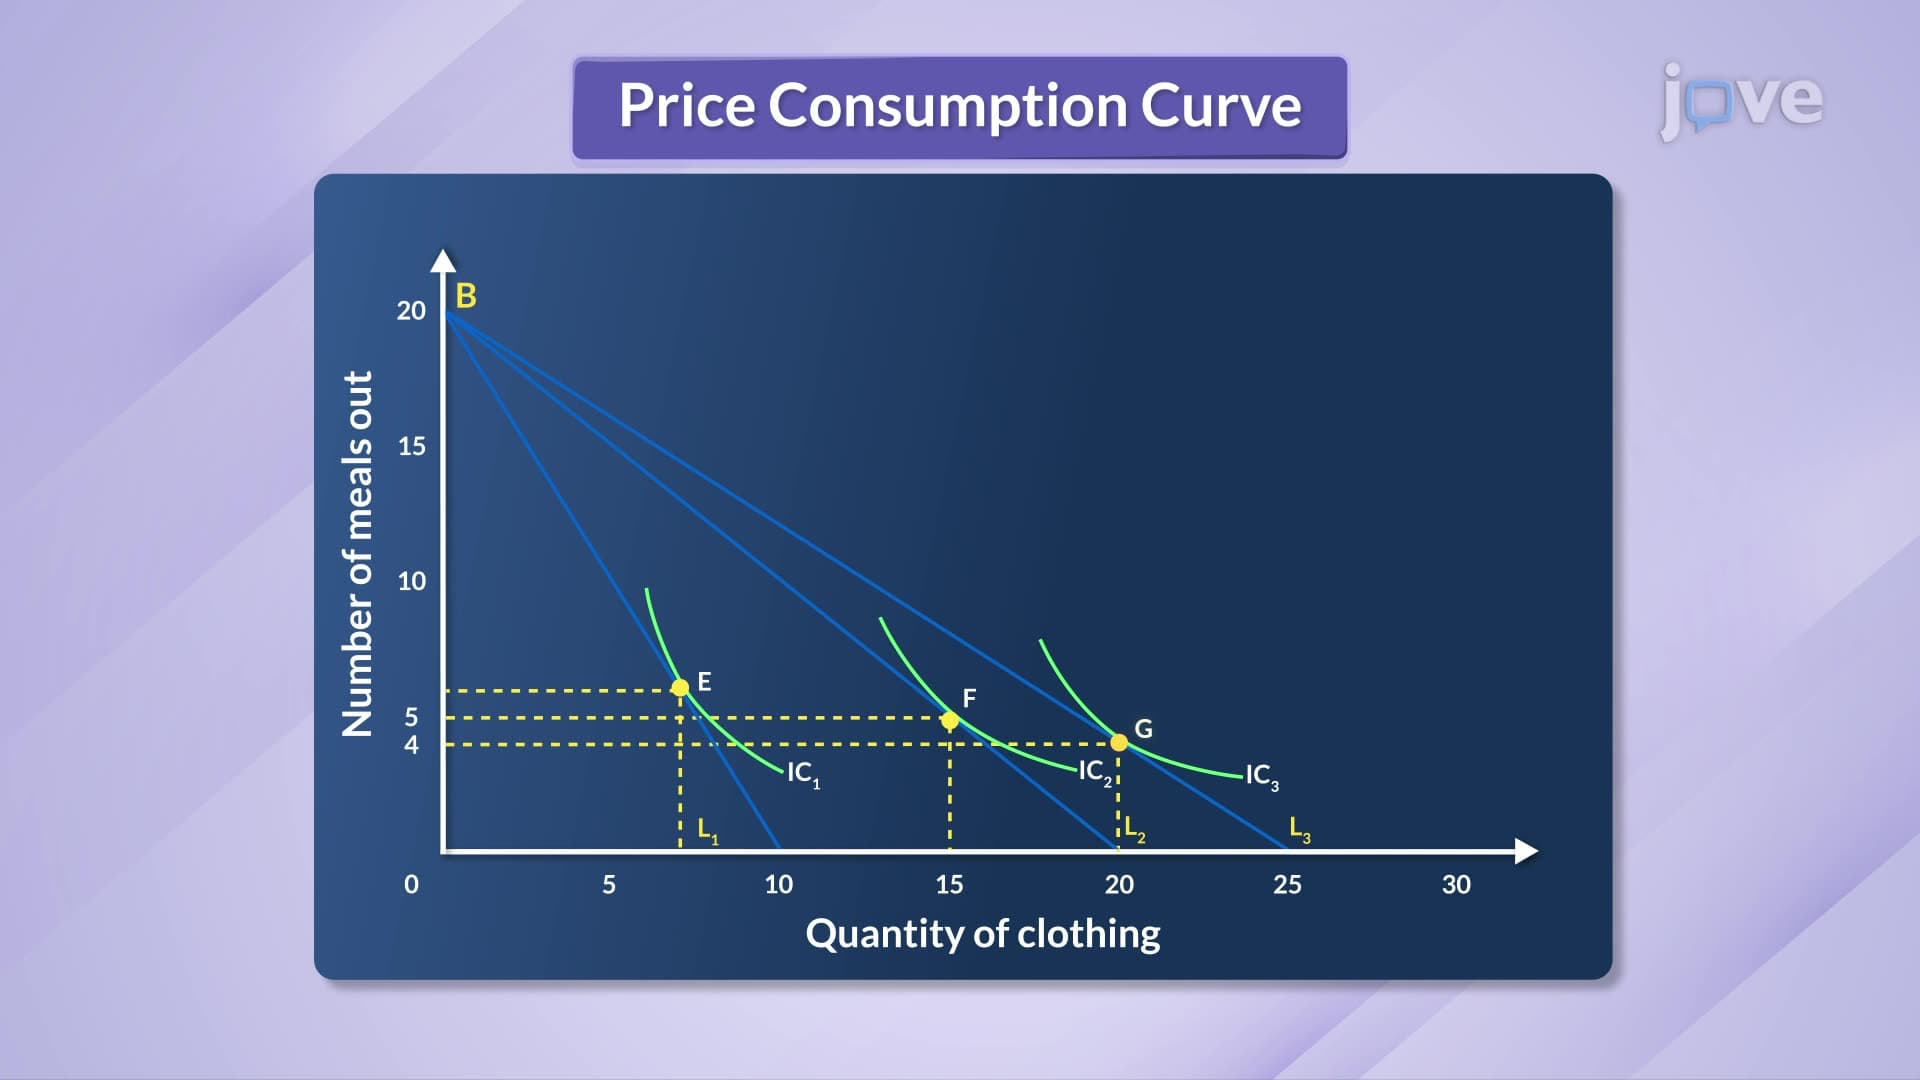
Budget constraints shift when income changes or prices fluctuate-concepts tested extensively in academic settings and observed daily in American markets. Income increases shift the line outward (parallel shift), while price changes alter the line's slope. These shifts help explain consumer behavior during economic events like the 2008 recession or recent inflation periods.
Understanding these dynamics proves invaluable for college students managing student loan budgets, young professionals navigating first salaries, and anyone making informed financial decisions in America's complex economy.
Frequently Asked Questions
Budget Constraint II builds upon fundamental budget principles by incorporating advanced mathematical relationships and real-world applications. It explores how consumers make optimal choices within financial limitations, emphasizing the graphical analysis and slope interpretation that frequently appear in college-level economics courses and AP exams.
AP Microeconomics frequently tests budget constraint graphing, slope calculations, and shift analysis. Students must demonstrate understanding by drawing accurate budget lines, calculating affordable combinations, and explaining how income or price changes affect consumer choice sets. Practice with real numerical examples strengthens exam performance significantly.
Introductory microeconomics, intermediate microeconomic theory, and consumer behavior courses emphasize budget constraints heavily. Business schools include these concepts in managerial economics and marketing research classes. Pre-med students encounter similar principles in behavioral economics sections of MCAT preparation.
The MCAT's psychology and sociology sections include economic decision-making, resource allocation, and behavioral economics concepts. Understanding budget constraints helps with questions about consumer choice, utility maximization, and social economic factors affecting health decisions and healthcare access.
A typical American household earning $65,000 annually faces constant budget constraint decisions: choosing between a $30,000 car and home improvement projects, balancing childcare costs against work income, or allocating funds between retirement savings and current consumption. These real-world applications make the concept highly relevant for personal financial planning.
Budget constraint mastery requires only basic algebra and graphing skills taught in high school. Students comfortable with linear equations, coordinate plotting, and simple ratios possess sufficient mathematical foundation. The concept emphasizes logical reasoning and practical application over complex calculations.
Create personal examples using your own spending decisions, practice graphing budget lines with different income and price scenarios, and work through past AP exam questions. Focus on understanding the economic intuition behind mathematical relationships rather than memorizing formulas.
Progress to consumer choice theory, utility maximization, and indifference curve analysis. These advanced topics build directly on budget constraint foundations and appear in upper-level economics courses and graduate school preparation materials.
Related Micro-courses