Loading…
Loading video…
154,401 views

Ever wondered how Netflix calculates the average viewing time when millions of users watch different shows for varying durations? The mean from a frequency distribution solves this exact problem by finding averages when data values repeat multiple times. Unlike simple arithmetic means, this method accounts for how often each value occurs—whether it's test scores appearing multiple times in a grade book or customer ages grouped in marketing surveys. This statistical technique multiplies each data value by its frequency, then divides by the total frequency count. Watch the full video on JoVE Coach to master this concept with expert-led visuals and step-by-step explanations.
When dealing with large datasets where values repeat frequently, calculating a simple arithmetic mean becomes inefficient and potentially inaccurate. The mean from a frequency distribution addresses this challenge by incorporating how often each data value appears. This method proves essential in statistics courses, AP Statistics exams, and college-level data analysis where students encounter real-world datasets with repeated observations.
For discrete data values with known frequencies, multiply each data value (x) by its corresponding frequency (f), sum these products, then divide by the total frequency. The formula becomes: Mean = (Σfx) / (Σf). Consider a high school where 15 students scored 85 on a math test, 20 students scored 90, and 10 students scored 95. Rather than listing all 45 individual scores, we calculate: [(15×85) + (20×90) + (10×95)] ÷ (15+20+10) = 4075 ÷ 45 = 90.6.
This method appears frequently on SAT Math sections and AP Statistics free-response questions, where students must demonstrate understanding of weighted averages in practical contexts.
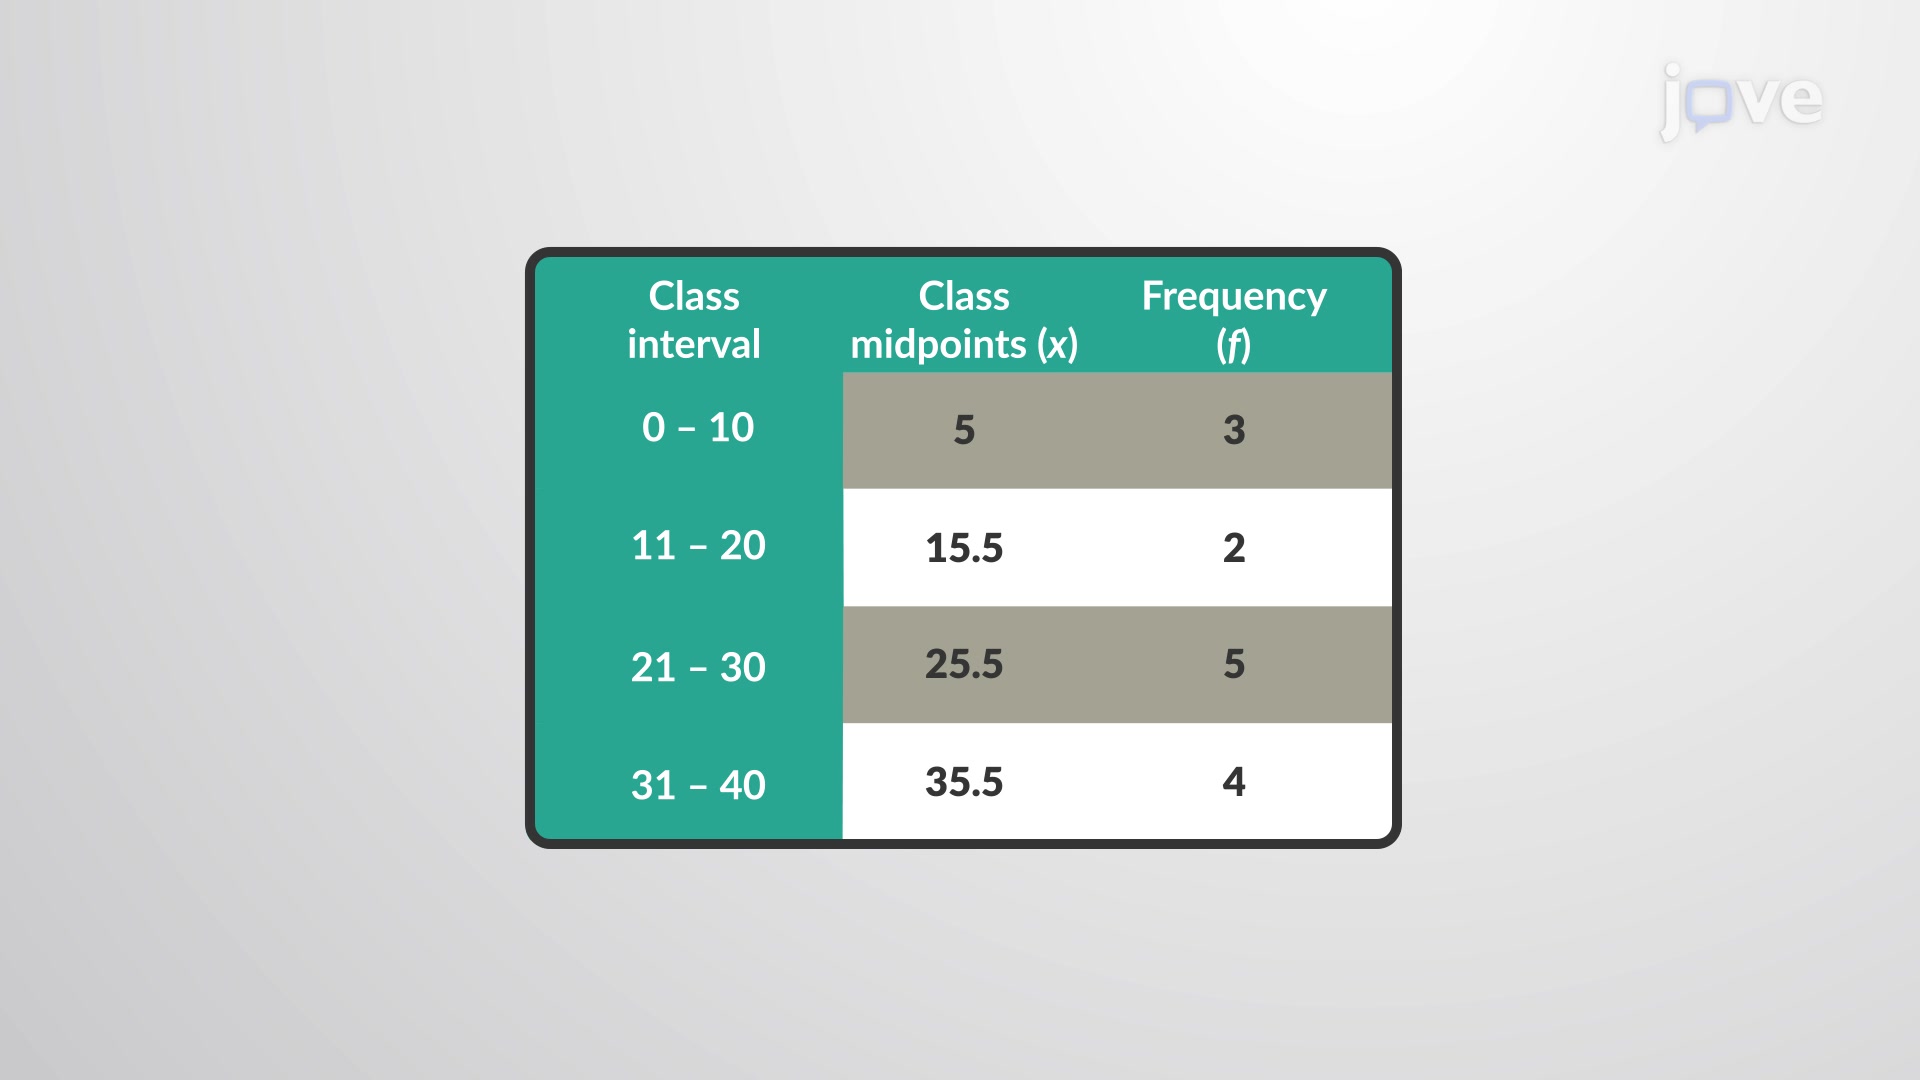
When data appears in class intervals (like age ranges 20-30, 30-40, etc.), we first calculate the midpoint of each class by adding the lower and upper boundaries and dividing by two. For the class 20-30, the midpoint equals (20+30) ÷ 2 = 25. We then treat these midpoints as our x-values and proceed with the standard frequency formula.
This concept frequently appears in college statistics courses and standardized tests. The Bureau of Labor Statistics uses frequency distributions to calculate average wages across different income brackets. Similarly, the CDC employs this method when analyzing age-grouped health data. Students preparing for the MCAT encounter these calculations in research methodology questions, while business majors apply them in market research and consumer behavior analysis.
Understanding frequency distributions provides the foundation for more advanced statistical concepts including variance, standard deviation, and probability distributions—all crucial for success in AP Statistics, college statistics courses, and graduate school entrance exams.
Frequently Asked Questions
The mean from a frequency distribution calculates averages when data values repeat multiple times by weighting each value by its frequency. Unlike simple arithmetic mean, this method accounts for how often each value occurs, making it more efficient for large datasets with repeated observations. It's essential for analyzing survey data, test scores, and any grouped statistical information.
Yes, both AP Statistics and SAT Math frequently test frequency distribution concepts. AP Statistics includes free-response questions requiring students to calculate means from grouped data and interpret results. SAT Math tests these skills in multiple-choice format, often within real-world contexts like analyzing survey results or demographic data.
Focus on practicing both discrete and grouped interval problems, memorizing the formula Σfx/Σf, and understanding when to calculate midpoints. Create formula sheets, work through textbook problems systematically, and practice identifying whether data requires simple arithmetic mean or frequency-based calculations. Most college exams emphasize formula application and interpretation rather than memorization.
Retail companies like Target use frequency distributions to calculate average purchase amounts across customer age groups for marketing strategies. Insurance companies apply these methods to determine average claim costs by demographic categories. Market research firms analyze survey responses where multiple participants select the same rating scales, requiring frequency-weighted averages for accurate insights.
This concept requires only basic arithmetic operations—multiplication, addition, and division. Students comfortable with fractions and decimals can master frequency distribution calculations. The key is understanding the logic: we're finding weighted averages that account for how often each value appears, which is actually more intuitive than complex algebraic manipulations.
Create two separate study sections: one for discrete frequency data and another for grouped class intervals. Practice identifying midpoints quickly, memorize the core formula, and work through problems step-by-step without rushing. Use real datasets from sports statistics or grade distributions to make practice more engaging and memorable.
Progress to calculating variance and standard deviation from frequency distributions, then explore median and mode with grouped data. These concepts build naturally toward understanding normal distributions, confidence intervals, and hypothesis testing—all crucial for advanced statistics courses and standardized test success.
Related Micro-courses


Related Subjects


