Loading…
Loading video…
220,300 views
Did you know that when Amazon analyzes customer purchase patterns across different price ranges, they're using cumulative frequency distribution? This statistical tool helps us understand how many observations fall below specific values in a dataset. The cumulative frequency distribution definition involves adding up frequencies progressively to show running totals at each data point. Watch the full video on JoVE Coach to master this concept with expert-led visuals and step-by-step explanations.
Cumulative frequency distribution represents one of the most practical tools in descriptive statistics, showing the running total of frequencies up to each class interval. Unlike a standard frequency distribution that shows how many observations fall within specific ranges, cumulative frequency tells us how many observations fall below (or above) certain values. This cumulative frequency distribution overview reveals its power in answering questions like "How many students scored below 85%" or "What percentage of customers spent less than $100?"
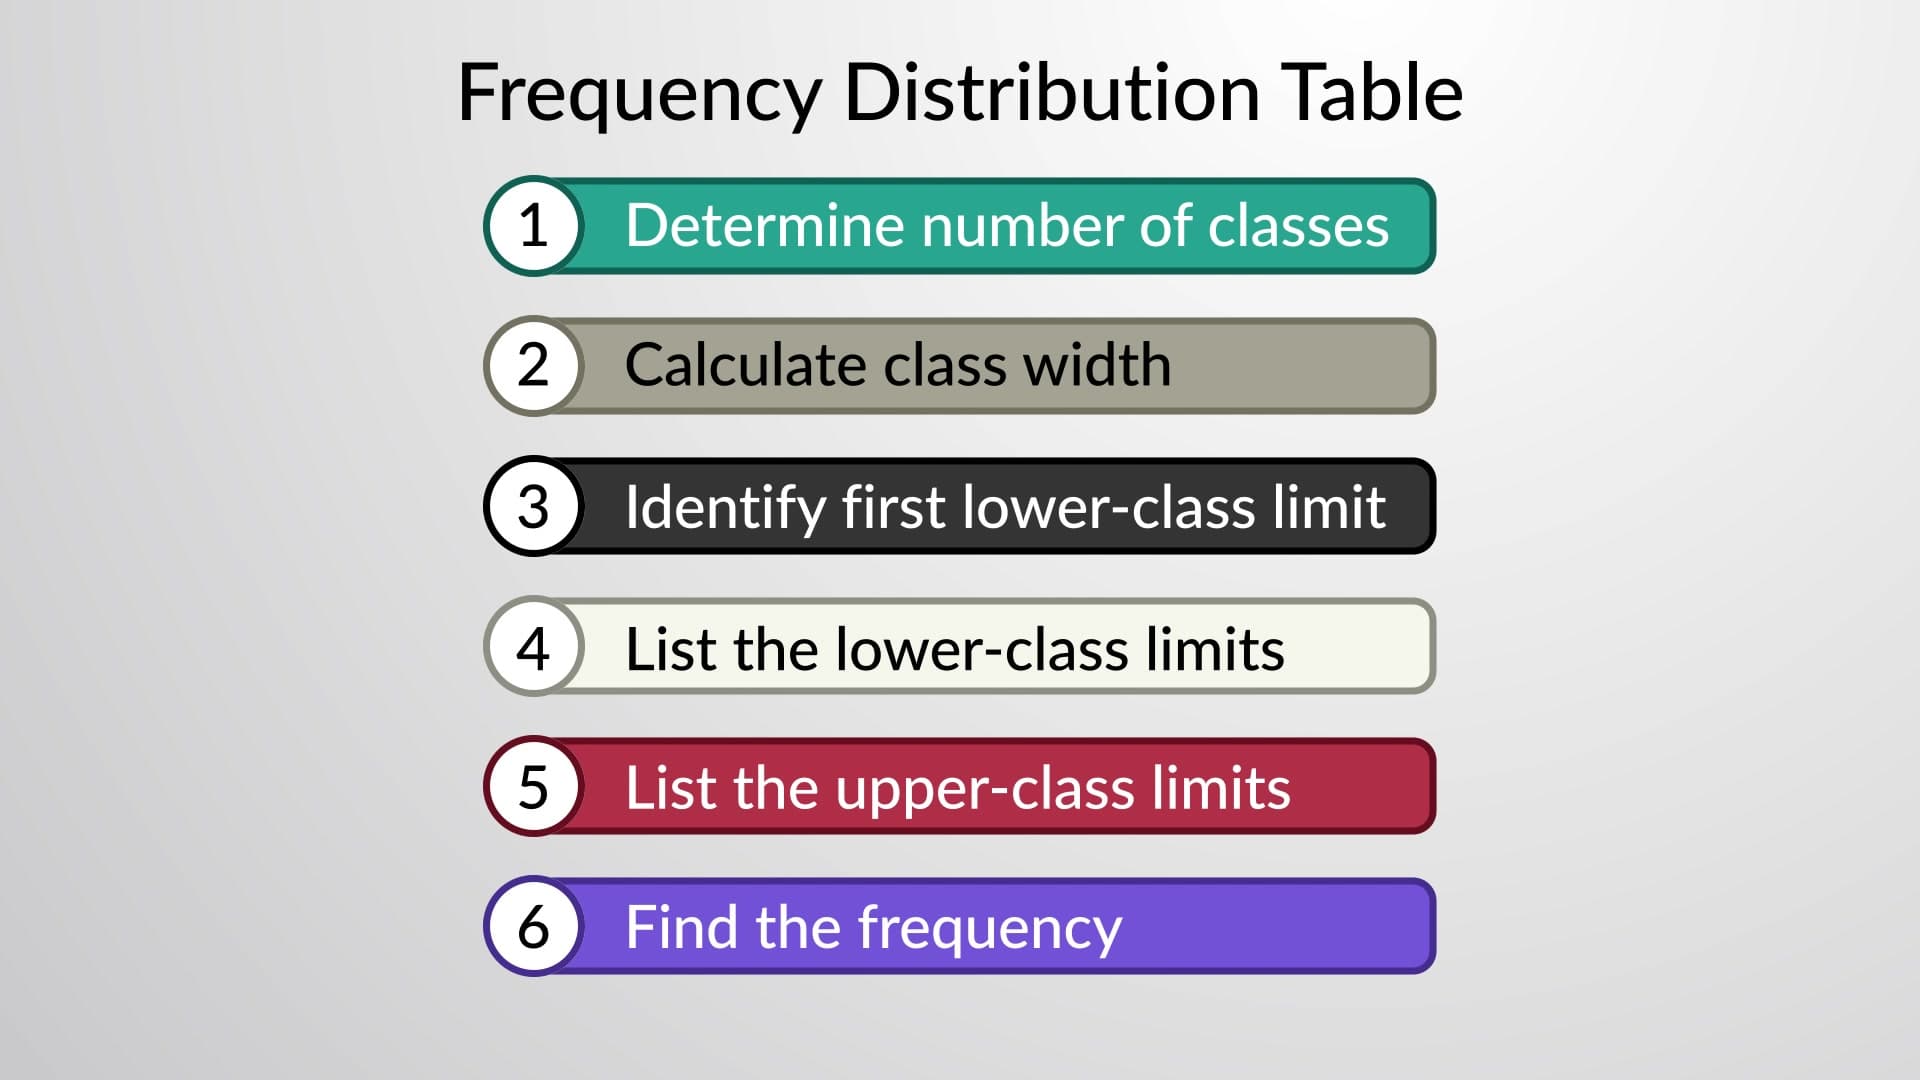
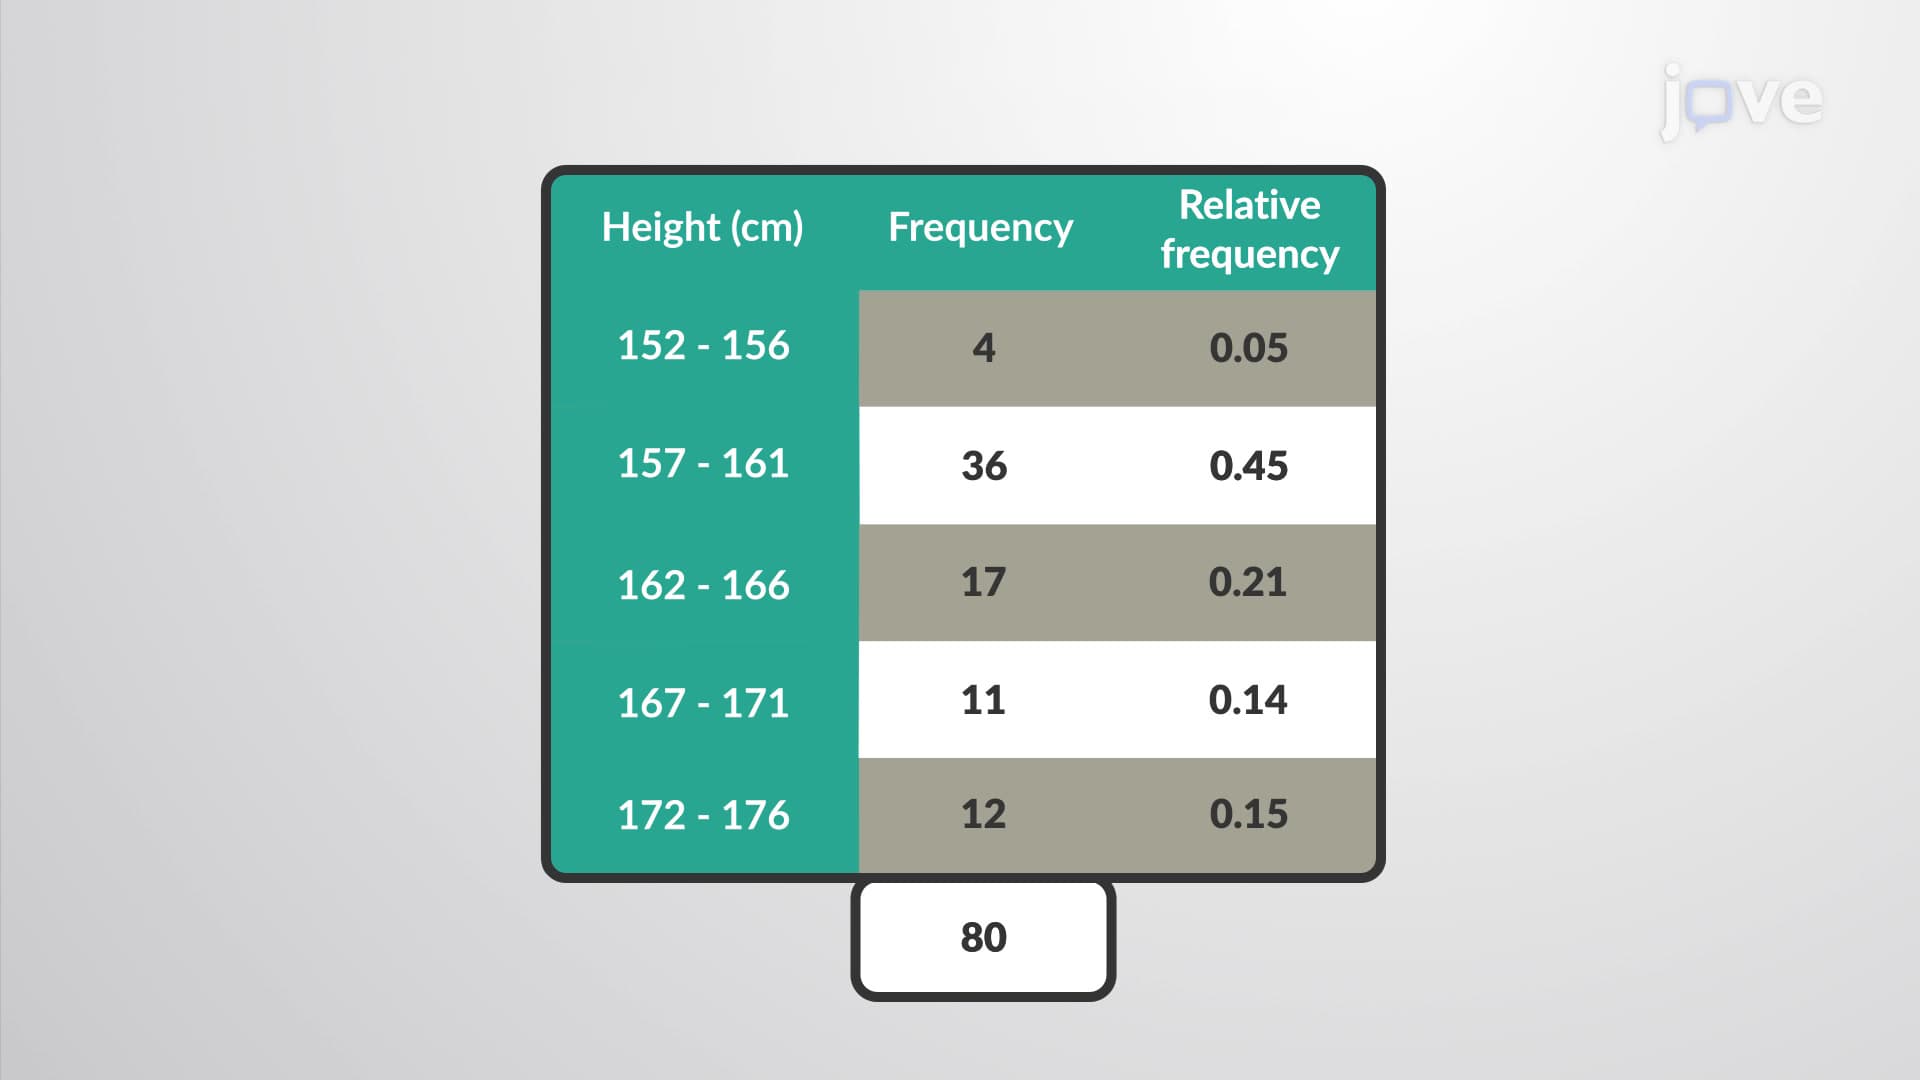
The cumulative frequency distribution basics begin with organizing data into class intervals. Each cumulative frequency equals the sum of the current class frequency plus all previous class frequencies. For example, if analyzing SAT scores where 50 students scored 400-499, 75 scored 500-599, and 100 scored 600-699, the cumulative frequencies would be 50, 125 (50+75), and 225 (125+100) respectively. This progressive addition creates a clear picture of data accumulation across ranges.
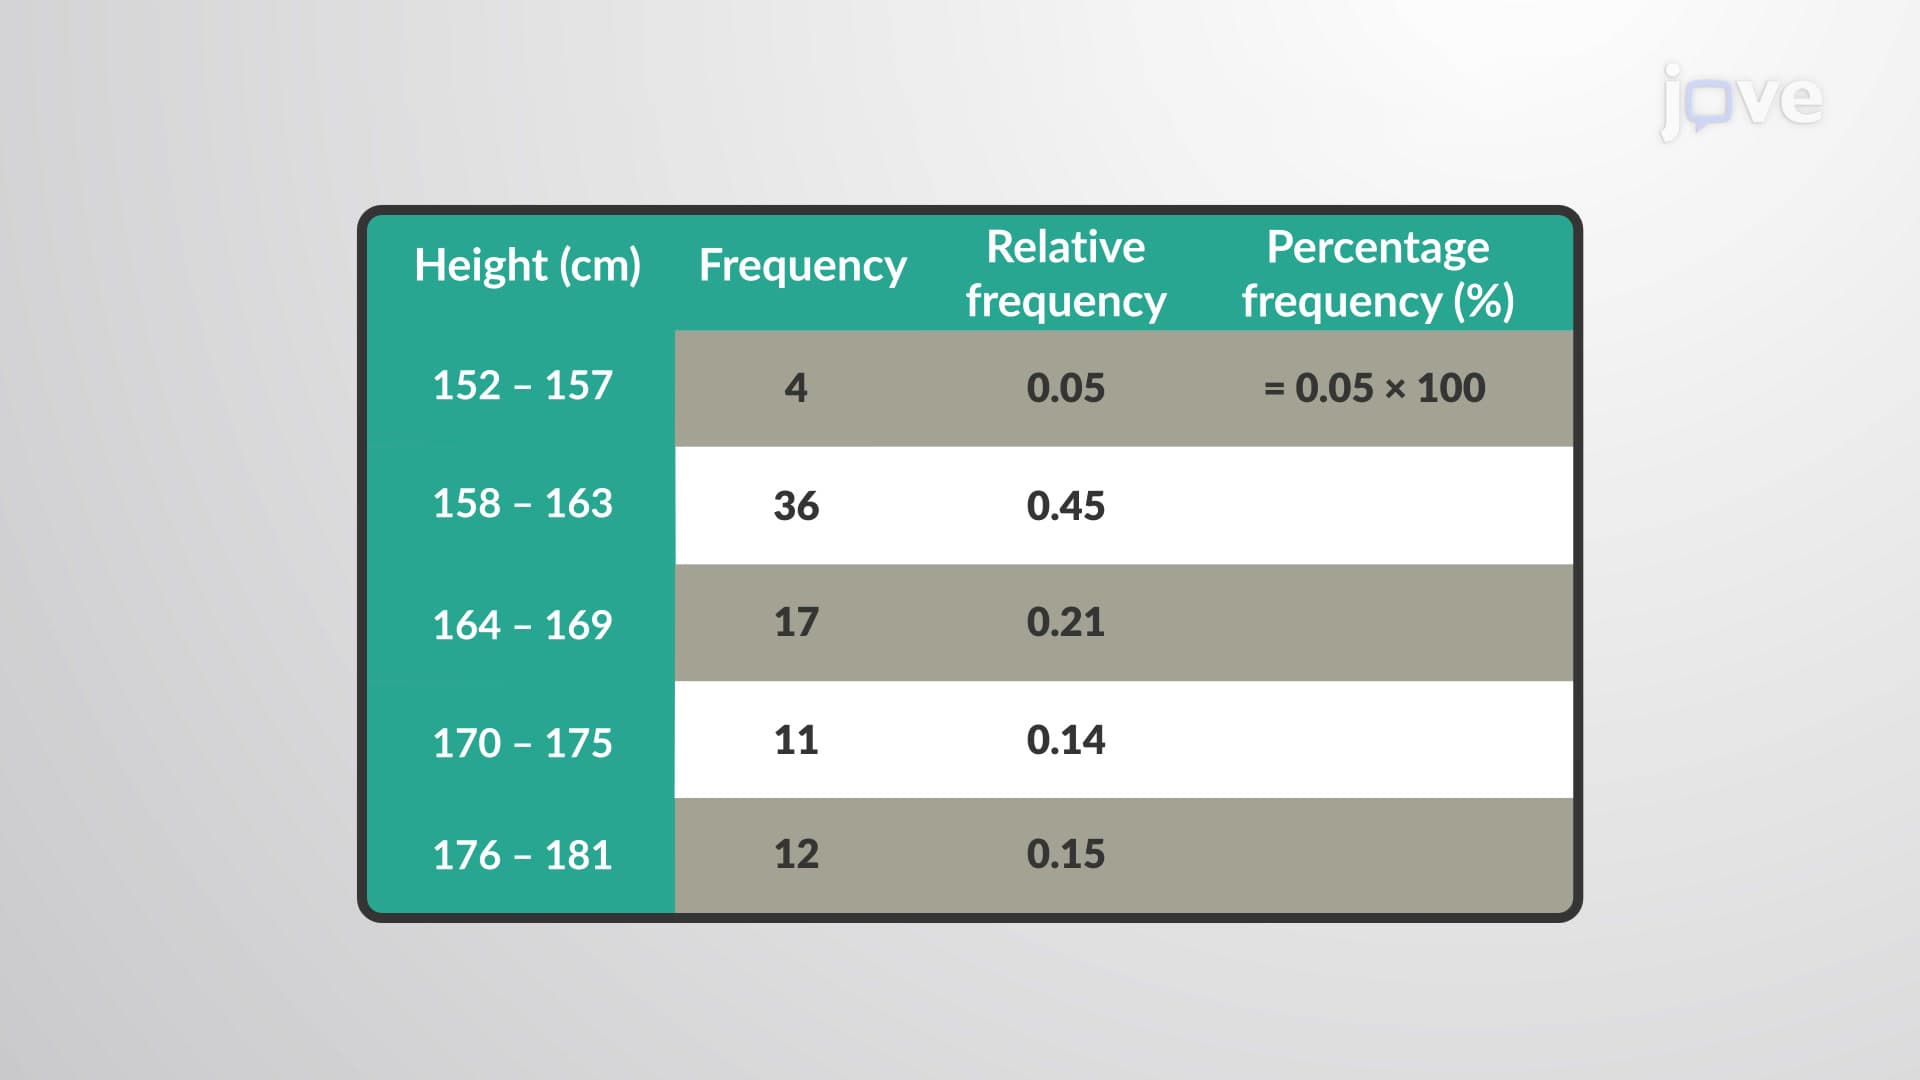
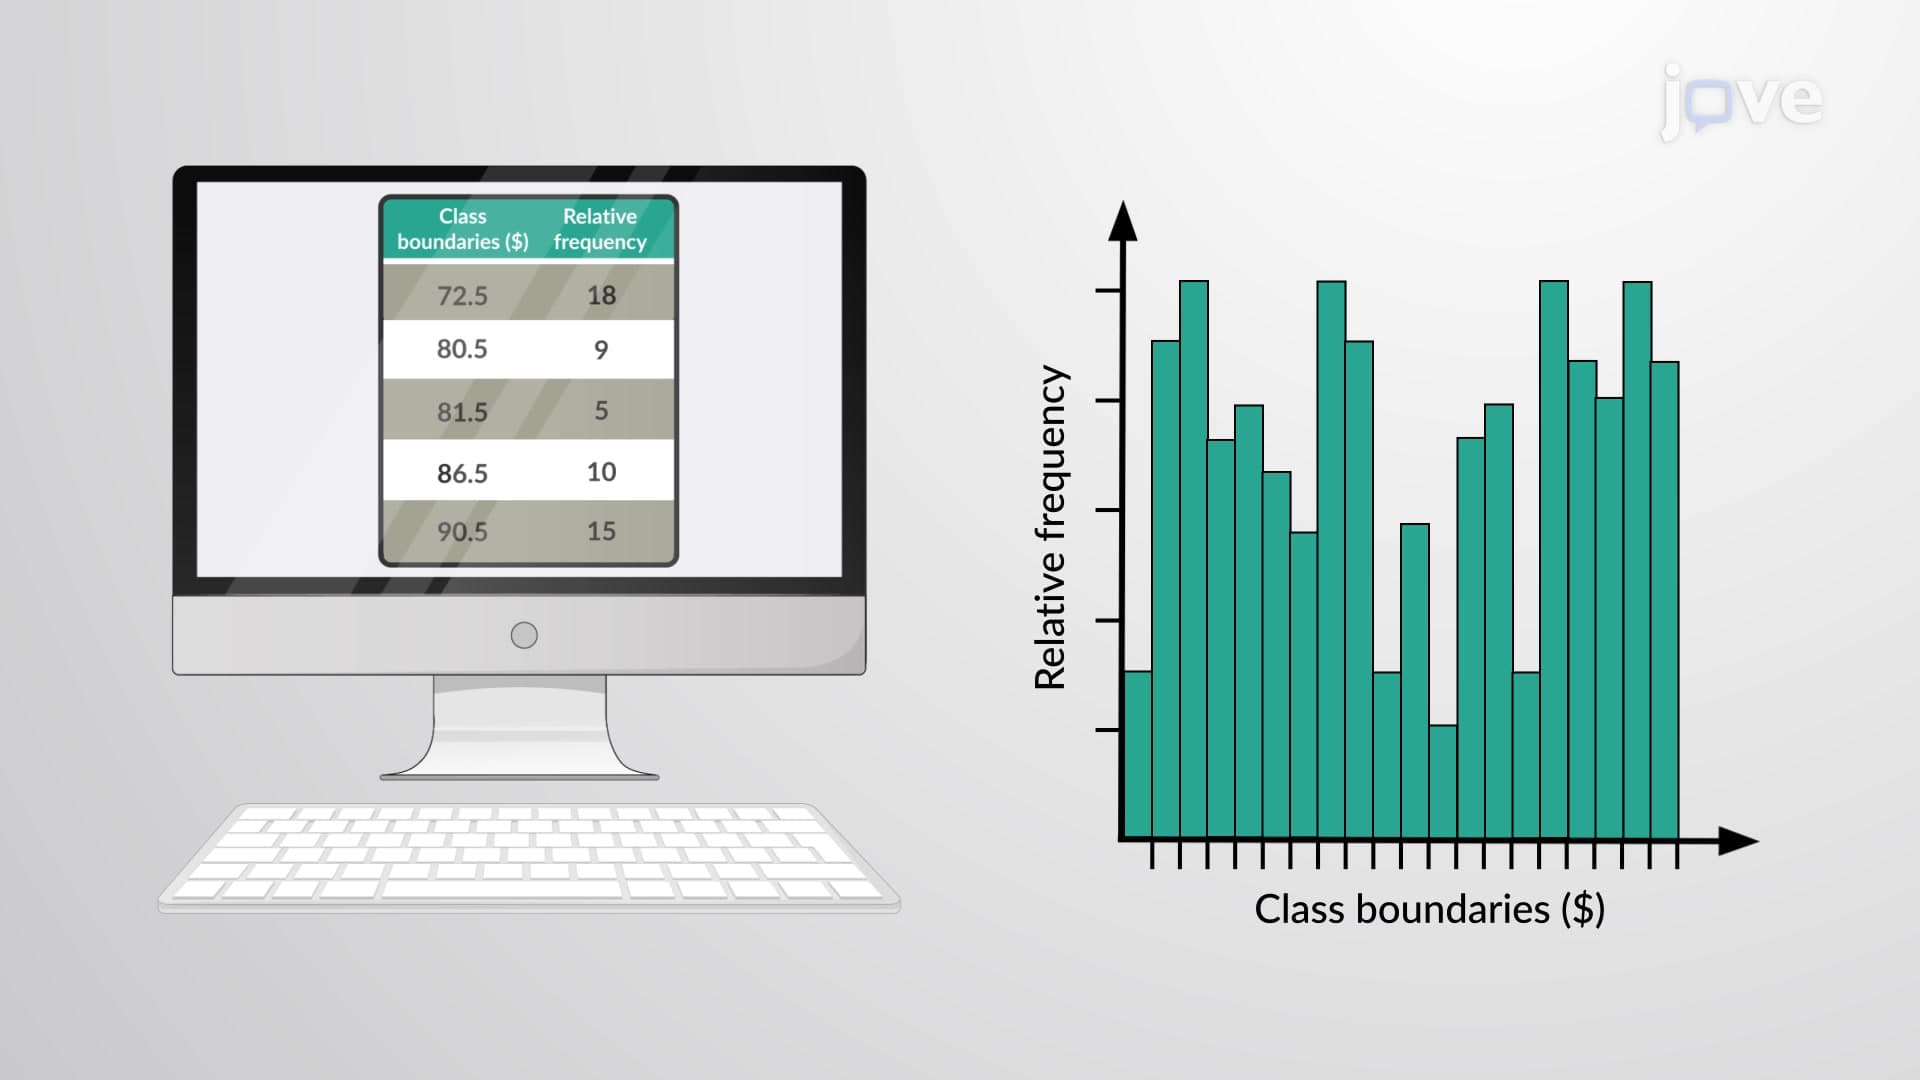
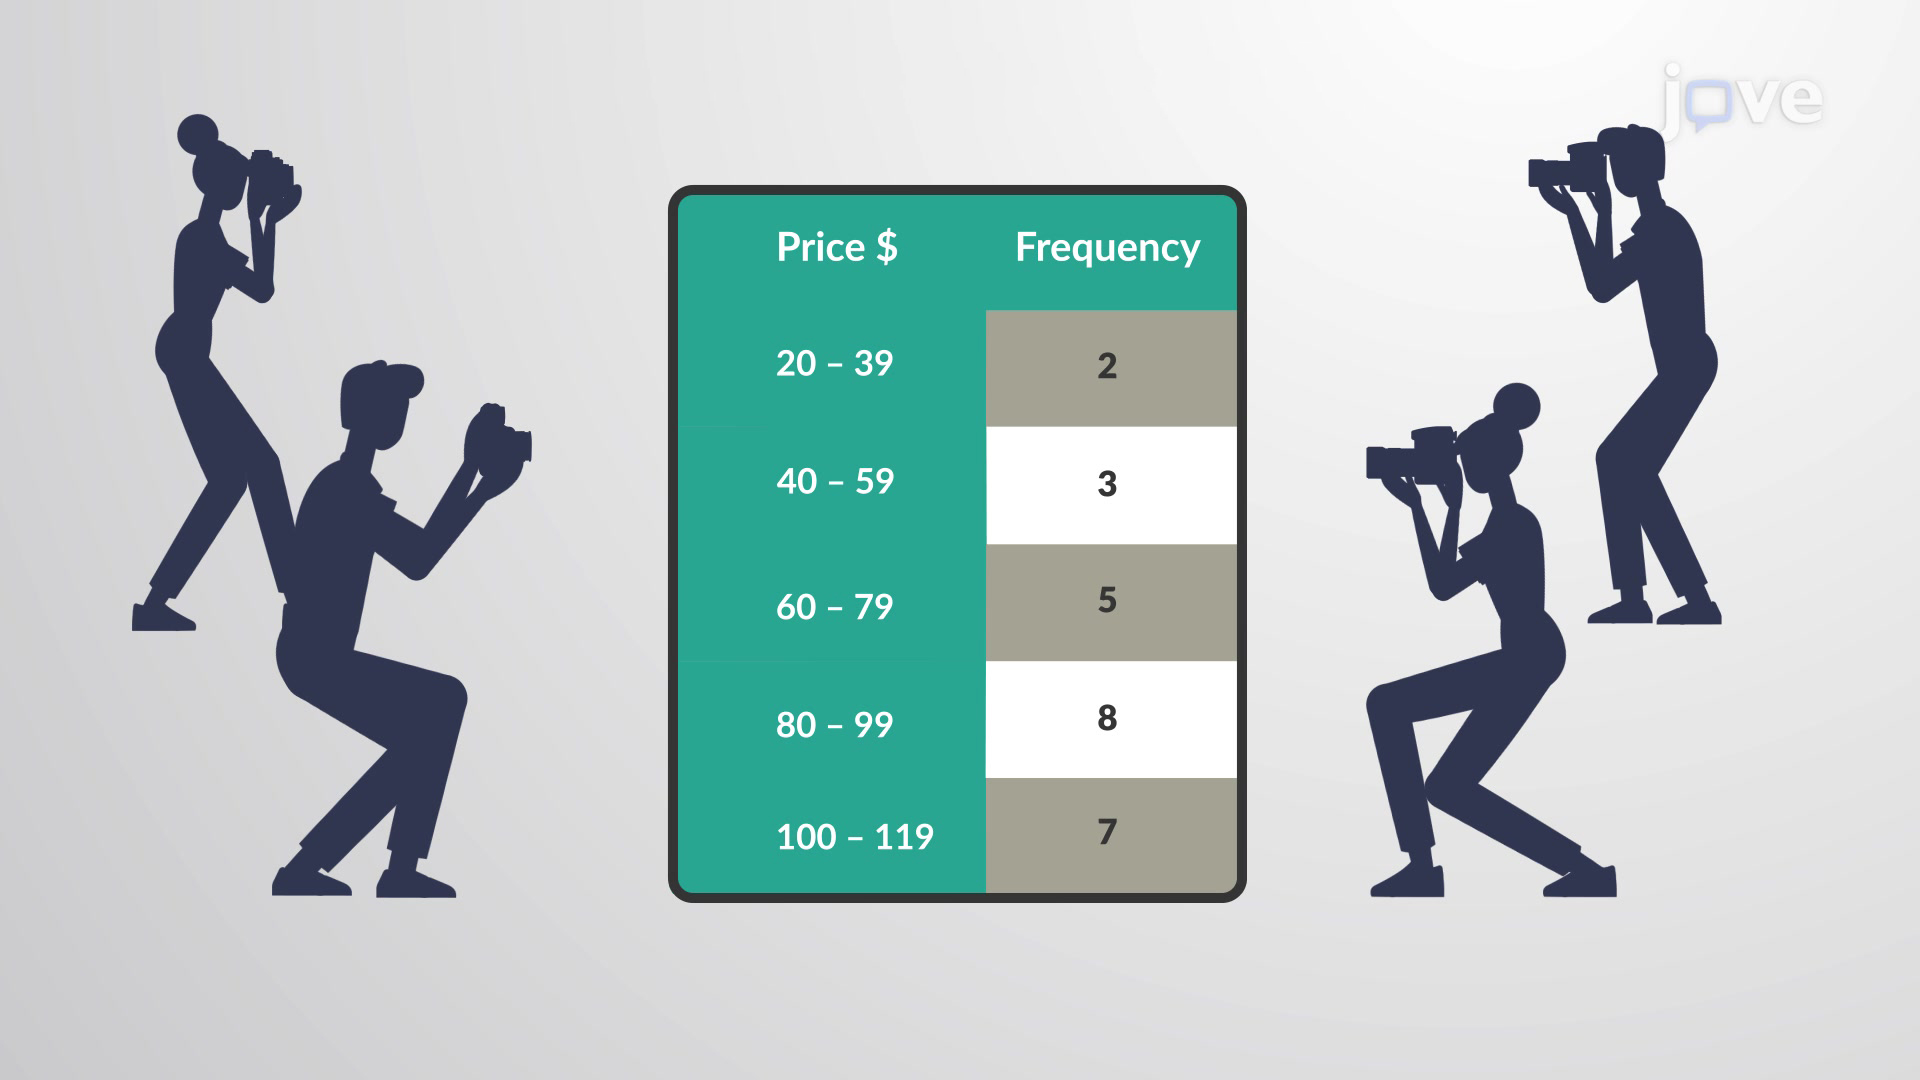
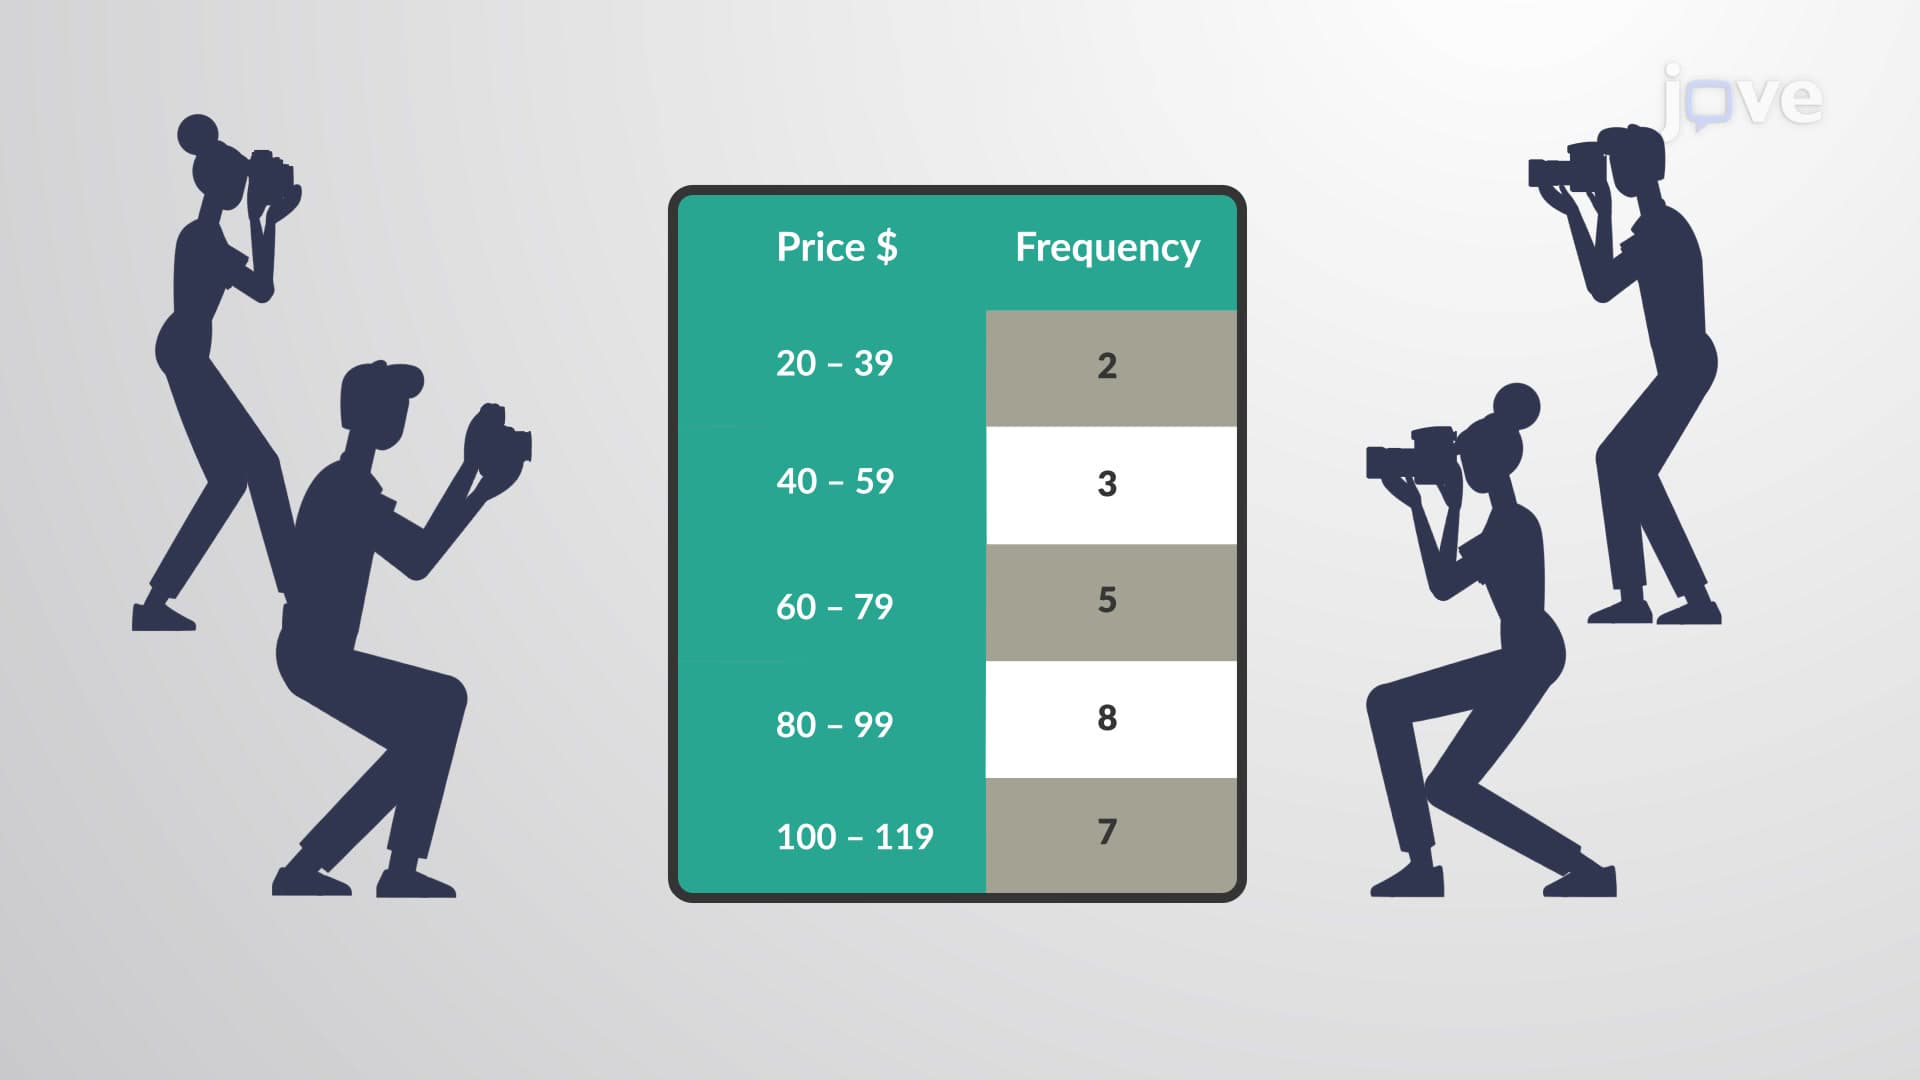
The cumulative frequency distribution concept requires careful attention to class boundaries. When classes like 40-59 and 60-79 appear to have gaps, we calculate boundaries by finding midpoints between adjacent class limits. This creates continuous boundaries essential for accurate cumulative frequency graphs. In the camera price example, boundaries of 39.5, 59.5, 79.5 eliminate artificial gaps and provide precise cumulative frequency calculations.
Understanding cumulative frequency distribution proves invaluable across multiple domains. In healthcare, hospitals track cumulative patient wait times to improve service delivery. Educational institutions use cumulative GPA distributions to establish admission cutoffs. This cumulative frequency distribution study guide preparation proves essential for AP Statistics, college statistics courses, and standardized tests like the MCAT where data interpretation questions frequently appear. Students encounter these concepts in psychology research methods, business analytics, and economics courses throughout their undergraduate studies.
Frequently Asked Questions
Cumulative frequency distribution shows running totals of how many data points fall below each value or class limit. It's like keeping a running score that adds up frequencies progressively. This creates a complete picture of data accumulation from lowest to highest values.
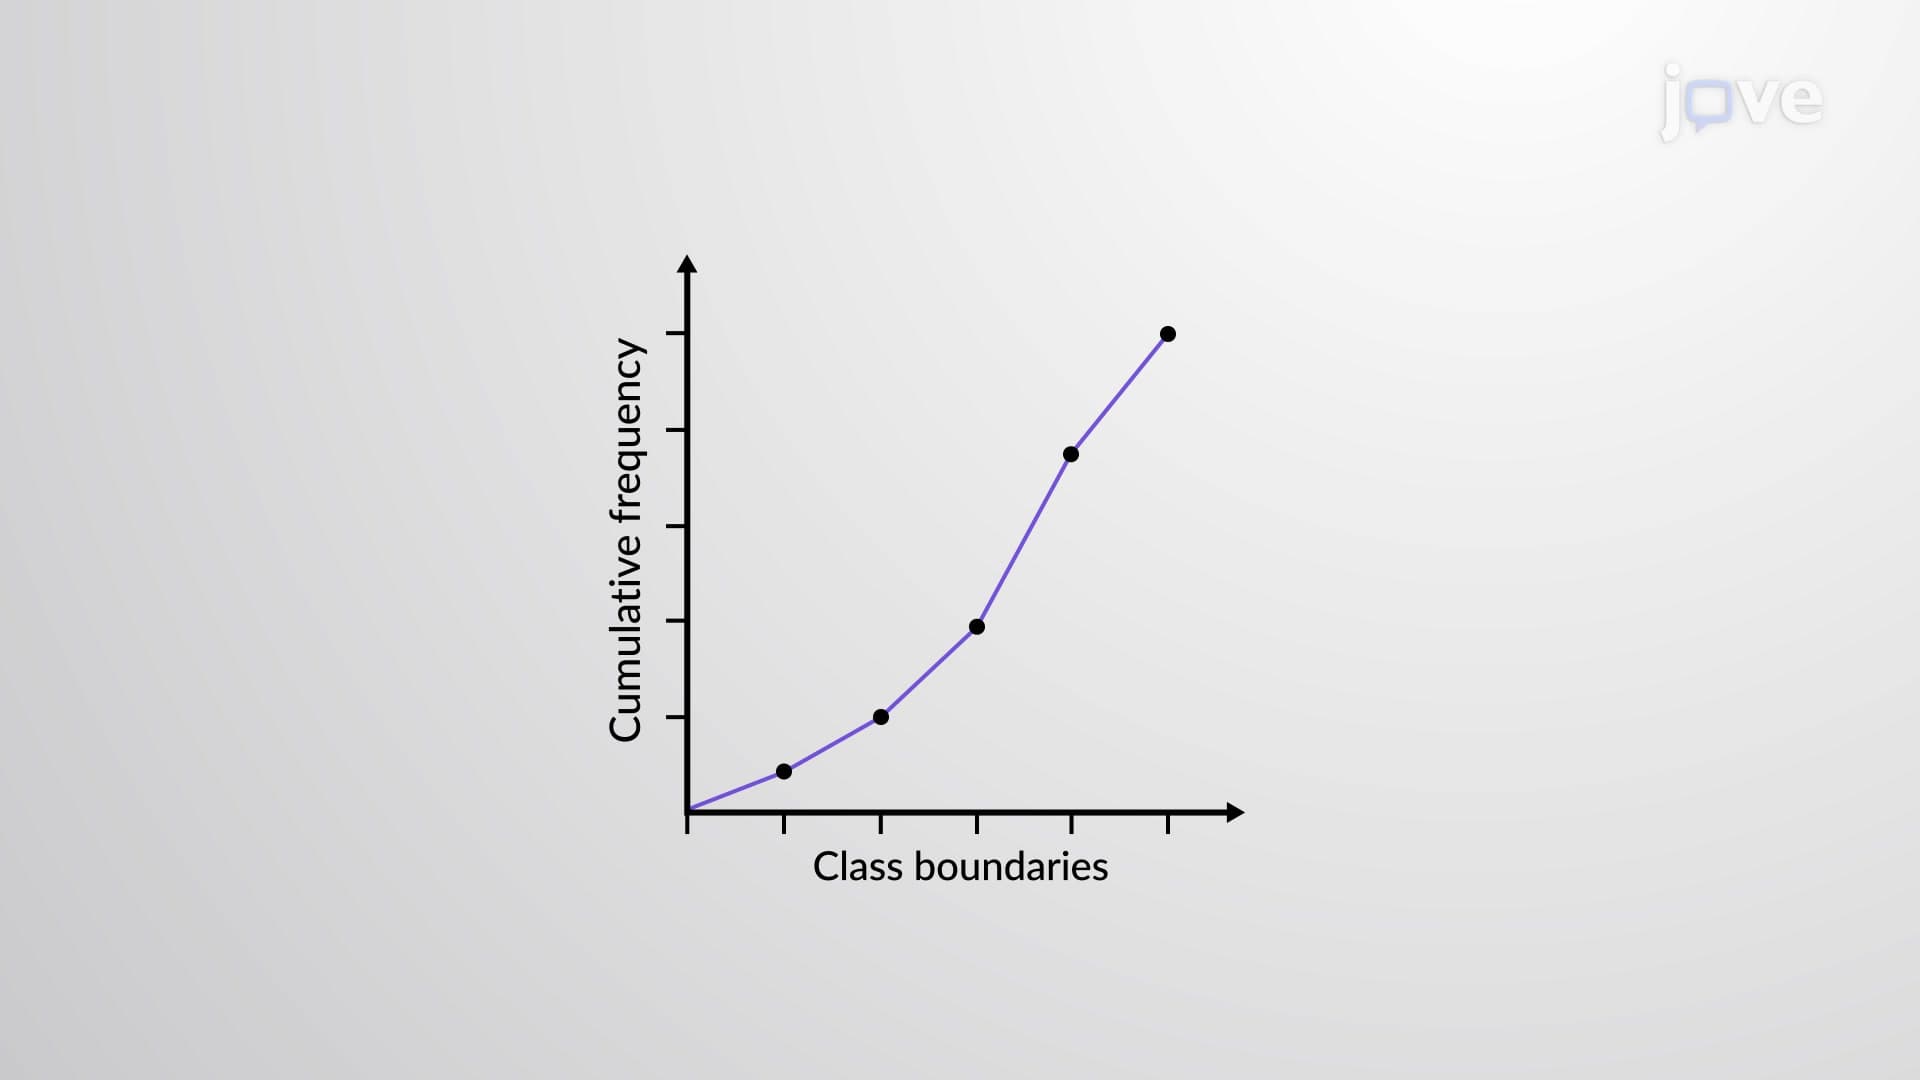
In detail, cumulative frequency distribution involves systematic addition of frequencies across ordered classes, creating class boundaries for continuity, and often displaying results as ogive curves. It connects to percentile calculations, quartile determination, and forms the foundation for empirical probability distributions in advanced statistical analysis.
AP Statistics frequently tests cumulative frequency through ogive interpretation, percentile calculations, and data analysis questions. Students must read cumulative frequency tables, create ogive graphs, and use them to find median values. Practice with College Board released exams shows these concepts in free-response questions worth significant points.
Absolutely - it's fundamental to inferential statistics, hypothesis testing, and probability theory in college courses. Universities like UCLA and University of Michigan emphasize these concepts in introductory statistics. Mastering cumulative frequency creates a strong foundation for advanced topics like confidence intervals and distribution functions.
Retail companies like Target use cumulative frequency to analyze customer spending patterns and inventory management. Banks apply it to loan approval processes by examining cumulative income distributions. Healthcare systems track cumulative patient response times to optimize staffing and resource allocation.
Not at all - it builds on basic addition skills you already have. Start with simple examples using small datasets, then progress to more complex class intervals. The concept becomes intuitive once you practice with real data like test scores or survey responses from your own experiences.
Create practice problems using familiar scenarios like class grades or sports statistics. Draw both frequency and cumulative frequency tables side-by-side to see the relationship. Practice reading and creating ogive graphs, focusing on finding specific percentiles and interpreting real-world meaning of the cumulative values.
Progress to percentiles and quartiles, then explore normal distributions and z-scores. These naturally extend cumulative frequency concepts into probability theory. Box plots and descriptive statistics also build directly on cumulative frequency understanding, preparing you for advanced inferential statistics.
Related Micro-courses

Related Subjects
 Physics 33 micro-courses›
 Math Fundamentals 11 micro-courses›