Loading…
Loading video…
220,300 views
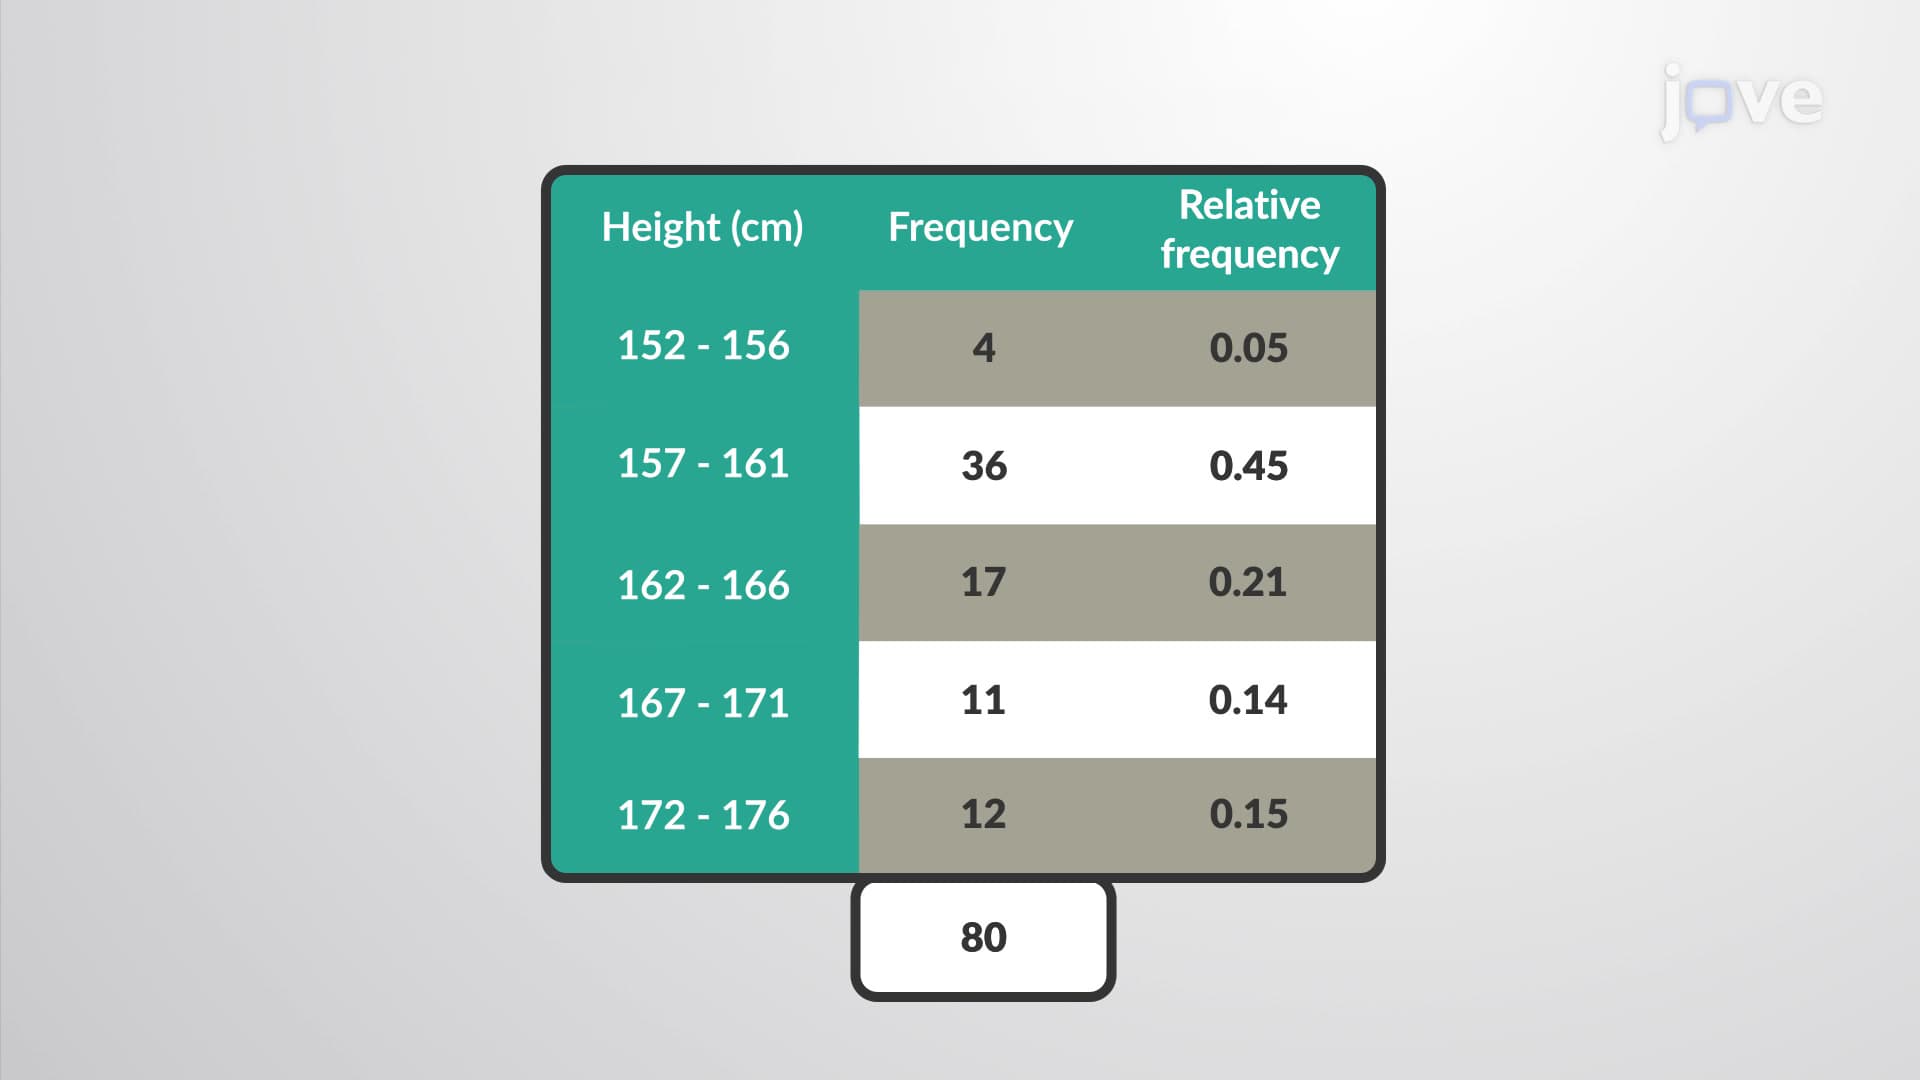
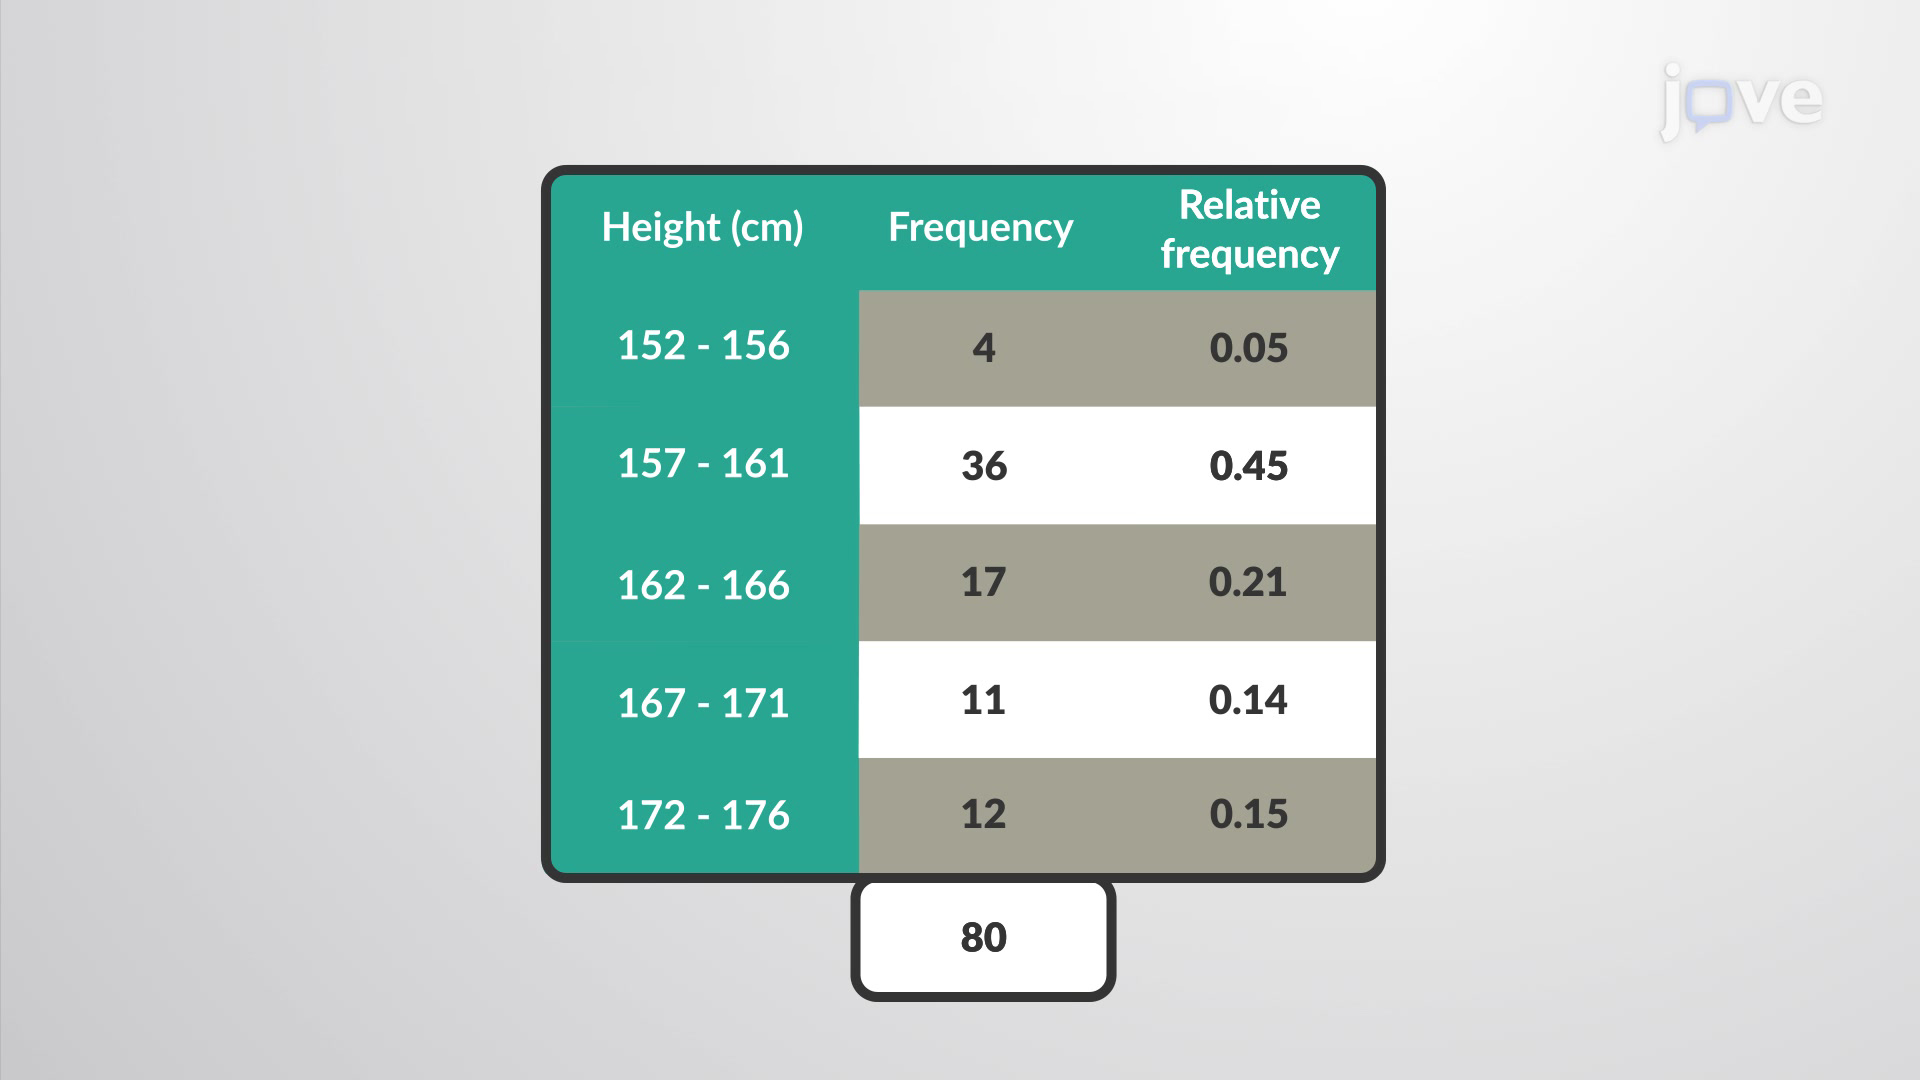
Ever wondered why NBA teams analyze player shooting percentages instead of just counting made shots? A relative frequency distribution transforms raw data counts into meaningful proportions, revealing patterns invisible in absolute numbers. This statistical tool converts frequency data into ratios that sum to 1.0, making comparisons across different sample sizes possible. For instance, comparing ACT score distributions between a 50-student class and a 500-student district becomes straightforward when using relative frequencies. Watch the full video on JoVE Coach to master this concept with expert-led visuals and step-by-step explanations.
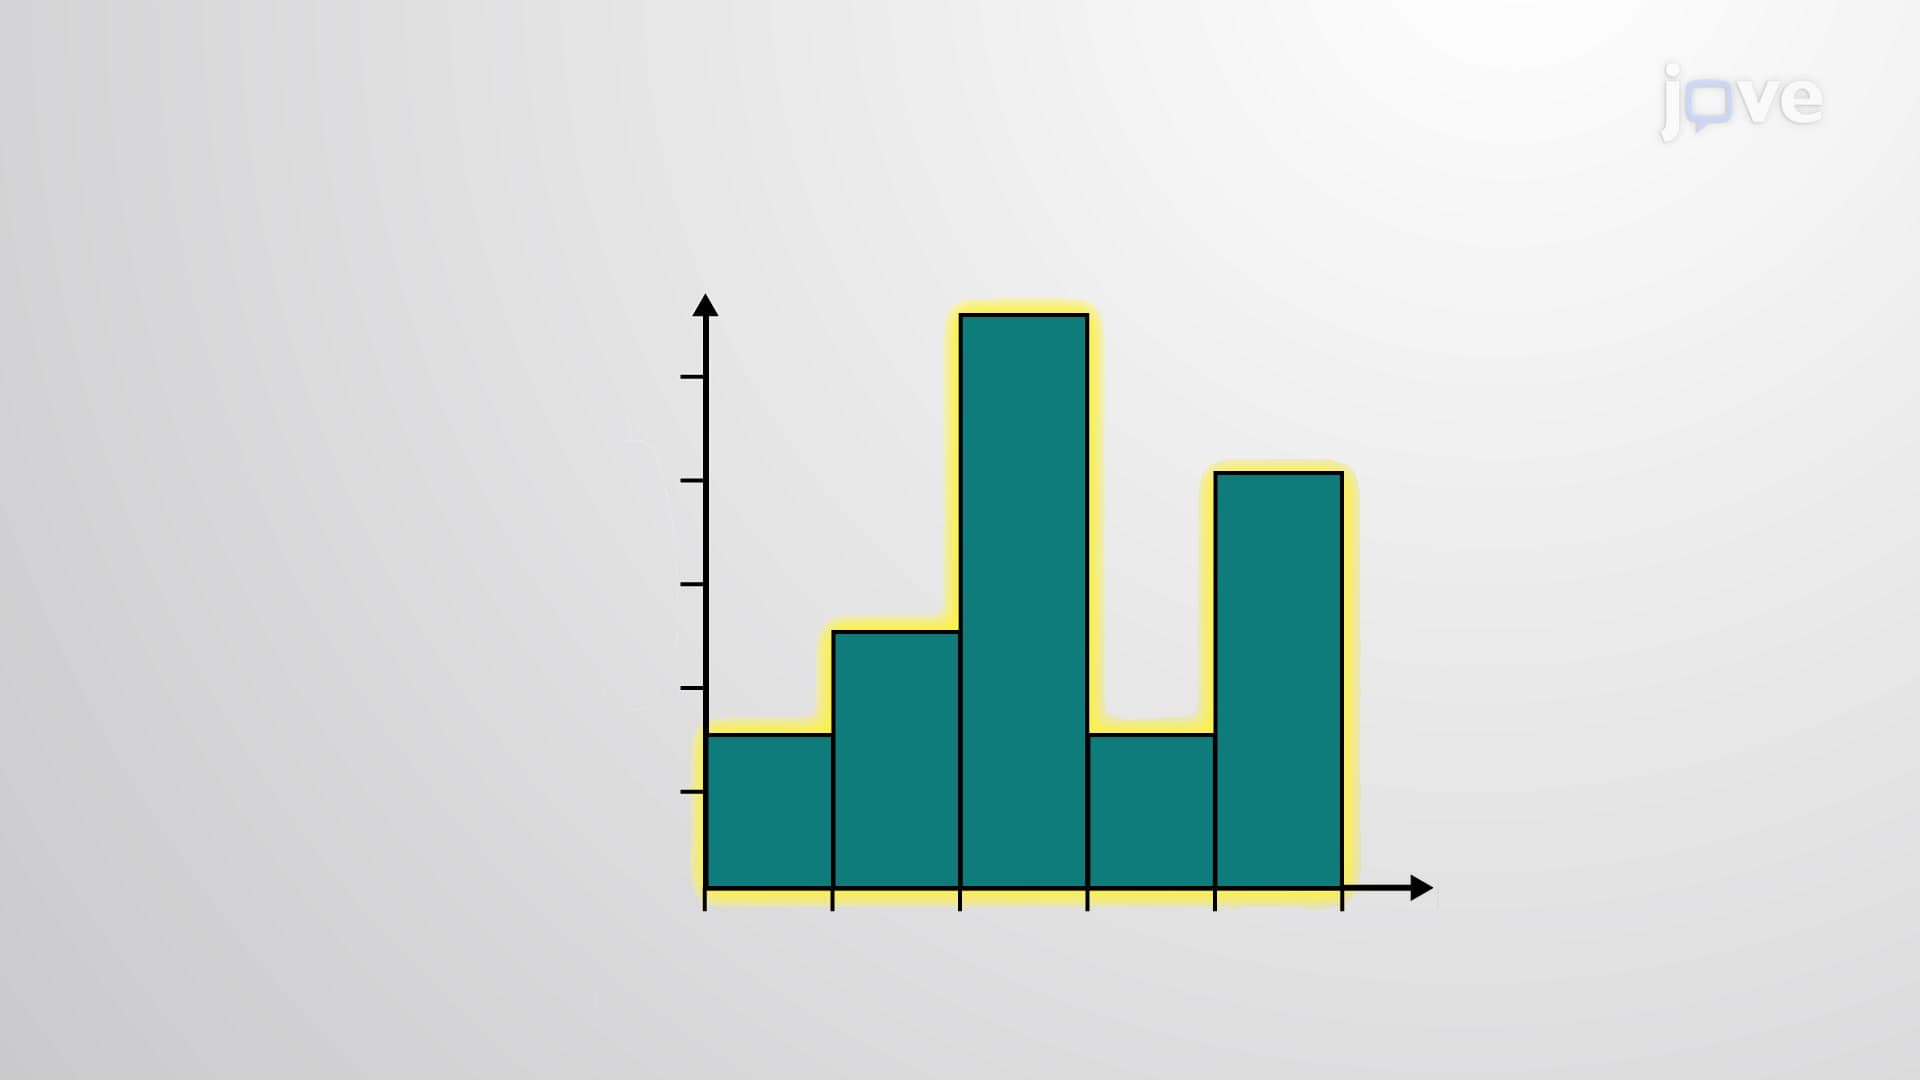
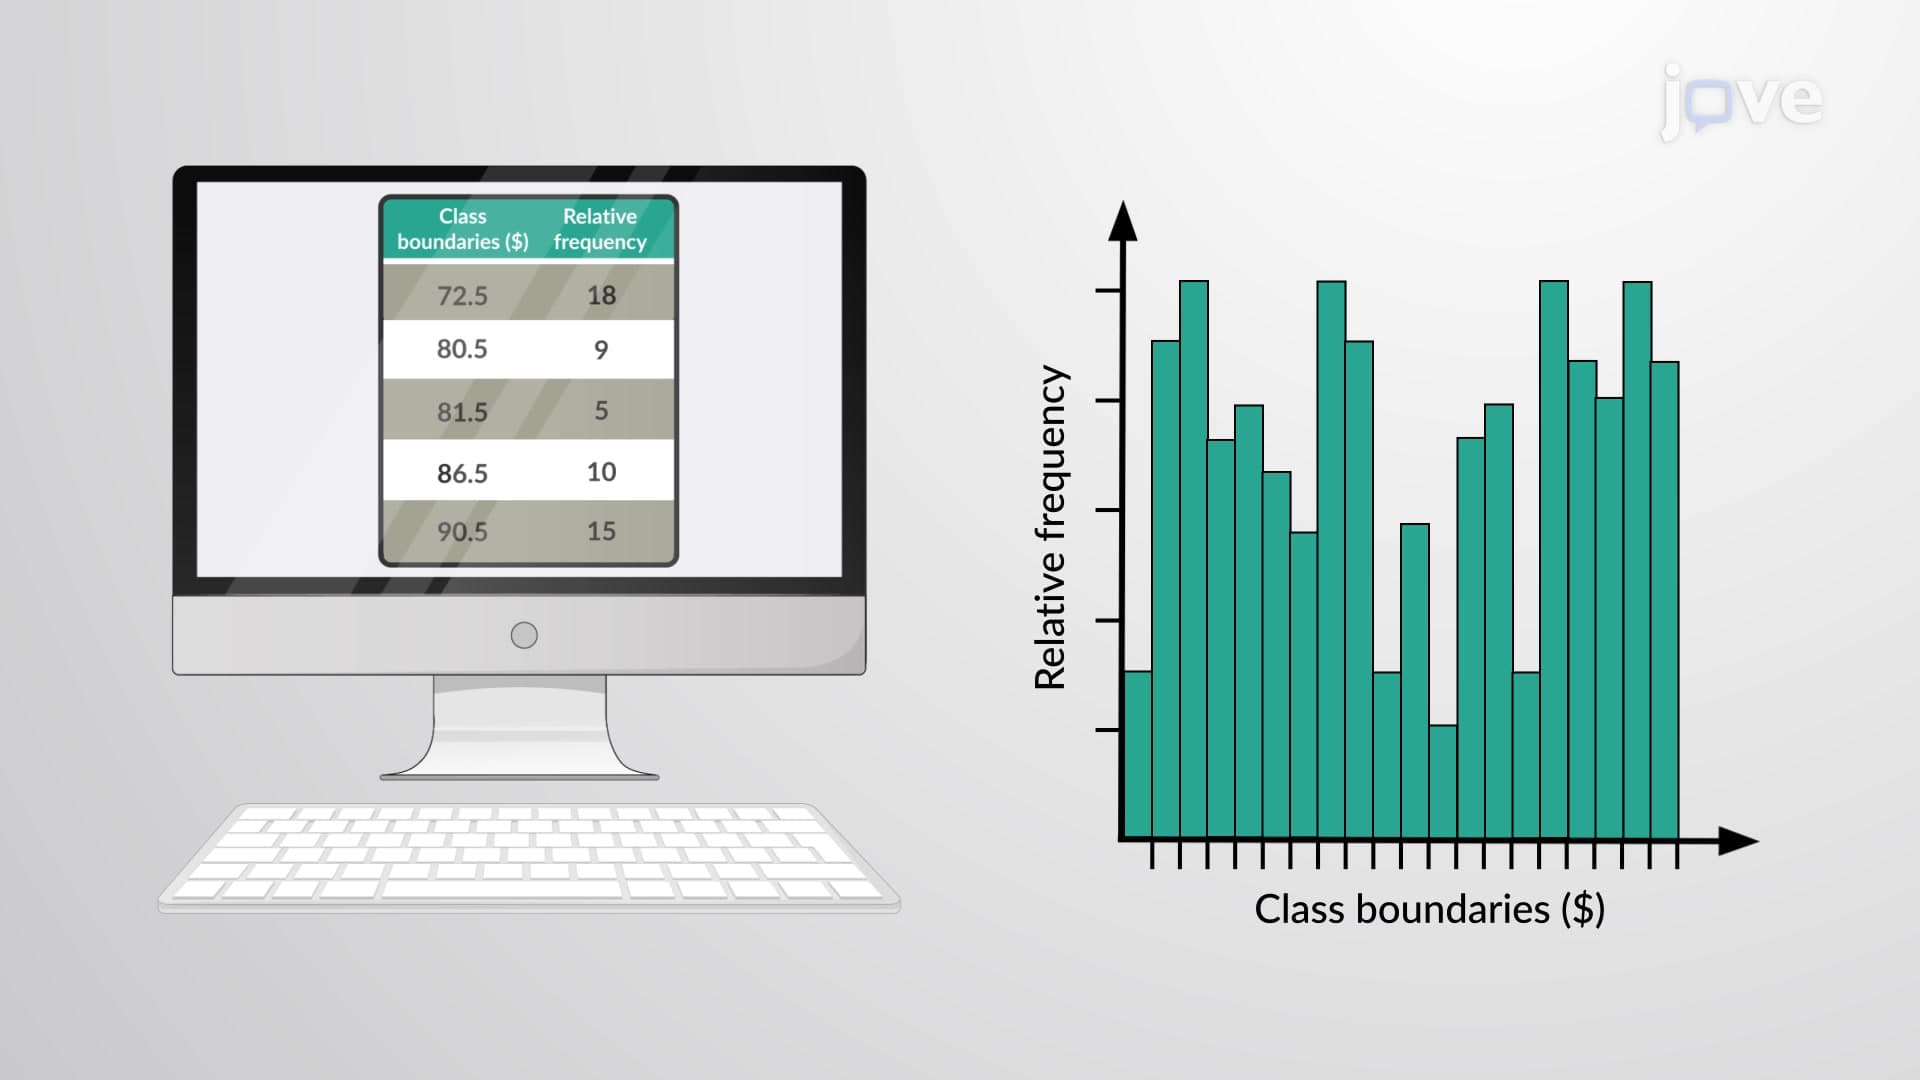
A relative frequency distribution represents one of statistics' most practical tools for data analysis. While a standard frequency distribution shows raw counts of observations in each category, a relative frequency distribution converts these counts into proportions or percentages. This transformation reveals the relative importance of each category within the entire dataset, making patterns more apparent and comparisons more meaningful.
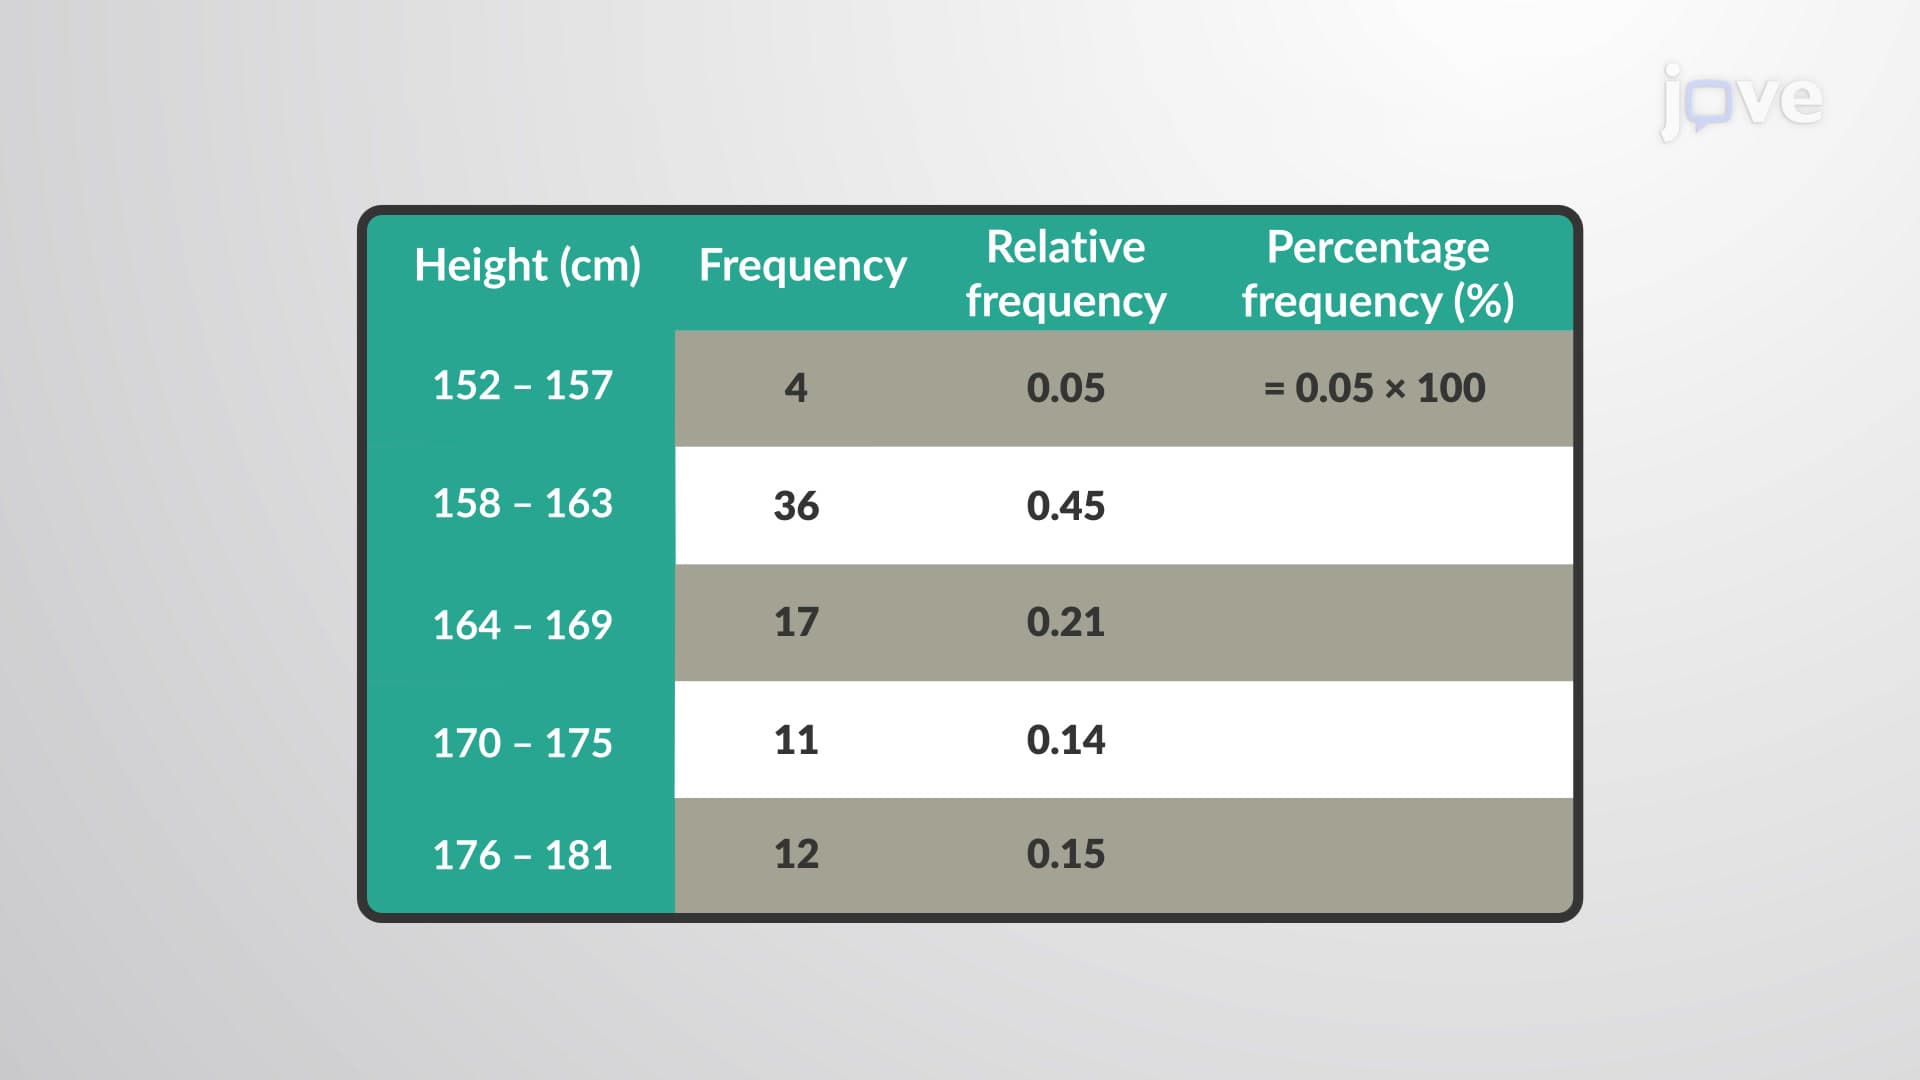
The calculation process involves dividing each frequency value by the total sample size. If a dataset contains 200 observations and a particular category has 40 occurrences, the relative frequency equals 40/200 = 0.20 or 20%. This standardization proves invaluable when analyzing datasets of varying sizes or comparing multiple distributions.
Relative frequency distributions appear extensively in US educational assessments. Consider SAT score distributions: rather than reporting that 1,500 students scored between 1400-1500, colleges examine what percentage of test-takers achieved this range. This relative frequency approach enables meaningful comparisons between different testing years, geographic regions, or demographic groups, regardless of varying sample sizes.
In medical research, relative frequency distributions help analyze treatment outcomes. A clinical trial might report that 15% of patients experienced specific side effects, rather than stating "30 out of 200 patients." This proportion-based reporting facilitates comparisons across different studies and patient populations, supporting evidence-based medical decisions.
Every relative frequency distribution exhibits specific mathematical properties. The sum of all relative frequencies must equal 1.0 (or 100% when expressed as percentages). Minor deviations from this rule typically result from rounding errors rather than calculation mistakes. Each individual relative frequency falls between 0 and 1, where 0 indicates no occurrences and 1 means all observations belong to that single category.
Students preparing for AP Statistics exams should master these interpretations. A relative frequency of 0.35 means 35% of observations fall within that category, while 0.03 indicates only 3% belong to that group. These proportions provide immediate insights into data distribution patterns.
Relative frequency distributions serve as stepping stones toward probability theory and inferential statistics. As sample sizes increase, relative frequencies approximate theoretical probabilities, forming the foundation for statistical inference. This connection proves crucial for students advancing to college-level statistics courses, where relative frequencies become sampling distributions and confidence intervals.
Frequently Asked Questions
A relative frequency distribution shows the proportion or percentage of observations in each category, while regular frequency distribution shows raw counts. Relative frequencies are calculated by dividing each frequency by the total sample size, creating standardized values between 0 and 1 that facilitate meaningful comparisons across different datasets.
AP Statistics commonly tests relative frequency calculations, interpretation, and graphical representations through multiple-choice and free-response questions. College statistics courses emphasize connecting relative frequencies to probability concepts and using them in hypothesis testing. Students must demonstrate both computational skills and conceptual understanding.
MCAT questions often embed relative frequency concepts within biological and chemical contexts, such as analyzing genetic trait distributions or experimental outcome frequencies. Test-takers must interpret relative frequency tables and graphs to draw conclusions about population characteristics or research findings.
Small deviations from 1.0 typically result from rounding individual relative frequencies to two or three decimal places. The underlying mathematical principle requires the sum to equal exactly 1.0, but practical calculations introduce minor rounding errors that don't affect interpretation or analysis.
Companies like Nielsen and Gallup use relative frequency distributions to report survey results, such as "35% of Americans prefer brand A" rather than raw counts. This approach enables comparisons across different demographic groups, geographic regions, and time periods, supporting strategic business decisions and marketing campaigns.
Basic arithmetic and fraction skills suffice for mastering relative frequency distributions. Students need comfort with division, decimals, and percentages, but no calculus or advanced algebra knowledge is required. The concept builds naturally from elementary statistical foundations.
Practice creating relative frequency tables from raw data, interpreting existing distributions, and connecting relative frequencies to real-world contexts. Focus on understanding why we convert frequencies to relative frequencies rather than memorizing formulas. Work through diverse examples from sports, academics, and scientific research.
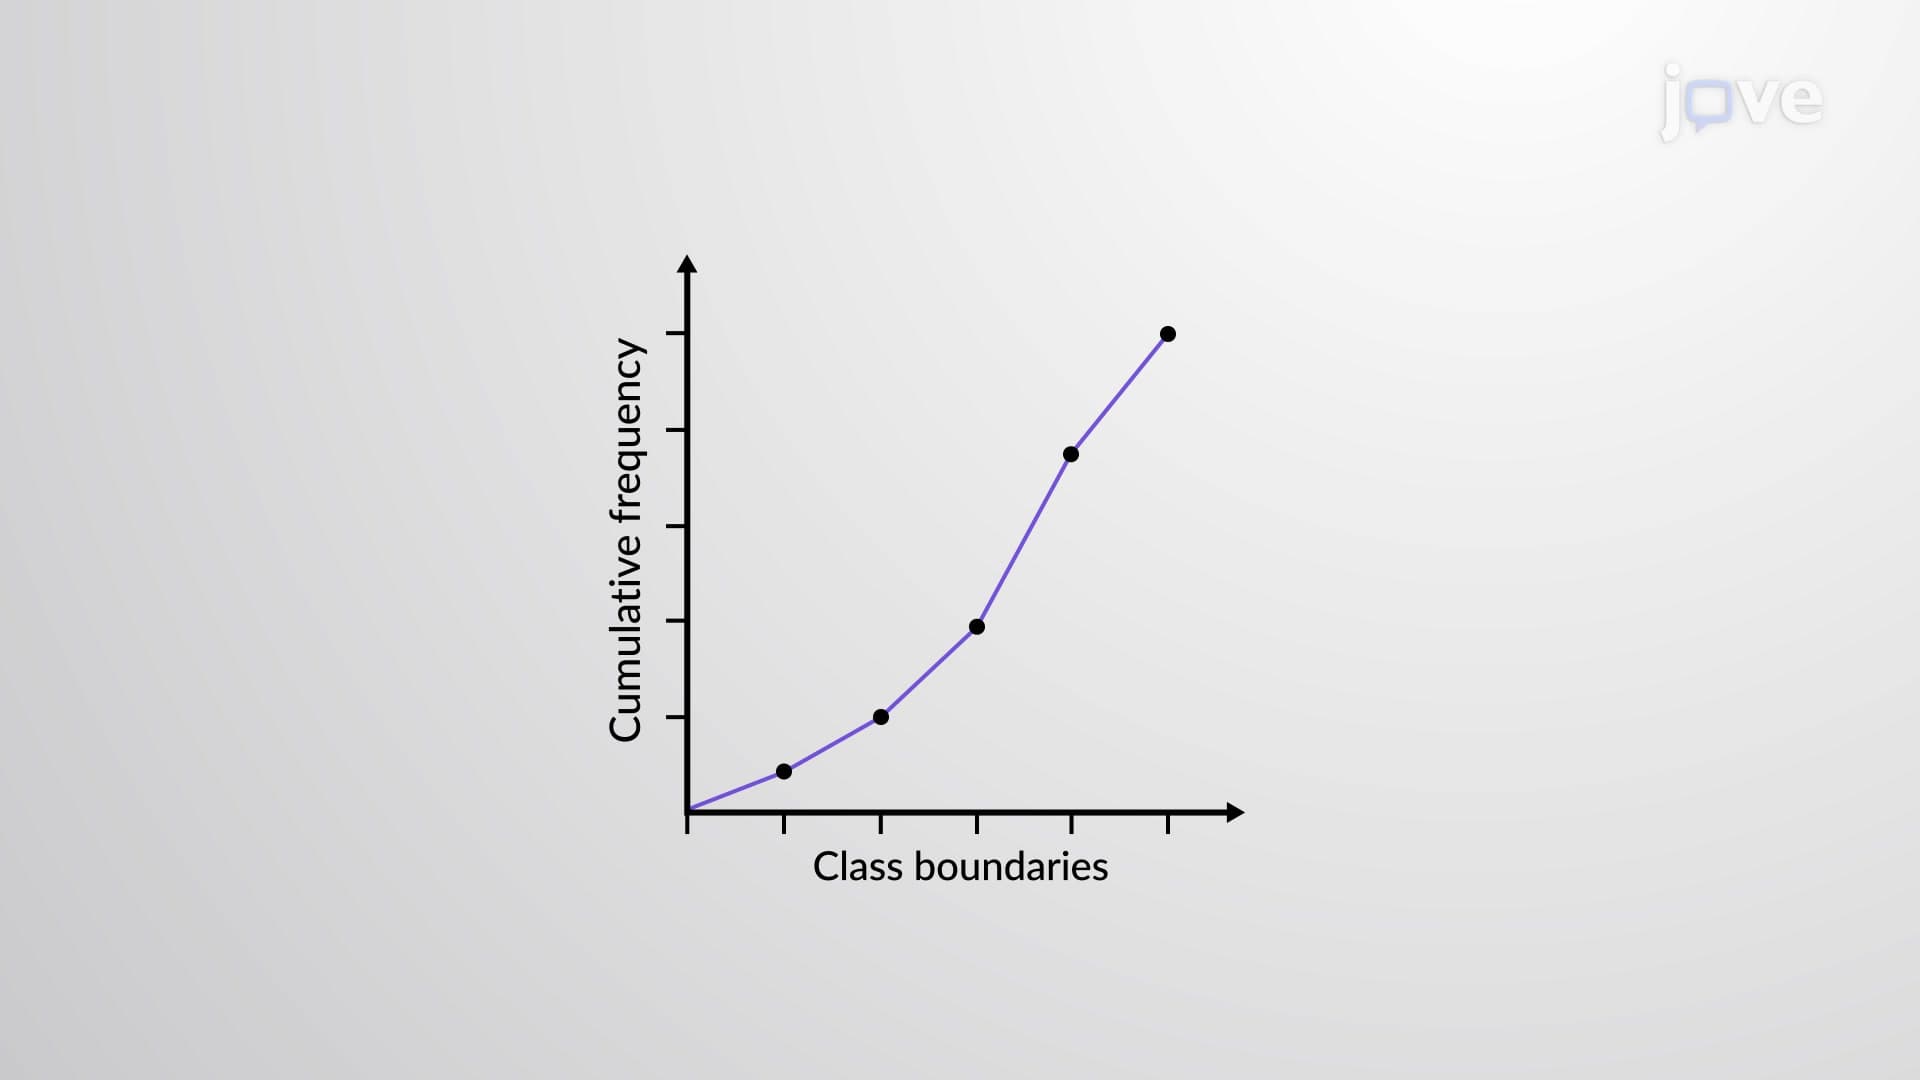
Progress to cumulative frequency distributions, probability mass functions, and sampling distributions. These concepts build directly on relative frequency foundations and prepare you for inferential statistics topics like confidence intervals and hypothesis testing in advanced coursework.
Related Micro-courses

Related Subjects
 Physics 33 micro-courses›
 Math Fundamentals 11 micro-courses›