Loading…
Loading video…
173,200 views

Ever wonder why polling 1,000 Americans can predict election outcomes for 330 million people? The central limit theorem explains this statistical magic by showing how sample means naturally form a bell-shaped pattern, regardless of the original population's distribution. When the FDA tests drug effectiveness across multiple patient groups, they rely on this fundamental principle to make reliable conclusions. What is Central Limit Theorem becomes clearer when you see how larger sample sizes create more predictable, normal distributions. Watch the full video on JoVE Coach to master this concept with expert-led visuals and step-by-step explanations.
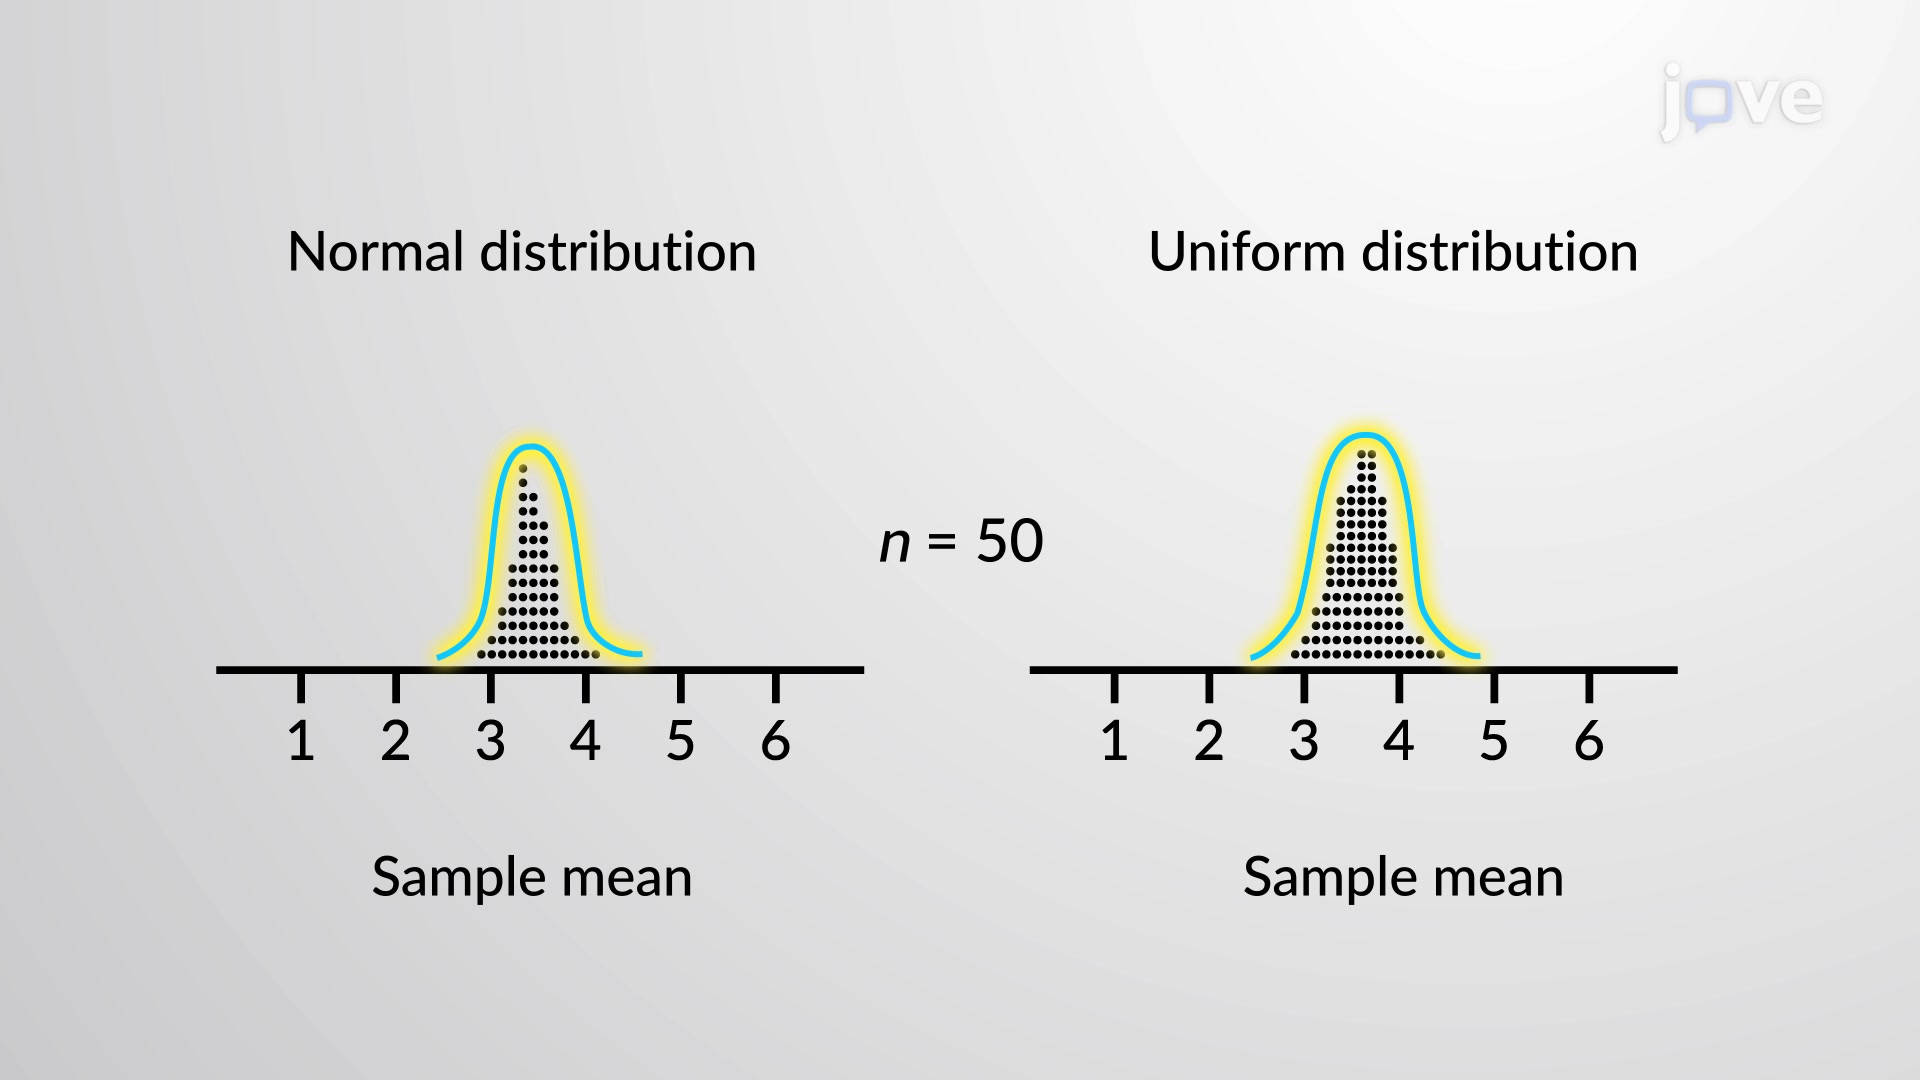
The central limit theorem represents one of statistics' most powerful concepts, enabling researchers to make reliable inferences about populations from sample data. This theorem states that when you repeatedly take samples from any population and calculate their means, these sample means will form a normal distribution—even if the original population isn't normally distributed. This remarkable property makes statistical analysis possible across diverse fields from healthcare to economics.
The central limit theorem definition includes specific mathematical relationships. As sample size increases, the sampling distribution of means approaches normality with the mean equal to the population mean (μ) and standard deviation equal to σ/√n, where σ is the population standard deviation and n is the sample size. The "magic number" of 30 samples often cited represents a practical threshold where normality becomes apparent, though this varies based on the original distribution's shape.
For students preparing for AP Statistics or college courses, understanding that the standard error (σ/√n) decreases as sample size increases is crucial. This relationship explains why larger surveys provide more precise estimates—a concept regularly tested on standardized exams.
Consider how the U.S. Census Bureau uses sampling techniques to estimate population characteristics between decennial censuses. When surveying household incomes across different states, the central limit theorem overview enables statisticians to make reliable national estimates from relatively small samples. Similarly, clinical trials for FDA drug approvals rely on this theorem to generalize findings from study participants to the broader American population.
Quality control in manufacturing provides another practical example. When Boeing tests aircraft components, engineers sample batches and apply central limit theorem principles to ensure safety standards across all production units. The theorem's reliability allows companies to maintain quality without testing every single item—a economically essential application.
Students encountering what is central limit theorem in detail should focus on three core components: the sampling distribution shape, the relationship between sample and population means, and the standard error calculation. These elements frequently appear on AP Statistics exams, MCAT questions, and college statistics midterms. Practice problems often involve calculating probabilities using z-scores, applying the empirical rule, or determining appropriate sample sizes for desired precision levels.
Understanding this central limit theorem concept provides the foundation for confidence intervals, hypothesis testing, and regression analysis—topics that build upon this fundamental principle throughout advanced statistics coursework.
Frequently Asked Questions
The Central Limit Theorem states that sample means from any population will form a bell-shaped (normal) distribution when you take enough samples, typically 30 or more. This happens regardless of whether the original population follows a normal distribution. The theorem is fundamental to making statistical inferences and appears frequently on AP Statistics and college statistics exams.
AP Statistics regularly tests CLT through free-response questions involving sampling distributions and probability calculations. Students must identify when conditions are met, calculate standard errors, and use z-scores to find probabilities. Practice problems often involve real scenarios like polling data or quality control testing.
While n≥30 is the common rule of thumb, the actual minimum depends on the population's distribution shape. For normally distributed populations, even small samples work well. For highly skewed distributions, you might need samples larger than 30. MCAT and college statistics courses emphasize understanding these nuances rather than memorizing the "30 rule."
When testing new medications, companies like Pfizer or Moderna sample patient groups to estimate treatment effects for the entire population. The CLT allows them to calculate confidence intervals and determine if observed differences between treatment and control groups are statistically significant, supporting FDA approval decisions.
Not at all! The concept builds naturally from basic probability and normal distributions covered in Algebra 2 and Pre-Calculus. AP Statistics introduces CLT systematically with visual demonstrations and real-world applications. The key is understanding the pattern rather than complex mathematical proofs.
Practice identifying when CLT applies, calculating standard errors (σ/√n), and converting to z-scores for probability calculations. Focus on interpreting results in context rather than just computational mechanics. Create study cards with different population distributions and their corresponding sampling distribution characteristics.
CLT provides the theoretical foundation for confidence intervals by ensuring sample means are normally distributed. This normality allows statisticians to use z-scores or t-scores to create intervals that capture the true population parameter with known probability. Understanding this connection is crucial for advanced statistics courses and standardized tests.
Build on CLT foundations by exploring hypothesis testing, confidence intervals, and statistical inference procedures. These topics directly apply CLT principles and appear frequently on advanced placement exams and college statistics courses. Consider studying sampling bias and survey methodology to understand real-world applications.
Related Micro-courses
Related Subjects


