Loading…
Loading video…
173,200 views

Did you know that the National Weather Service's 70% chance of rain prediction doesn't mean it will rain 70% of the day? Probability in statistics forms the mathematical foundation for understanding uncertainty and making predictions from data. From predicting election outcomes to analyzing clinical trial results, What is Probability in Statistics reveals how we quantify the likelihood of events occurring. Consider how meteorologists use probability models to forecast weather patterns across the United States, combining historical data with current atmospheric conditions. Watch the full video on JoVE Coach to master this concept with expert-led visuals and step-by-step explanations.
Probability in statistics serves as the mathematical language for describing uncertainty and randomness in data analysis. Unlike deterministic mathematics where outcomes are predictable, probability deals with situations where multiple outcomes are possible, each with a measurable likelihood of occurrence. This fundamental concept bridges the gap between theoretical mathematics and practical statistical applications used across industries, from pharmaceutical research to financial markets.
The probability in statistics definition centers on a simple yet powerful formula: the probability of an event equals the number of favorable outcomes divided by the total number of possible outcomes. For example, when analyzing SAT score distributions, statisticians calculate the probability that a randomly selected student scores above 1400 by dividing the number of students scoring above 1400 by the total number of test-takers.
Sample spaces represent all possible outcomes in a probability experiment. In medical research, consider a clinical trial testing a new diabetes medication where each patient can experience one of four outcomes: significant improvement, moderate improvement, no change, or adverse reaction. Each outcome represents a simple event, while combinations like "any improvement" represent compound events.
Understanding probability in statistics extends beyond single events to probability distributions—mathematical functions describing how probabilities are distributed across all possible outcomes. The normal distribution, fundamental to AP Statistics and college-level courses, appears everywhere from standardized test scores to manufacturing quality control. For instance, the FDA uses probability distributions to establish safety margins for pharmaceutical dosages, ensuring that adverse events occur with acceptably low probability.
Probability in statistics basics form the foundation for hypothesis testing, confidence intervals, and predictive modeling. Insurance companies like State Farm use probability models to calculate premium rates by analyzing historical accident data and demographic factors. Similarly, political pollsters apply probability theory to determine margin of error in election predictions, explaining why a candidate leading by 3% with a ±4% margin of error doesn't guarantee victory.
In academic settings, students encounter probability concepts in AP Statistics exams, where they analyze scenarios like manufacturing defects or survey sampling. College pre-med students later apply these principles in biostatistics courses, calculating the probability of treatment success or disease occurrence rates. The concept also appears in MCAT passages involving experimental design and data interpretation, making mastery essential for medical school admission.
Frequently Asked Questions
Probability in statistics is the mathematical study of uncertainty and randomness, measuring how likely events are to occur on a scale from 0 to 1. Unlike regular math with definite answers, probability deals with uncertain outcomes and helps us make informed decisions when we can't predict exact results. It's essential for analyzing data, making predictions, and understanding variability in everything from medical trials to market research.
The basic probability definition states that probability equals the number of favorable outcomes divided by the total number of possible outcomes, expressed as P(event) = favorable outcomes / total outcomes. This value always ranges between 0 (impossible event) and 1 (certain event), with 0.5 representing equally likely outcomes. Understanding this fundamental formula is crucial for solving probability problems in statistics courses.
AP Statistics extensively covers probability through multiple-choice and free-response questions involving probability distributions, conditional probability, and statistical inference. Students analyze scenarios like quality control in manufacturing or medical treatment effectiveness, calculating probabilities and interpreting results. The exam emphasizes both computational skills and conceptual understanding of how probability supports statistical reasoning.
Yes, MCAT passages frequently include probability and statistics concepts, particularly in psychology/sociology and biological sciences sections. You'll analyze experimental data, interpret confidence intervals, and evaluate study results using probability principles. Strong probability foundations help with passages involving clinical trials, genetic inheritance patterns, and behavioral research methodology.
The National Weather Service uses probability models to express forecast uncertainty, like "30% chance of rain" meaning a 30% probability that measurable precipitation will occur at any given point in the forecast area. These probabilities come from analyzing thousands of computer model simulations based on current atmospheric conditions, historical weather patterns, and complex mathematical equations describing atmospheric behavior.
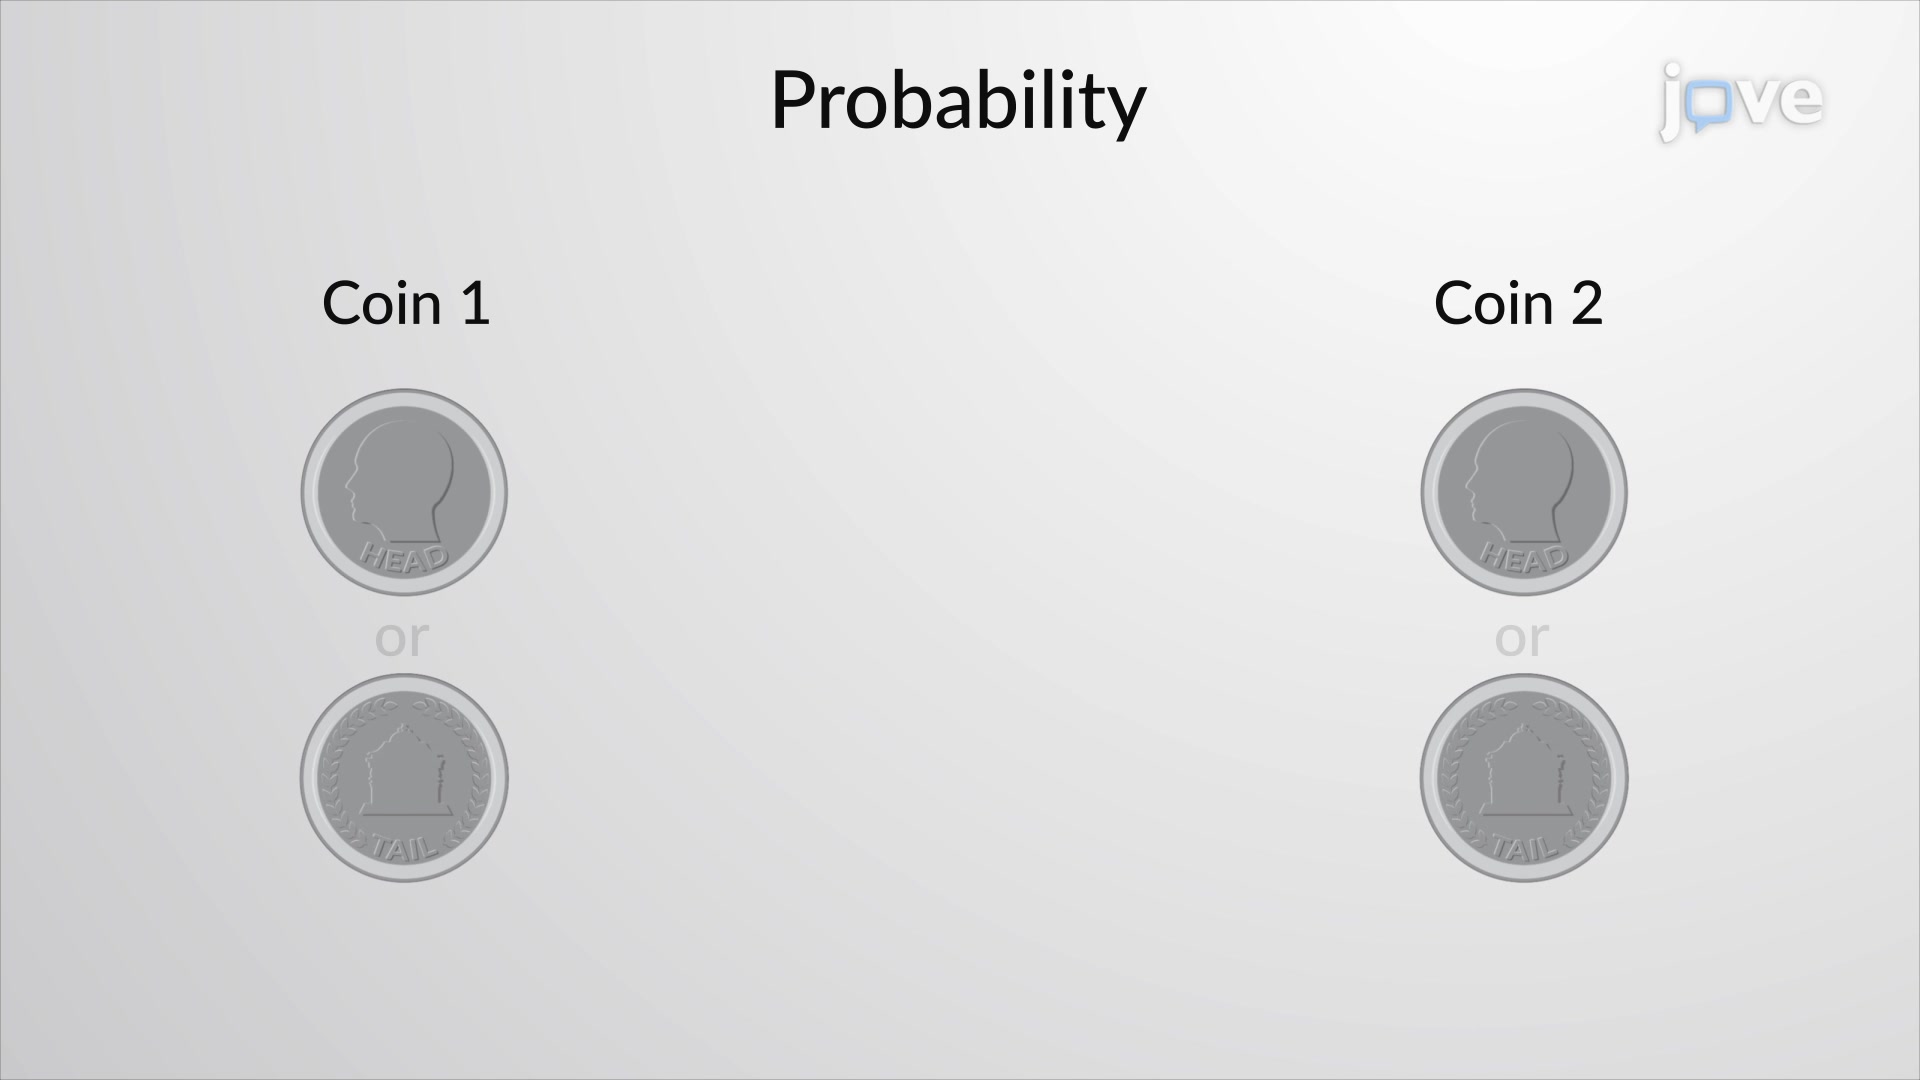
Probability concepts are accessible to students with basic algebra skills, as most calculations involve simple arithmetic operations like addition, subtraction, multiplication, and division. The key challenge is developing logical thinking about uncertainty rather than complex mathematical computation. Starting with concrete examples like coin flips and dice rolls helps build intuition before tackling more abstract statistical applications.
Focus on understanding fundamental concepts rather than memorizing formulas, practice with diverse problem types from textbooks and past exams, and create visual aids like probability trees and Venn diagrams. Work through step-by-step solutions, explaining your reasoning aloud to identify gaps in understanding. Regular practice with real-world applications helps connect abstract concepts to practical scenarios you'll encounter on exams.
After mastering fundamental probability, explore conditional probability, Bayes' theorem, and probability distributions like normal, binomial, and Poisson distributions. These concepts lead naturally into inferential statistics, hypothesis testing, and regression analysis. Students planning careers in data science, medicine, or research should also study sampling distributions and confidence intervals, which form the foundation for advanced statistical methods.
Related Micro-courses
Related Subjects


