Loading video…


 14 Concepts
 224.2K views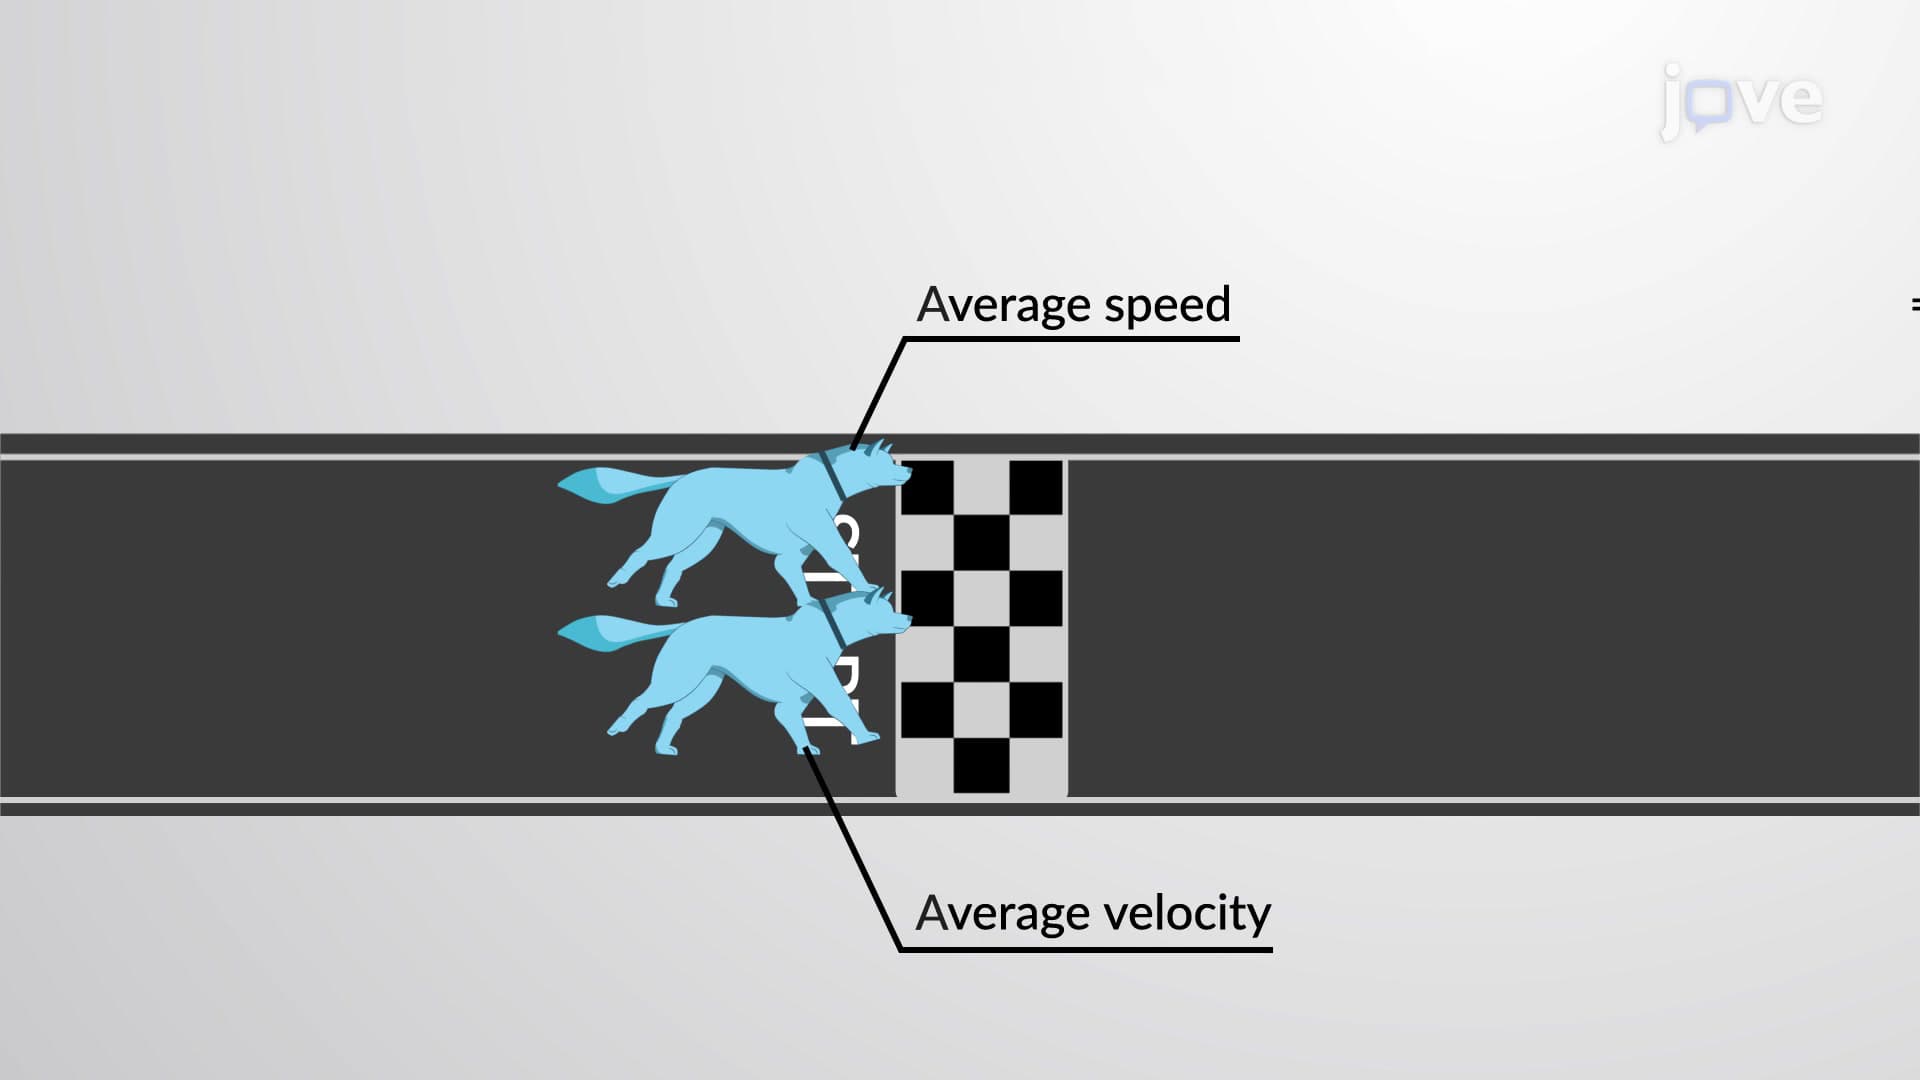

Video Summary: What Is Average Velocity
Ever wonder how GPS calculates your "arrival time" during a road trip from New York to Boston? Average velocity measures how fast an object moves between two points, considering both distance and direction. Unlike speed, which only tells you how fast you're going, average velocity reveals whether you're moving forward or backward relative to your starting position. A car traveling 300 miles north in 5 hours has an average velocity of 60 mph northward. Watch the full video on JoVE Coach to master this concept with expert-led visuals and step-by-step explanations.
Average velocity represents one of the most fundamental concepts in physics, serving as the bridge between basic motion description and advanced kinematics. Unlike the everyday concept of speed, average velocity incorporates both magnitude and direction, making it a vector quantity that provides crucial information about an object's overall motion pattern.
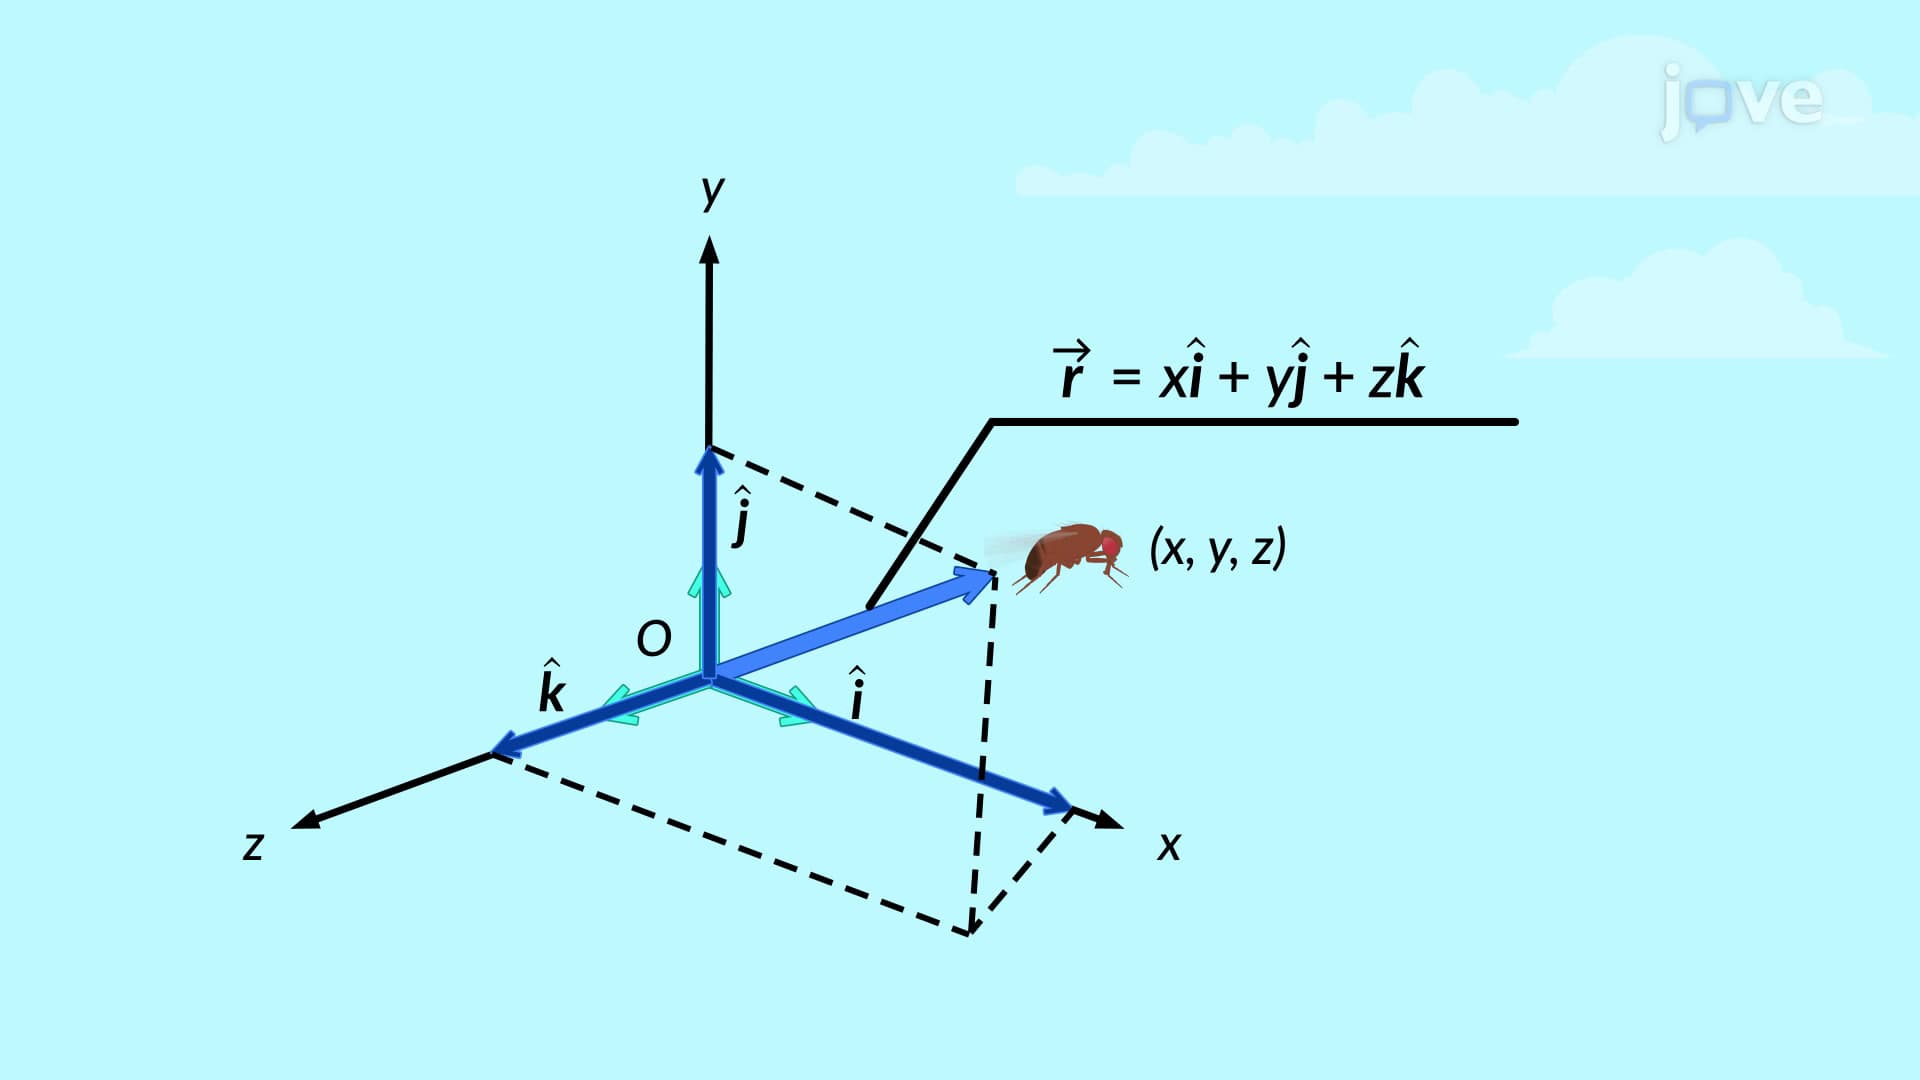
The mathematical definition centers on two key components: displacement and time interval. Average velocity equals the total displacement (change in position) divided by the total time elapsed. This seemingly simple formula, v(avg) = Δx/Δt, contains profound implications for understanding motion. The displacement term (Δx) represents the straight-line distance between starting and ending positions, not the total path traveled.
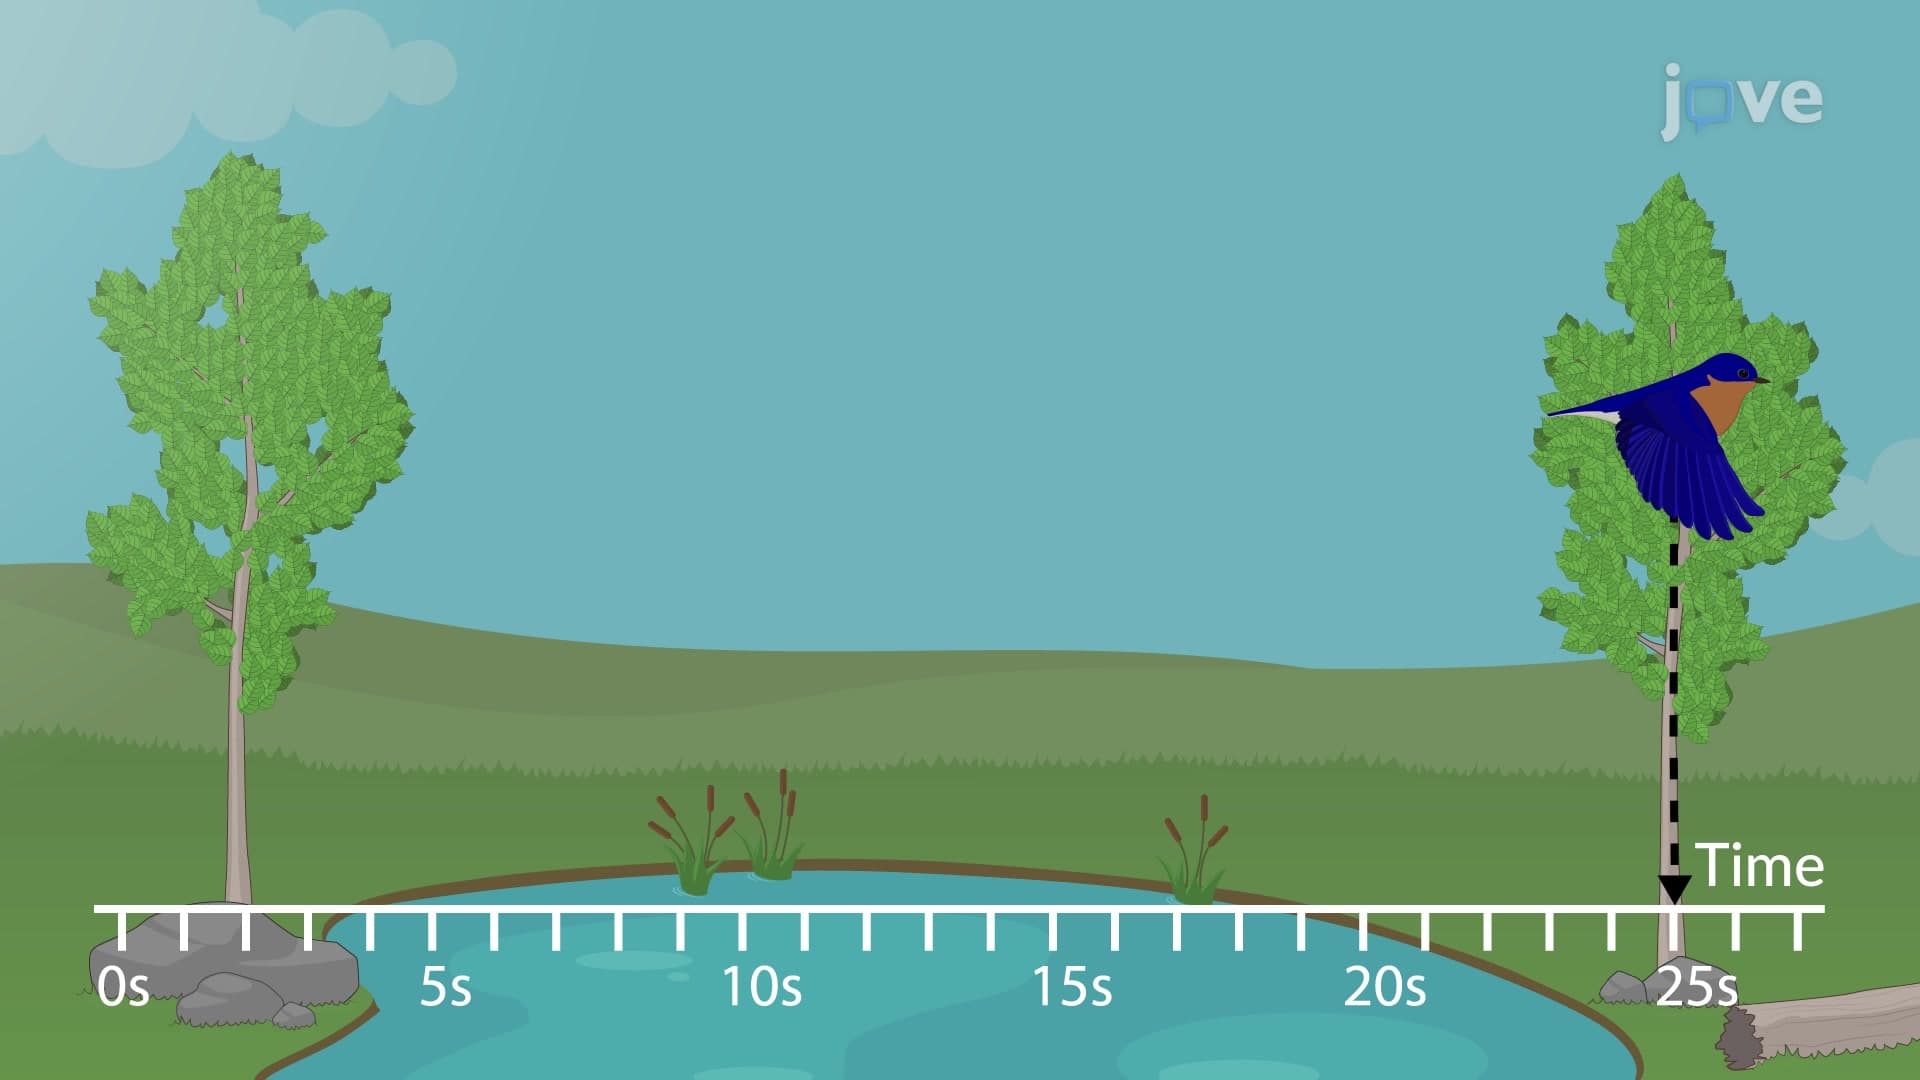
The vector nature of average velocity creates important distinctions from scalar speed measurements. Consider a student walking from their dorm room to the campus library, then returning to the starting point. While their average speed reflects the total distance traveled divided by time, their average velocity equals zero because their displacement is zero-they ended where they began.
This directional component proves essential in AP Physics courses and college-level mechanics. Students preparing for standardized tests like the SAT Subject Test in Physics must master the sign conventions: positive values typically indicate motion in the chosen positive direction (often rightward or upward), while negative values represent motion in the opposite direction.
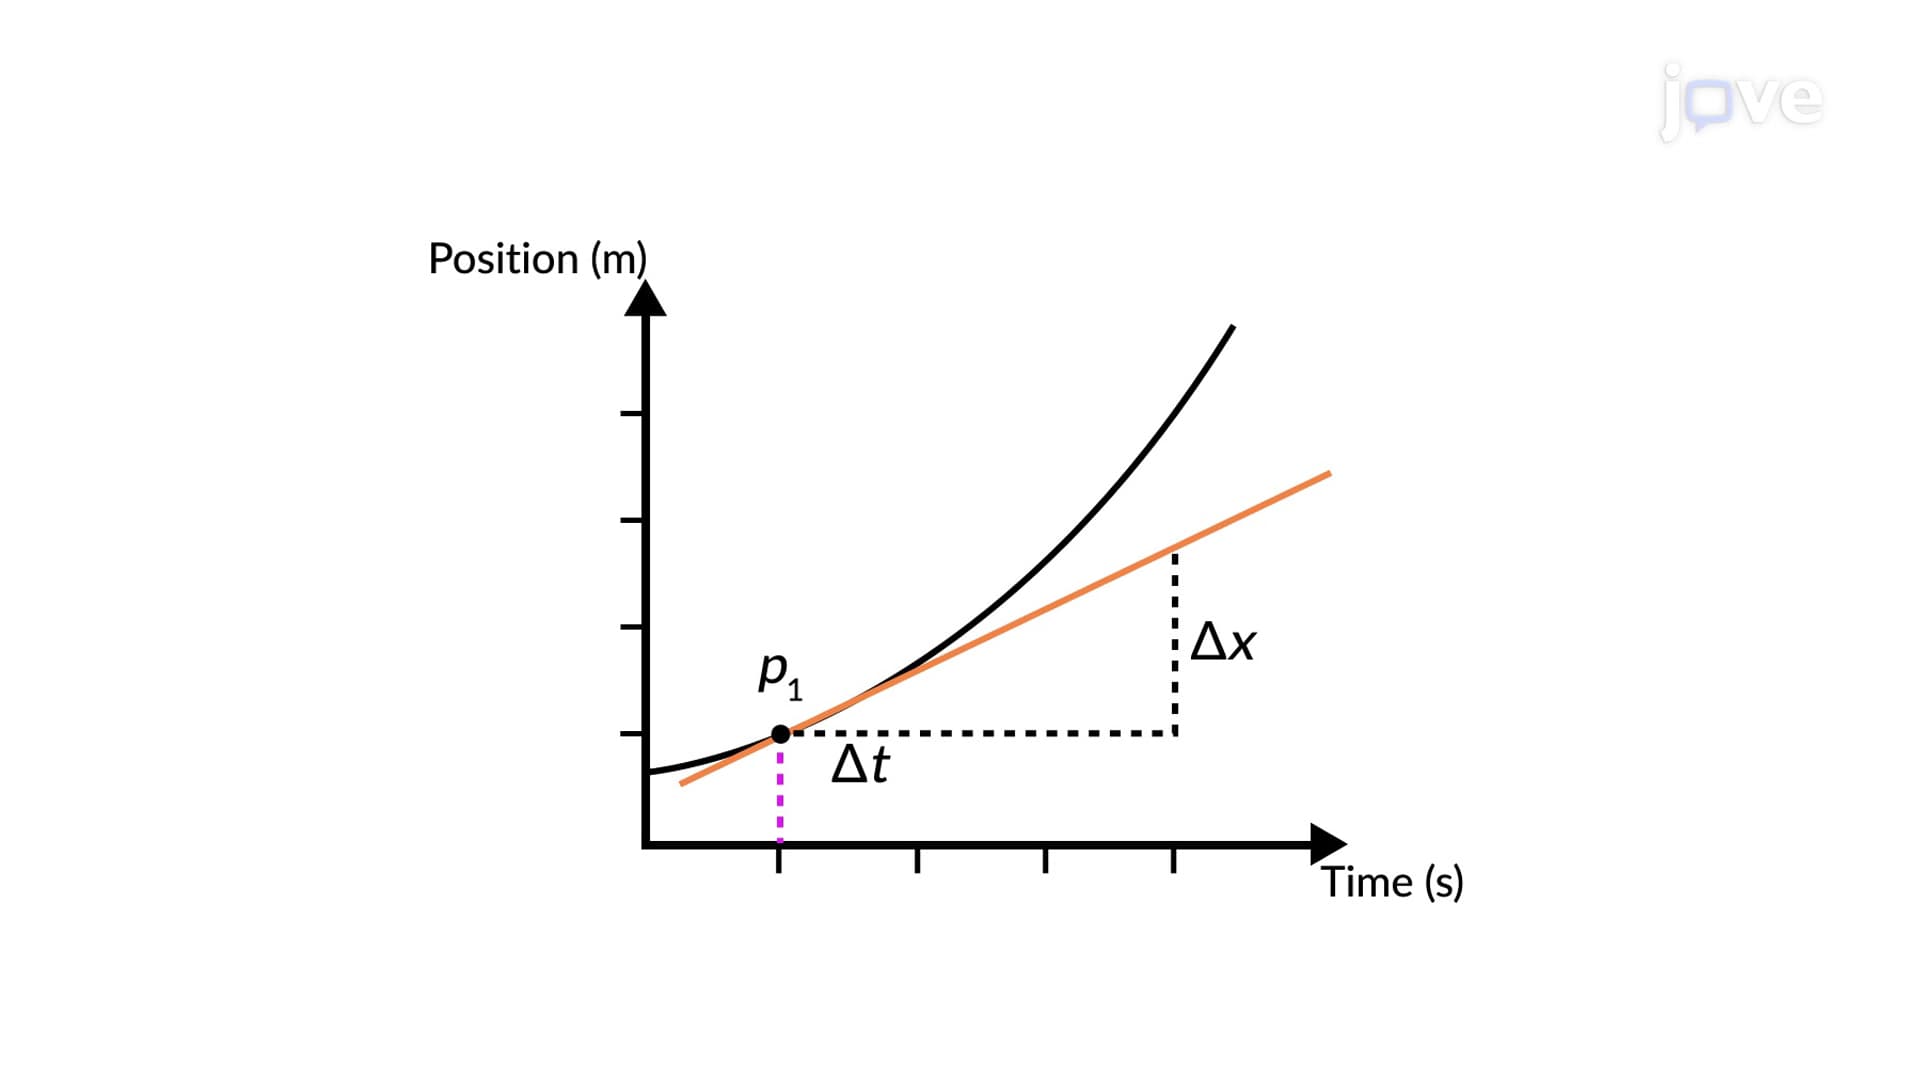
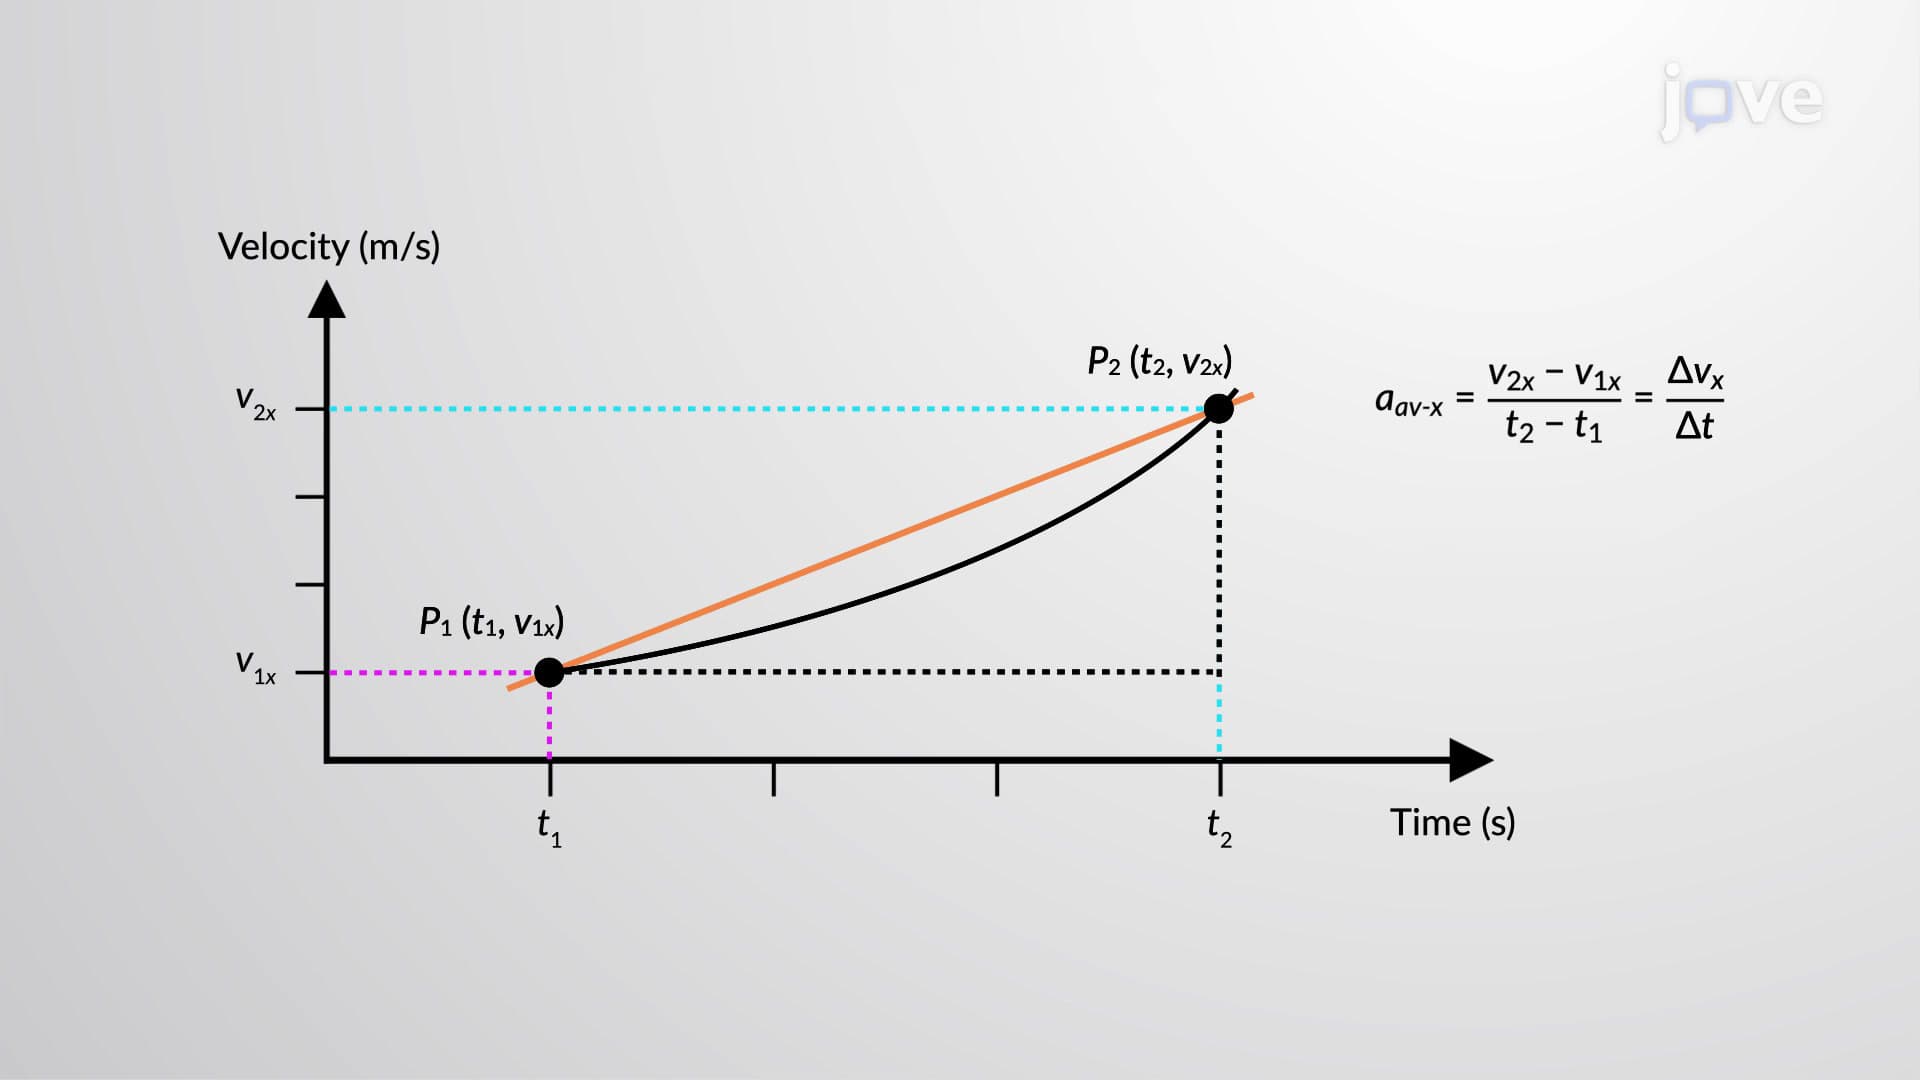
Position-time graphs provide powerful visual tools for understanding average velocity concepts. The slope of a line connecting any two points on a position-time graph directly equals the average velocity during that time interval. This graphical approach helps students visualize motion patterns and prepares them for more complex velocity-time and acceleration-time graph analysis in advanced courses.
For MCAT preparation, understanding these graphical relationships proves crucial, as the exam frequently tests physics concepts through visual interpretation. Students learn to identify periods of constant velocity (straight lines), acceleration (curved lines), and direction changes (slope sign changes).
Average velocity calculations appear throughout engineering and scientific applications. NASA mission planners use these principles when calculating spacecraft trajectories between Earth and Mars. Traffic engineers apply average velocity concepts when designing highway systems and optimizing traffic flow patterns in cities like Los Angeles and Chicago.
In academic settings, average velocity problems commonly appear on college physics midterms and AP Physics 1 examinations. Successful problem-solving requires careful attention to coordinate systems, time intervals, and displacement calculations rather than distance measurements.
Related Micro-courses