Loading video…


 16 Concepts
 10.9K views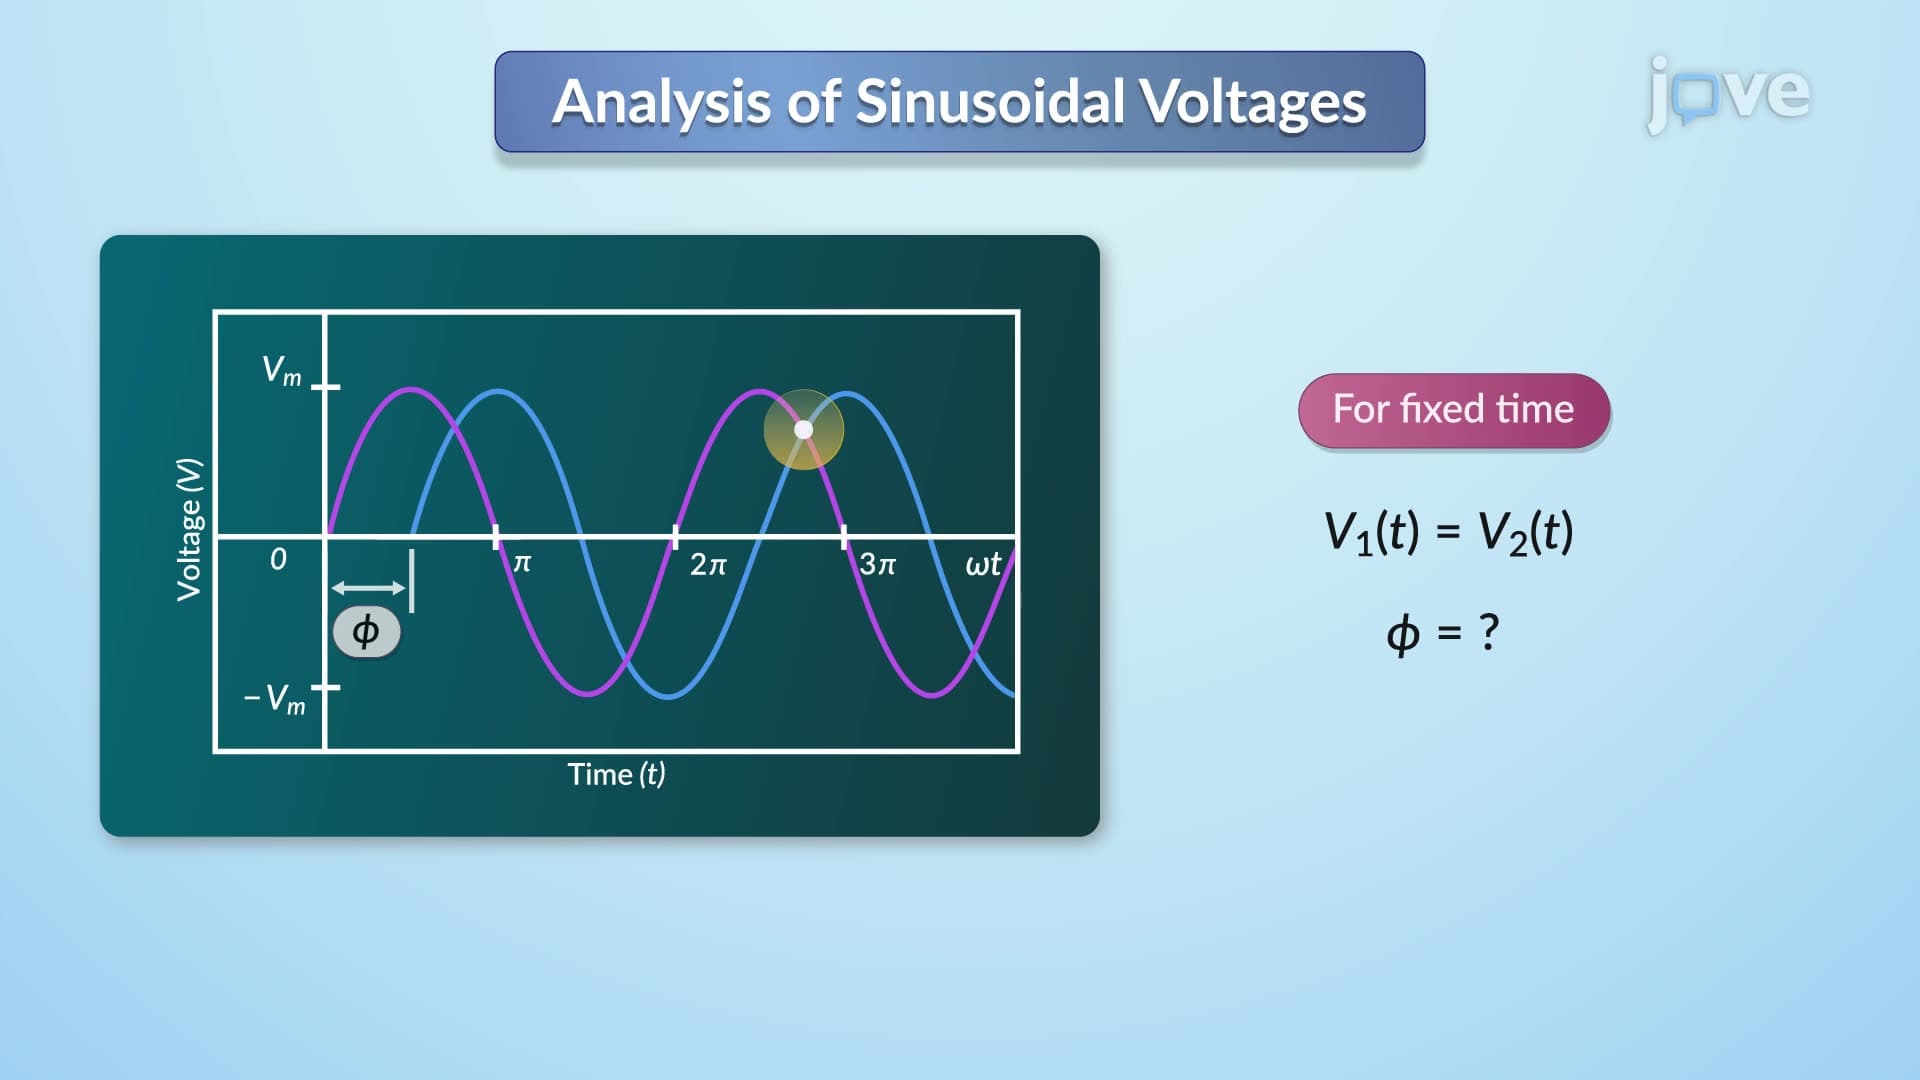

Video Summary: Graphical and Analytic Representation of Sinusoids Guide
Did you know that every AC power outlet in your home delivers electricity using sinusoidal waves? Phasors provide the mathematical framework for analyzing these oscillating signals, making complex wave relationships surprisingly visual and intuitive. When electrical engineers at companies like General Electric design power grids, they rely on the Graphical And Analytic Representation of Sinusoids Guide to understand how different voltage sources interact. This powerful technique transforms time-varying sinusoids into rotating vectors, simplifying calculations that would otherwise require complex trigonometry. Watch the full video on JoVE Coach to master this concept with expert-led visuals and step-by-step explanations.
Phasors revolutionize how we analyze alternating current (AC) circuits by converting time-domain sinusoids into frequency-domain vectors. This transformation is fundamental to electrical engineering and appears extensively in Advanced Placement (AP) Physics C courses and college-level circuit analysis.
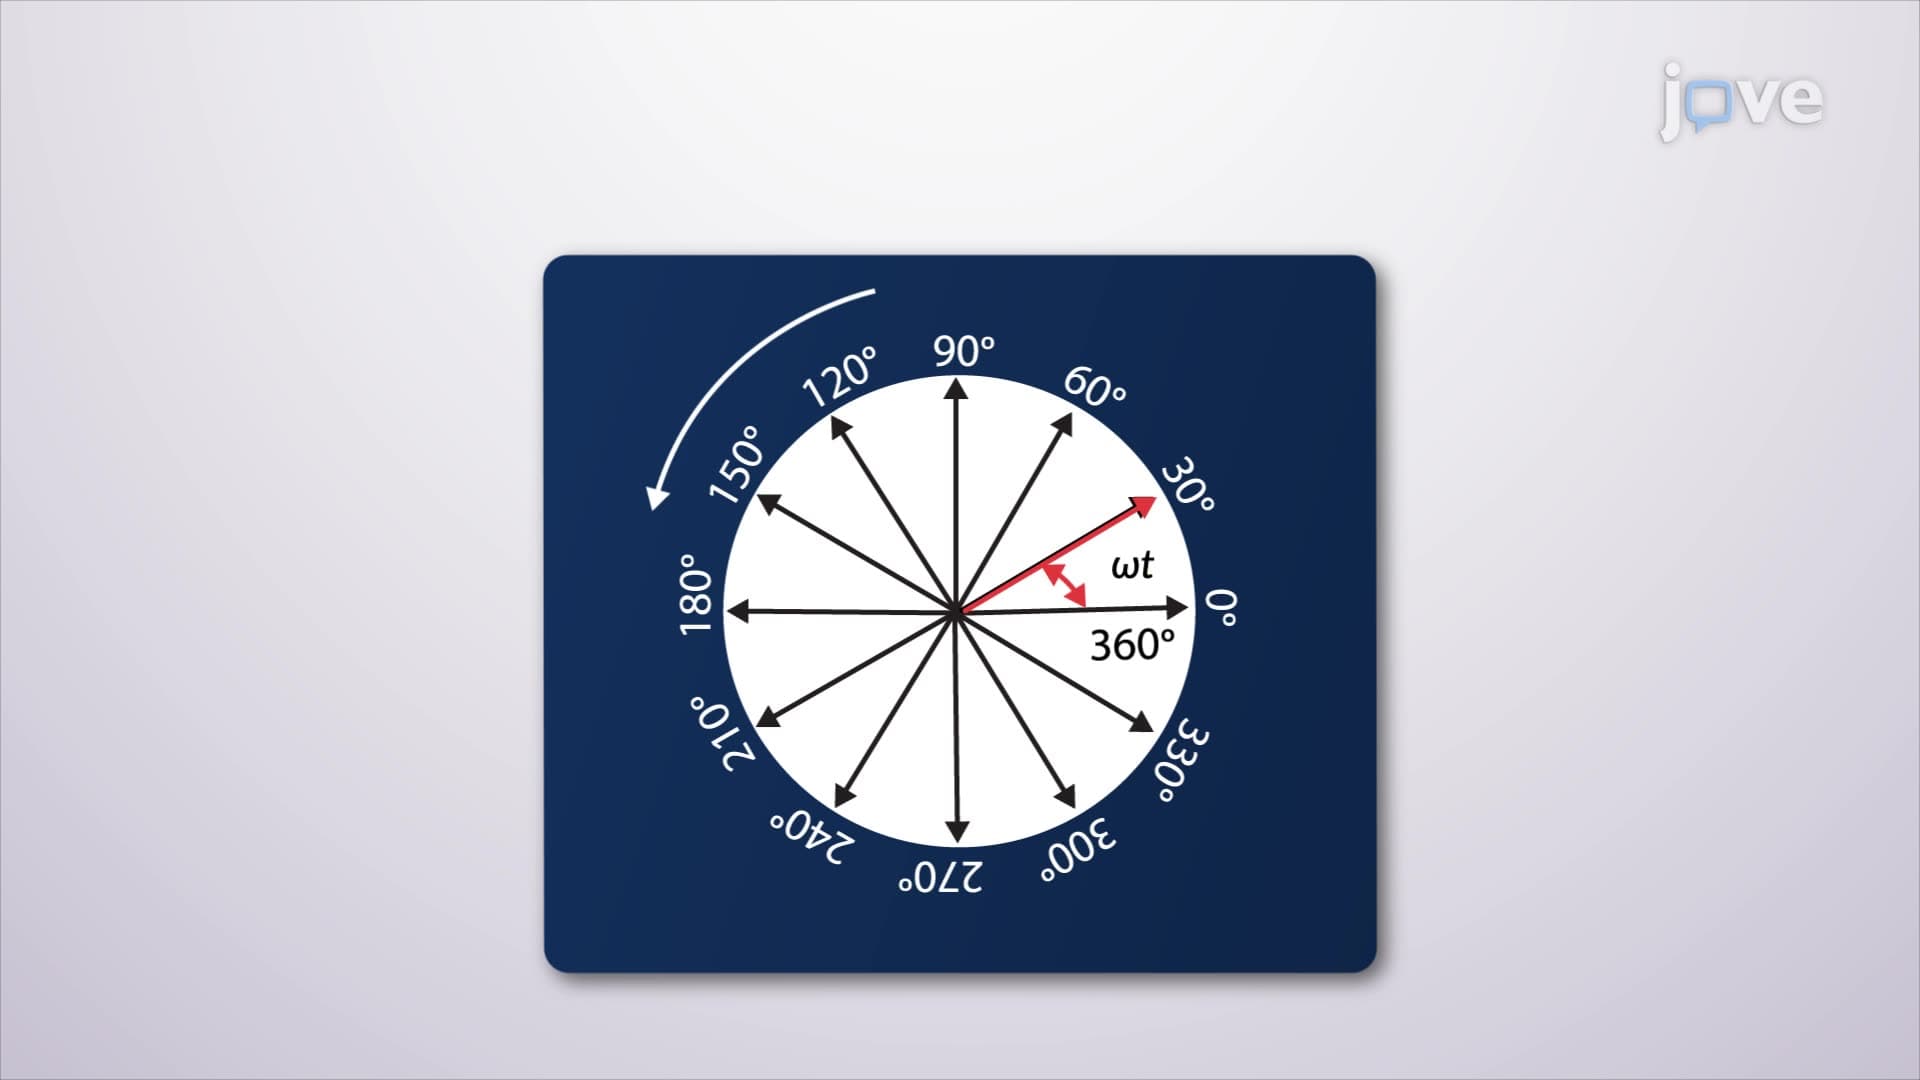
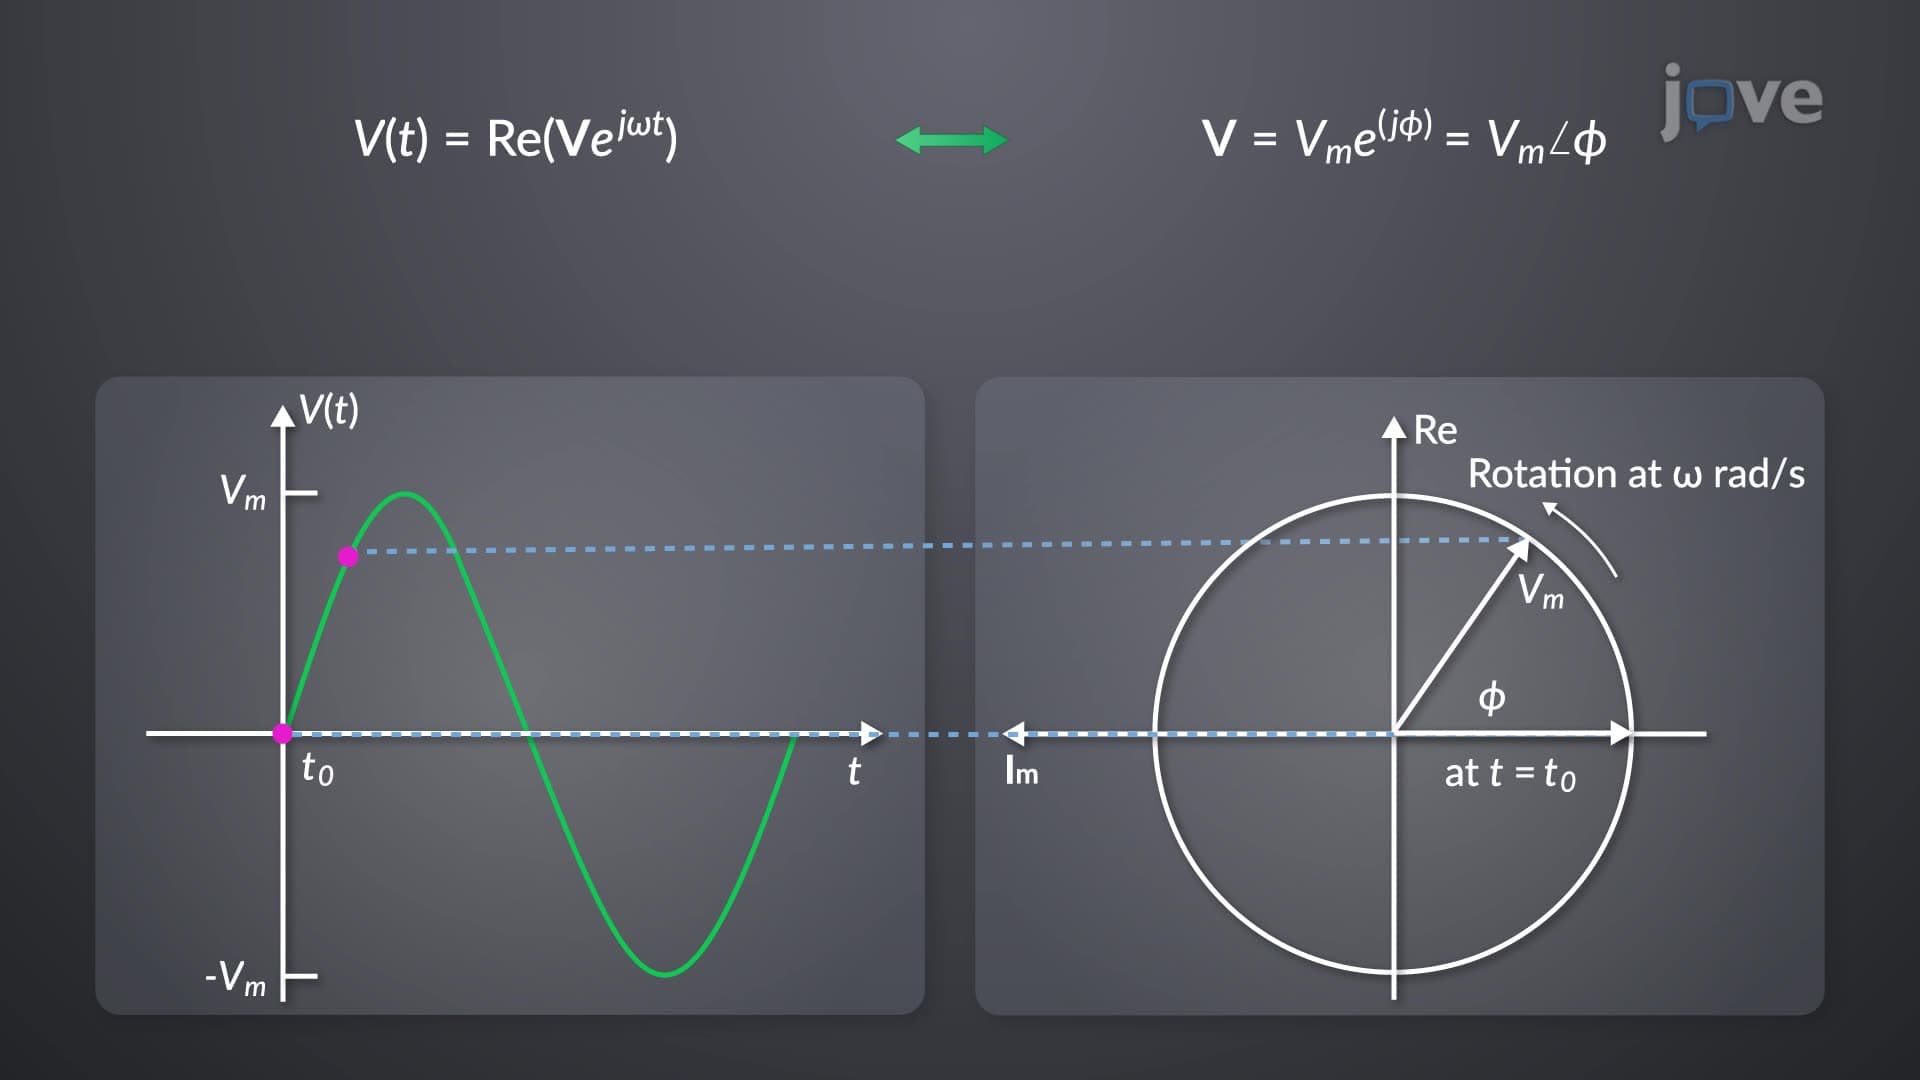
The phasors definition establishes these rotating vectors as complex numbers representing sinusoidal functions. Unlike static vectors, phasors rotate at angular frequency ω, but we typically analyze their relationships at a frozen moment in time. When students ask what is phasors in detail, the answer involves understanding that each phasor encodes three crucial pieces of information: amplitude (vector length), frequency (rotation rate), and phase (angular position).
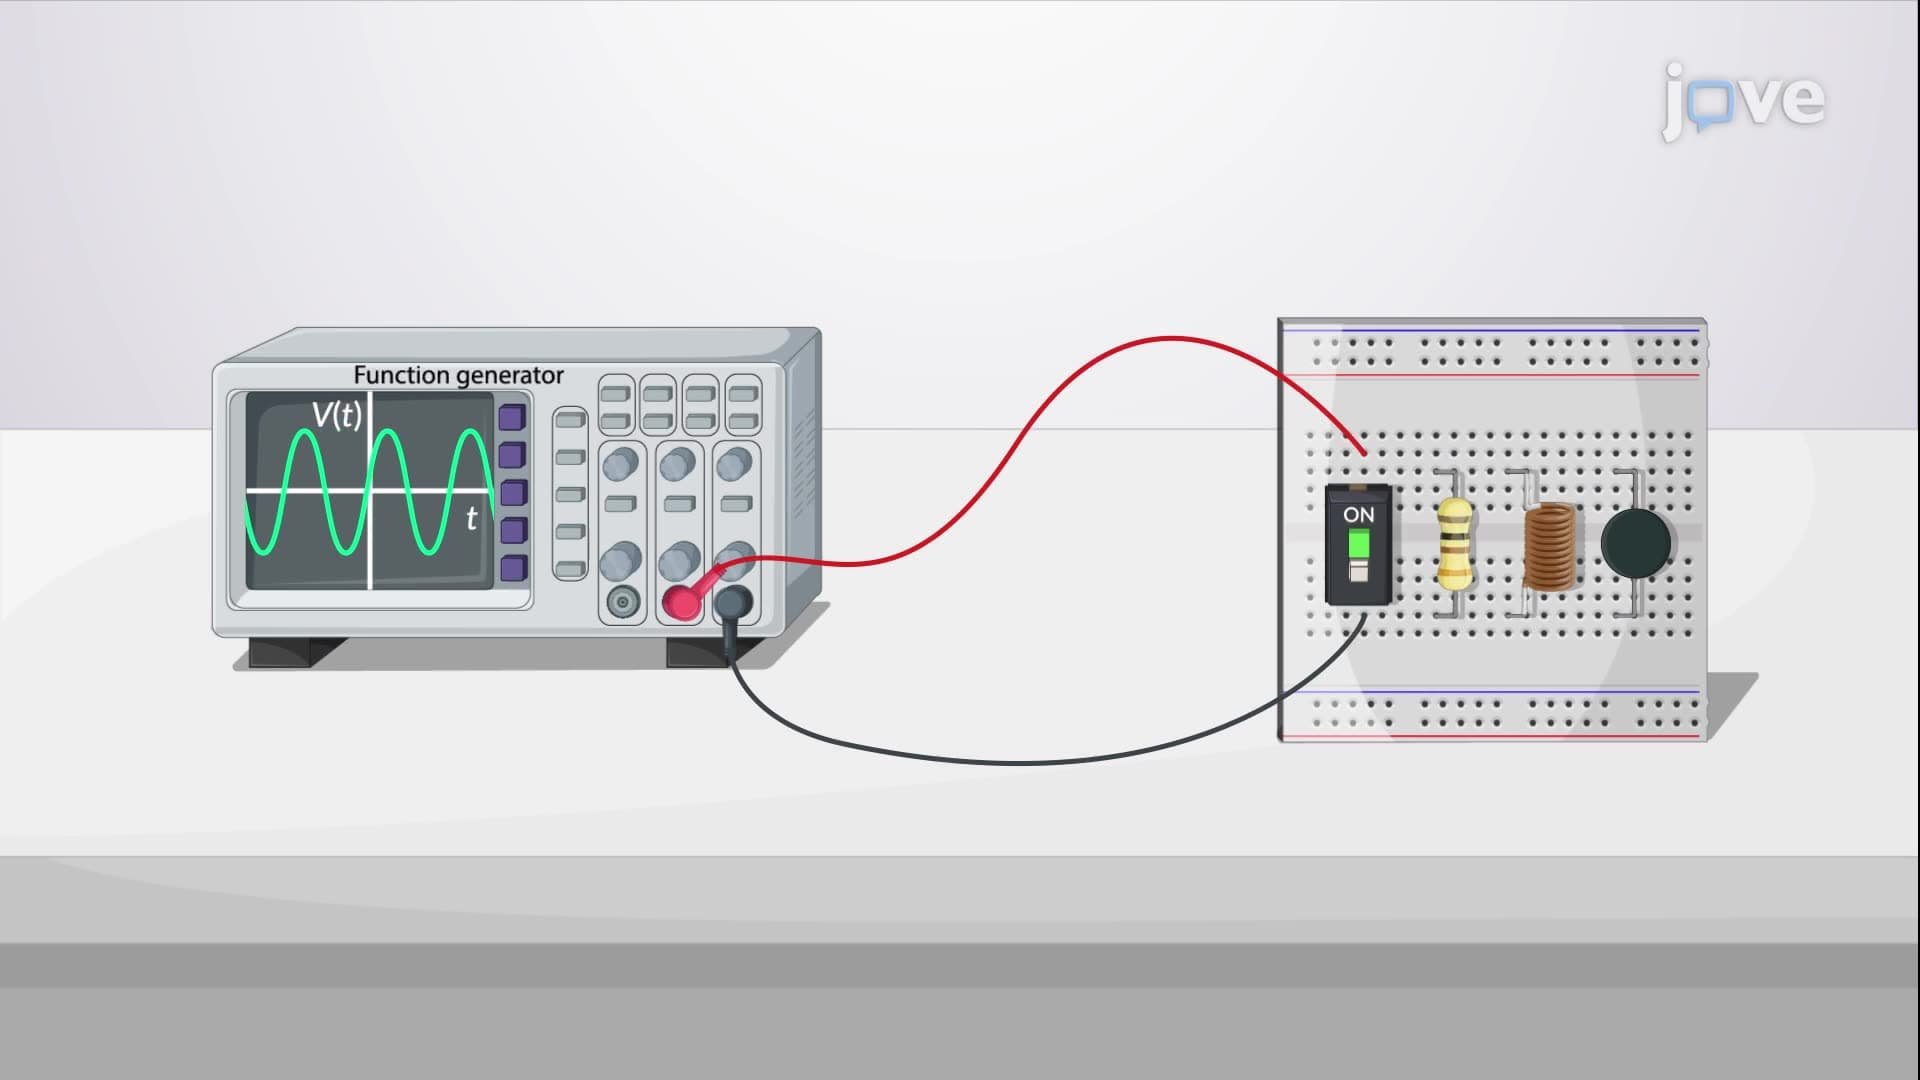
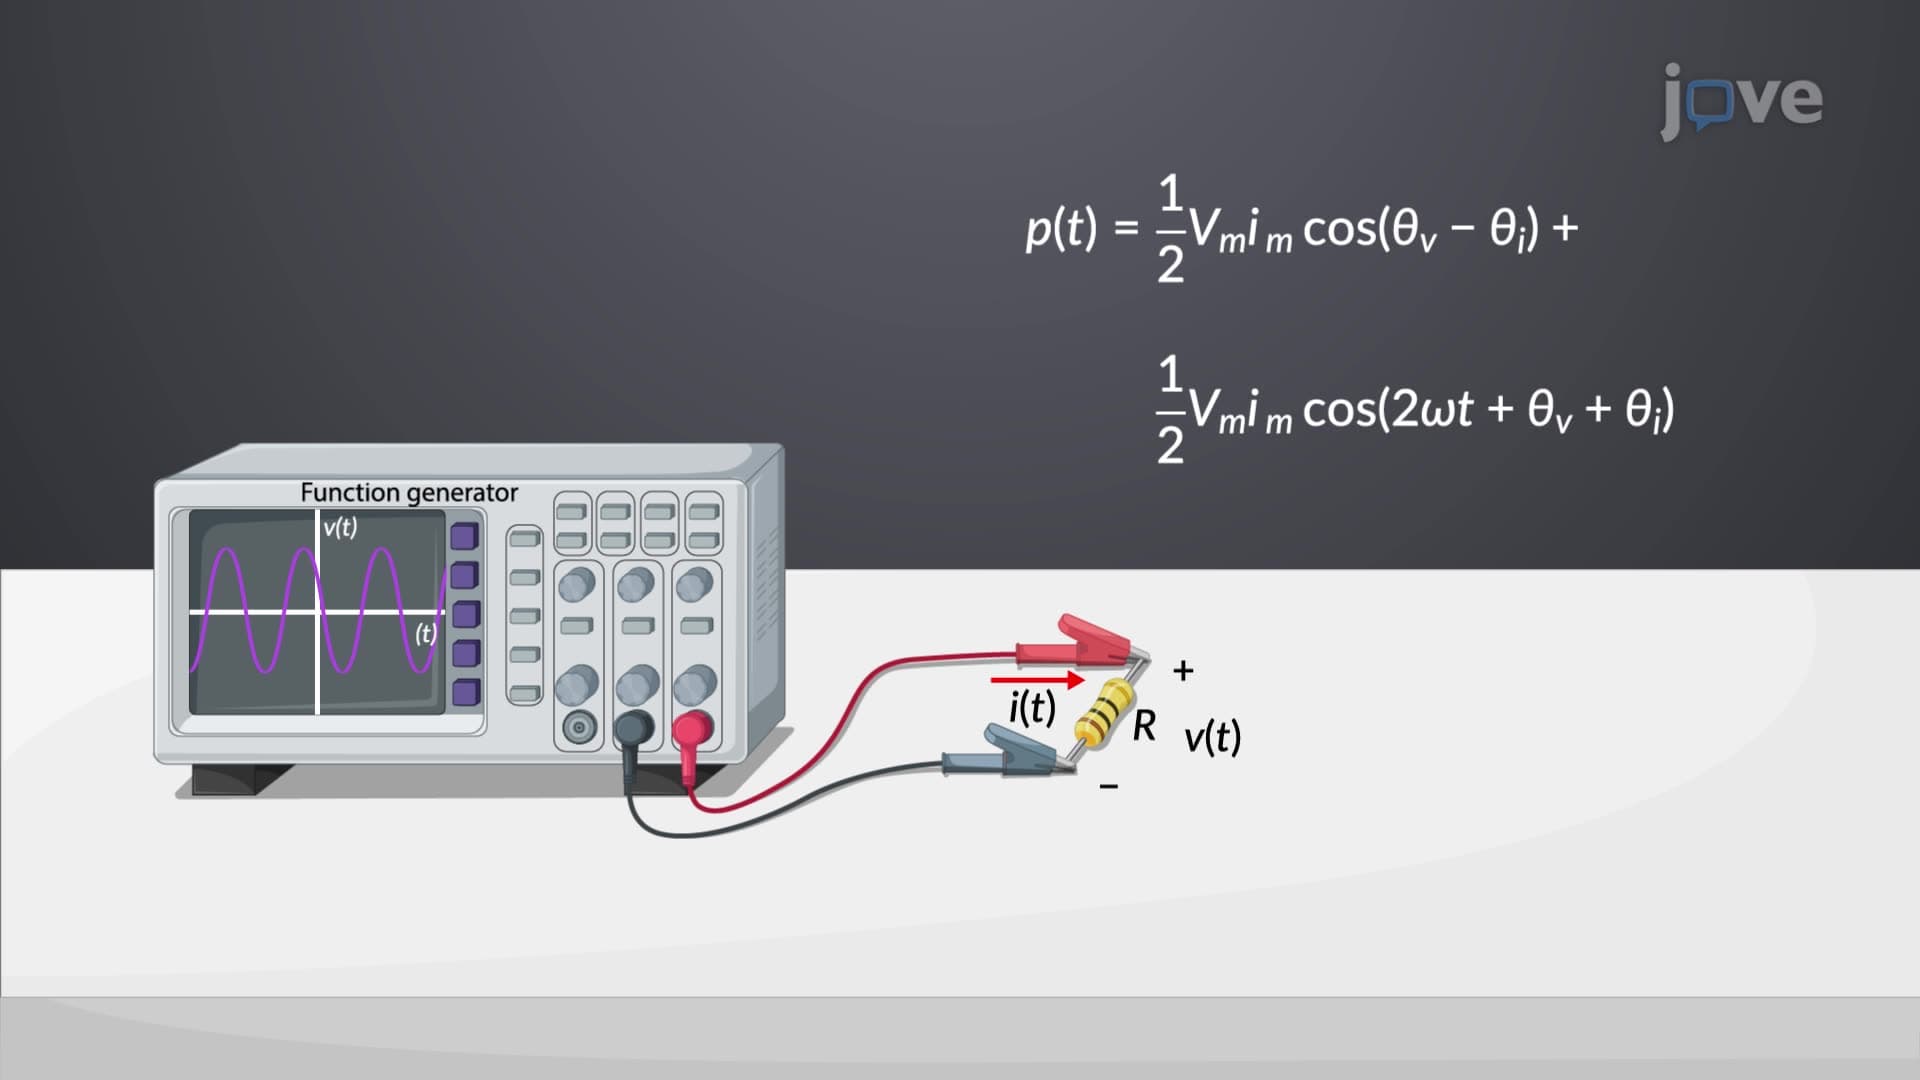
Oscilloscope measurements become systematic when applying phasors basics. Engineers at companies like Texas Instruments use this three-step process daily: First, measure peak-to-peak voltage to determine amplitude (remember, peak-to-peak equals twice the amplitude). Second, calculate period T from the time between identical wave points, then find angular frequency using ω = 2π/T. Third, determine phase relationships by comparing voltage values at specific time instances, considering whether the sinusoid has positive or negative slope.
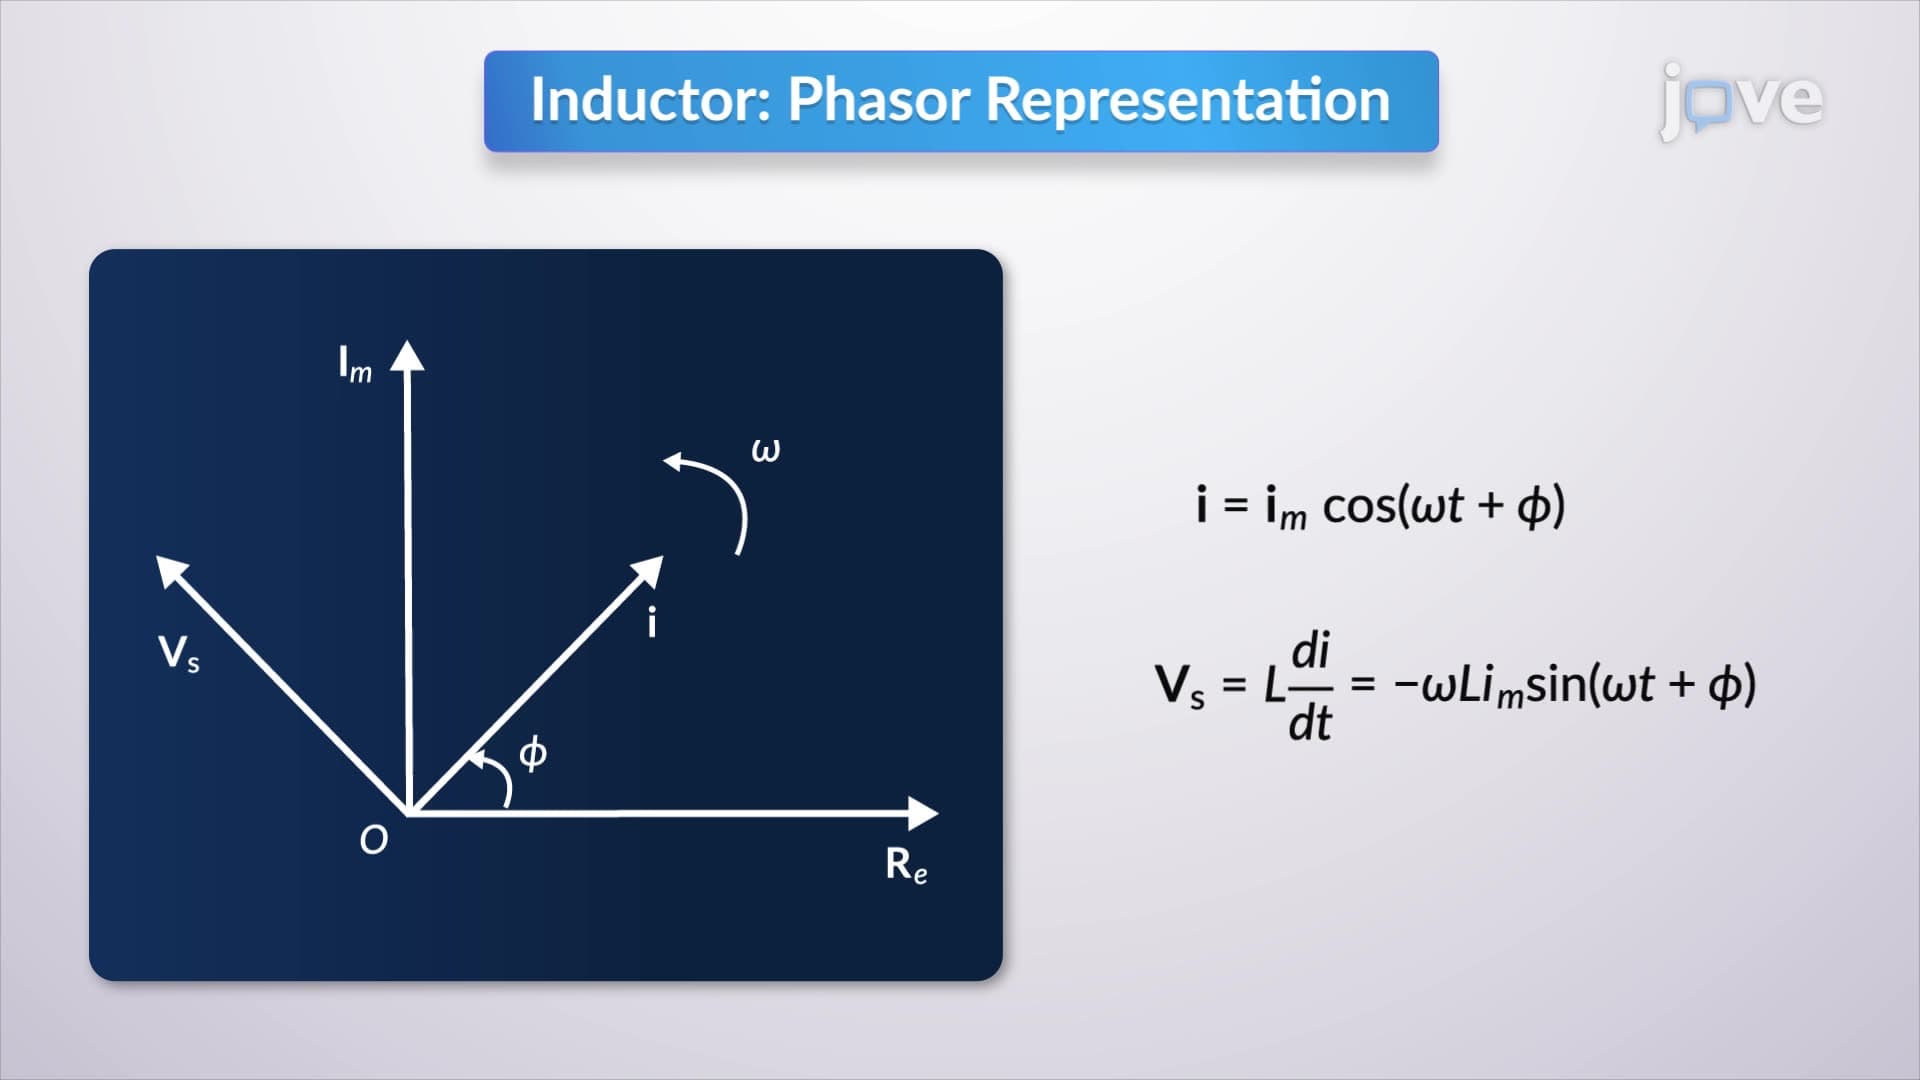
The phasors concept shines in graphical analysis where the horizontal axis represents cosine magnitude and vertical axis represents sine magnitude. This resembles polar coordinates but focuses on sinusoidal relationships. Students preparing for the MCAT or engineering entrance exams should master this visualization: angles measured counterclockwise from the horizontal axis are positive, while clockwise measurements are negative. The key insight that cosine becomes sine when you subtract 90 degrees (cos(θ) = sin(θ - 90°)) becomes visually obvious in phasor diagrams.
This phasors study guide approach becomes powerful when adding multiple sinusoids. Instead of complex trigonometric identities, you simply add phasor vectors using parallelogram or triangle methods. The resultant phasor's magnitude equals the hypotenuse length, while its phase angle equals arccos(base/hypotenuse). This technique appears frequently in college circuits courses and professional electrical engineering practice, from power system analysis to signal processing applications.
Related Micro-courses