Loading video…


 16 Concepts
 10.9K views

Video Summary: What are Sinusoidal Sources
Ever wonder why your smartphone charger works the same way whether you're in New York or California? The graphical and analytic representation of sinusoids explains how electrical power systems maintain consistent voltage delivery across America's vast grid network. What are Sinusoidal Sources? They're the mathematical foundation behind every electrical outlet in your home, generating the alternating current that powers everything from LED lights to gaming consoles. Watch the full video on JoVE Coach to master this concept with expert-led visuals and step-by-step explanations.
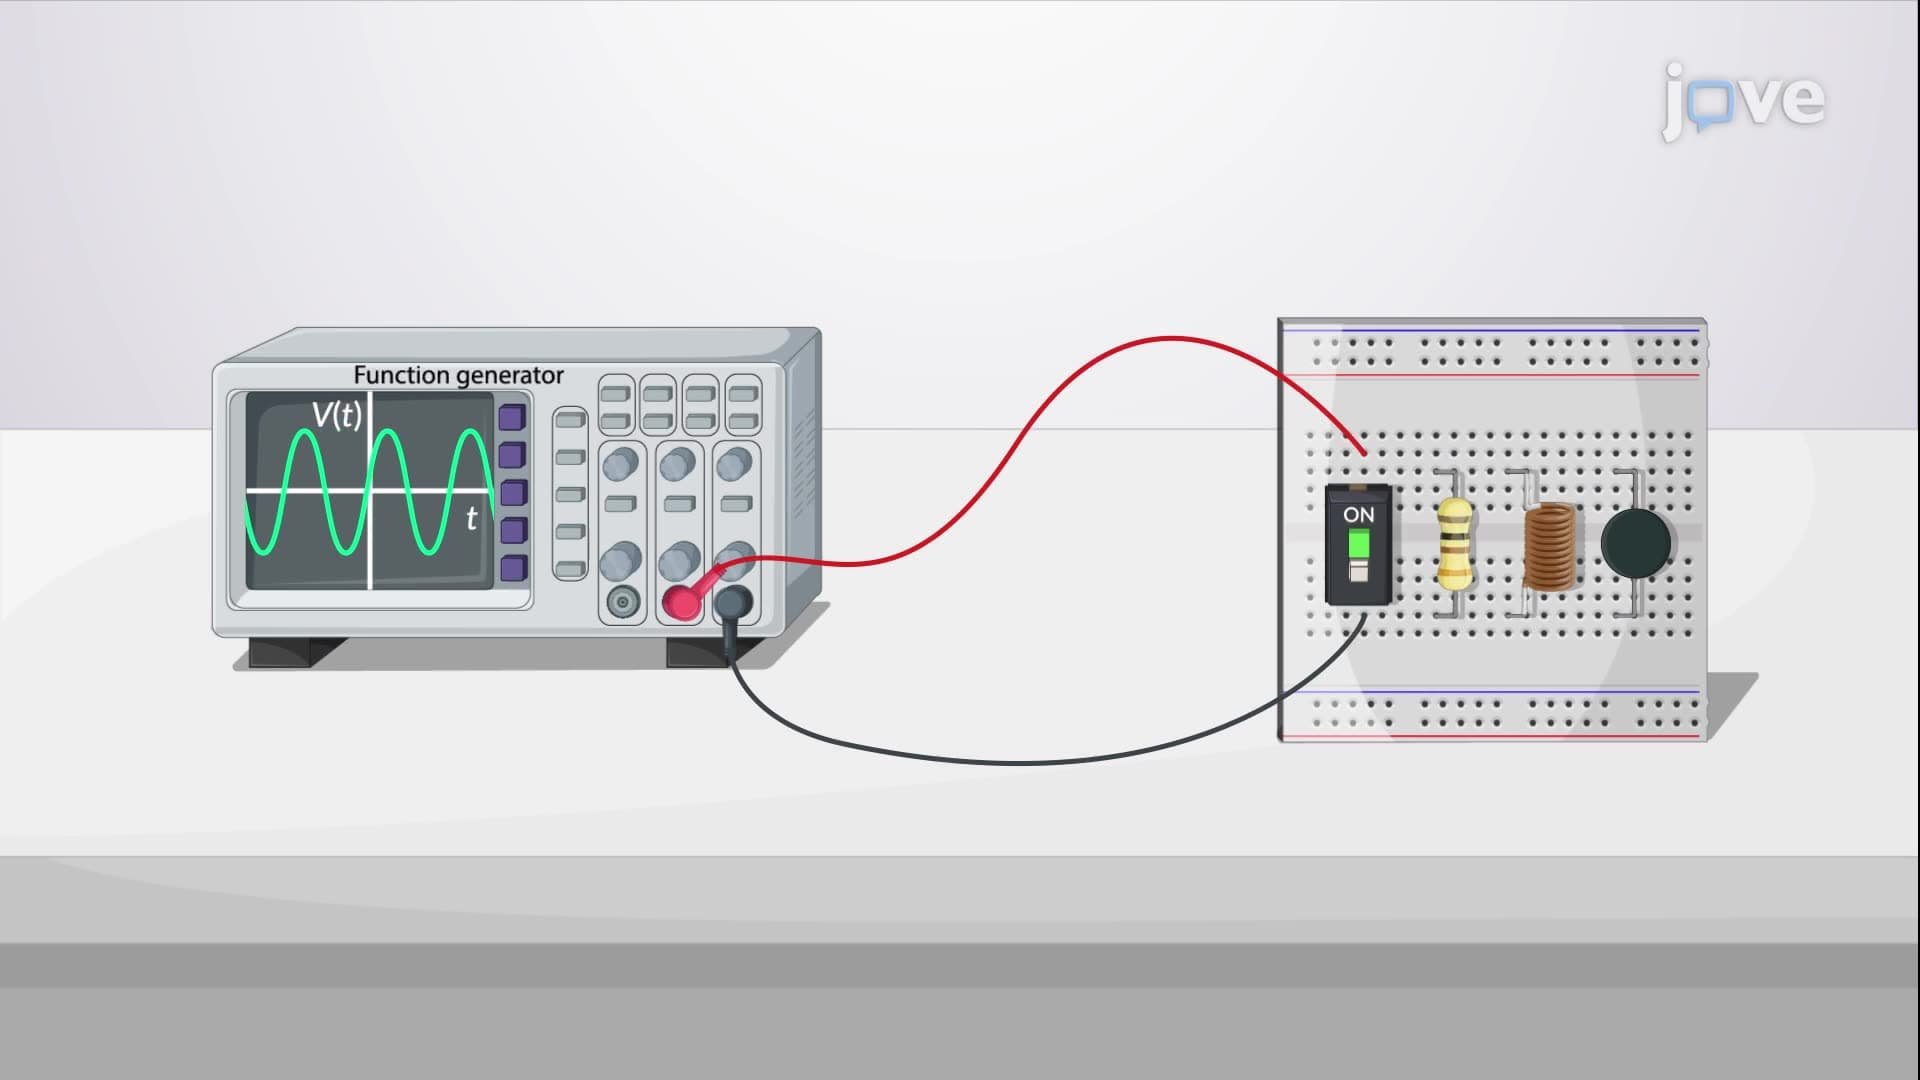
Sinusoidal sources form the backbone of modern electrical power distribution, generating the alternating current that flows through every power line in the United States. Unlike direct current (DC) that flows in one direction, these sources produce current that continuously reverses direction following a predictable mathematical pattern called a sinusoid.
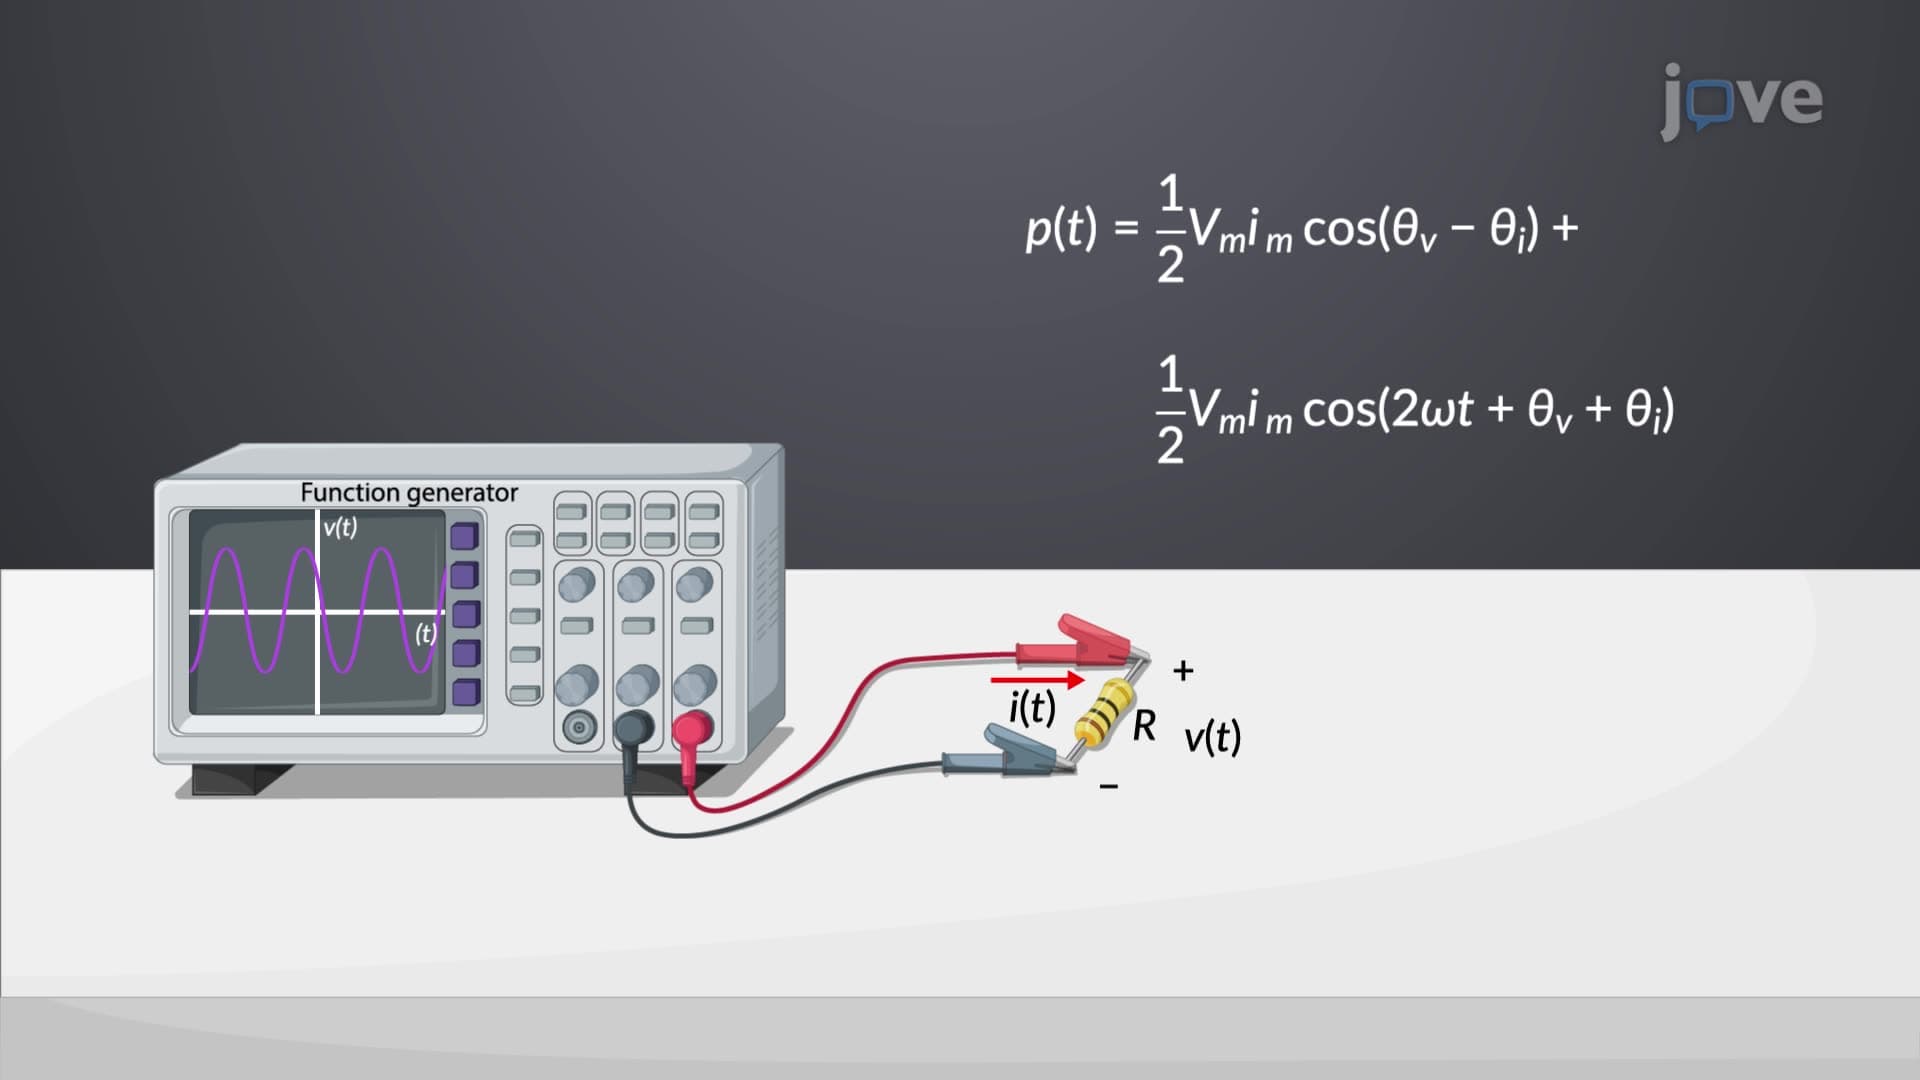
The graphical and analytic representation of sinusoids reveals three critical parameters that define any sinusoidal signal. Amplitude determines the maximum voltage or current value, representing the "strength" of the electrical signal. In US household applications, standard wall outlets deliver approximately 120 volts RMS (root mean square), which corresponds to a peak amplitude of about 170 volts.
Frequency, measured in Hertz (Hz), indicates how many complete cycles occur per second. The US electrical grid operates at 60 Hz, meaning the current direction reverses 120 times every second. This frequency choice optimizes power transmission efficiency while minimizing electromagnetic interference. The period (T) represents the time for one complete cycle, mathematically related to frequency by T = 1/f.
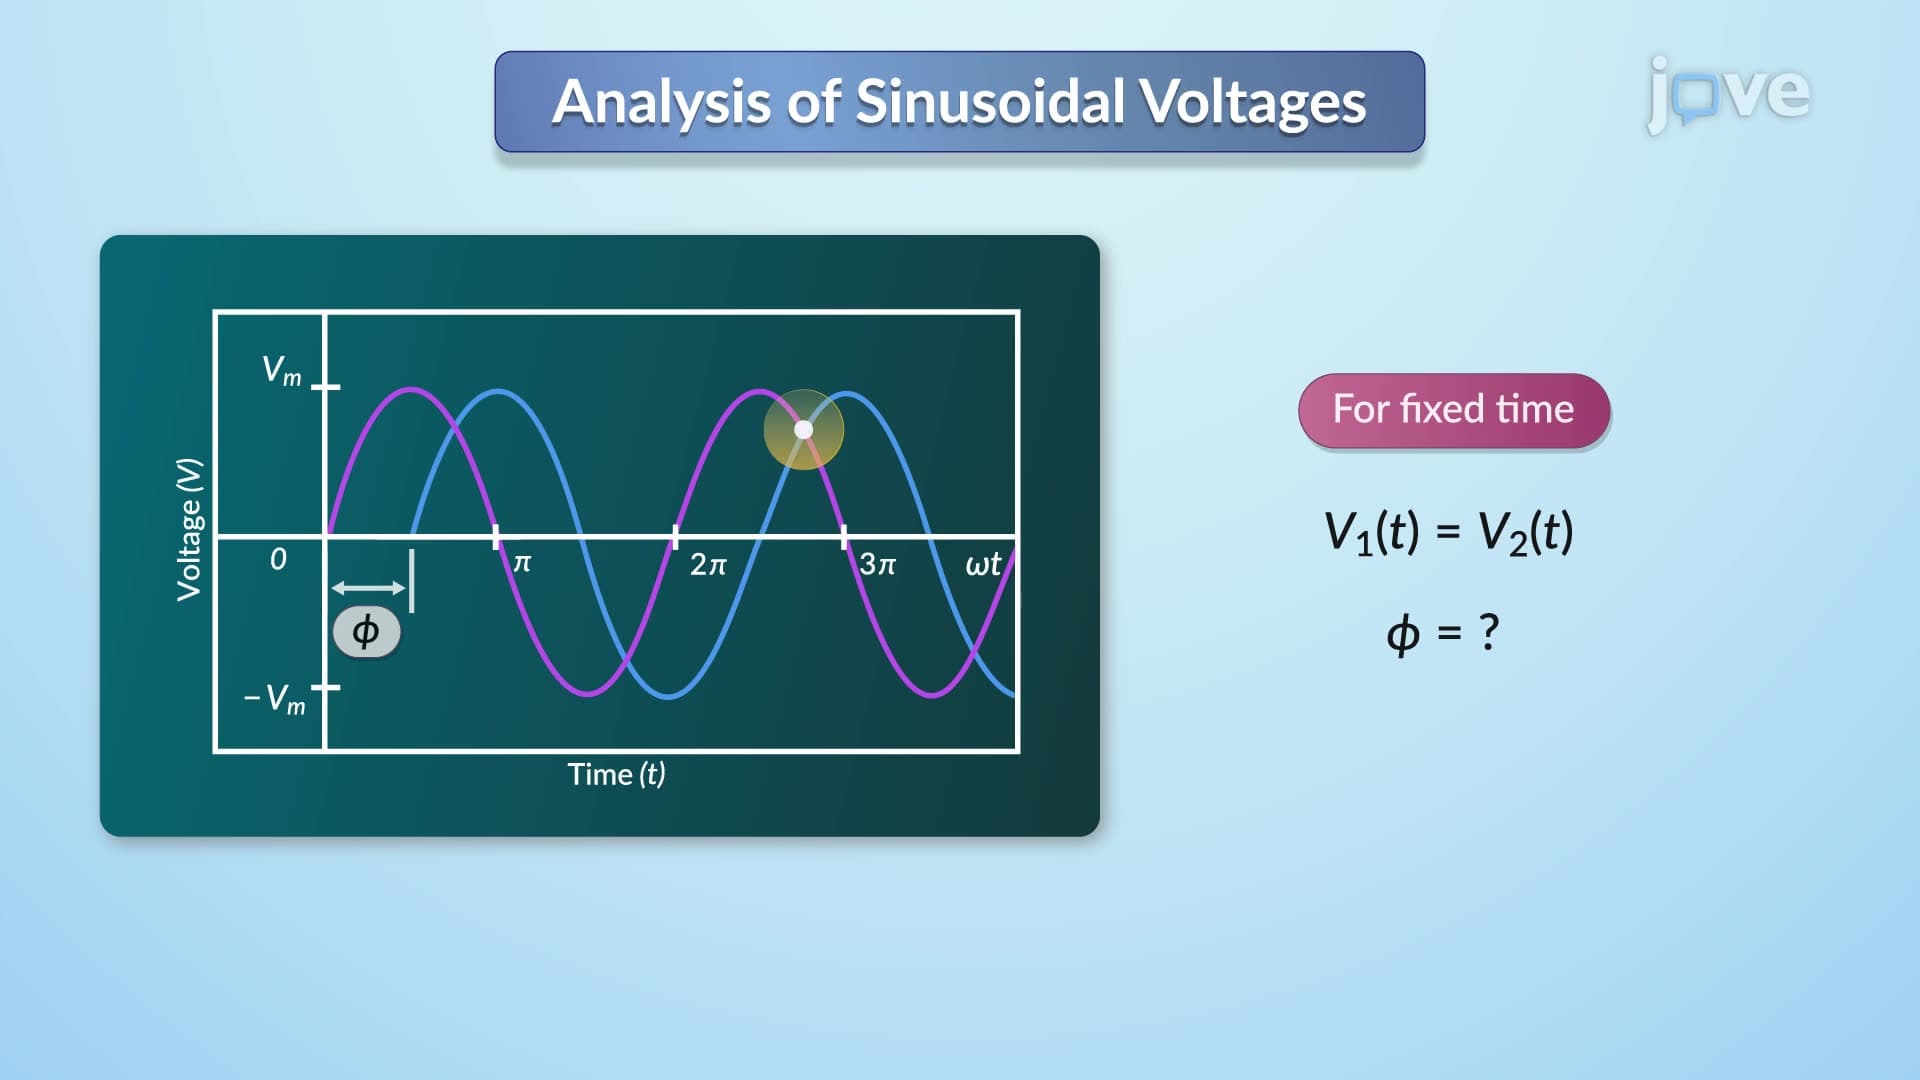
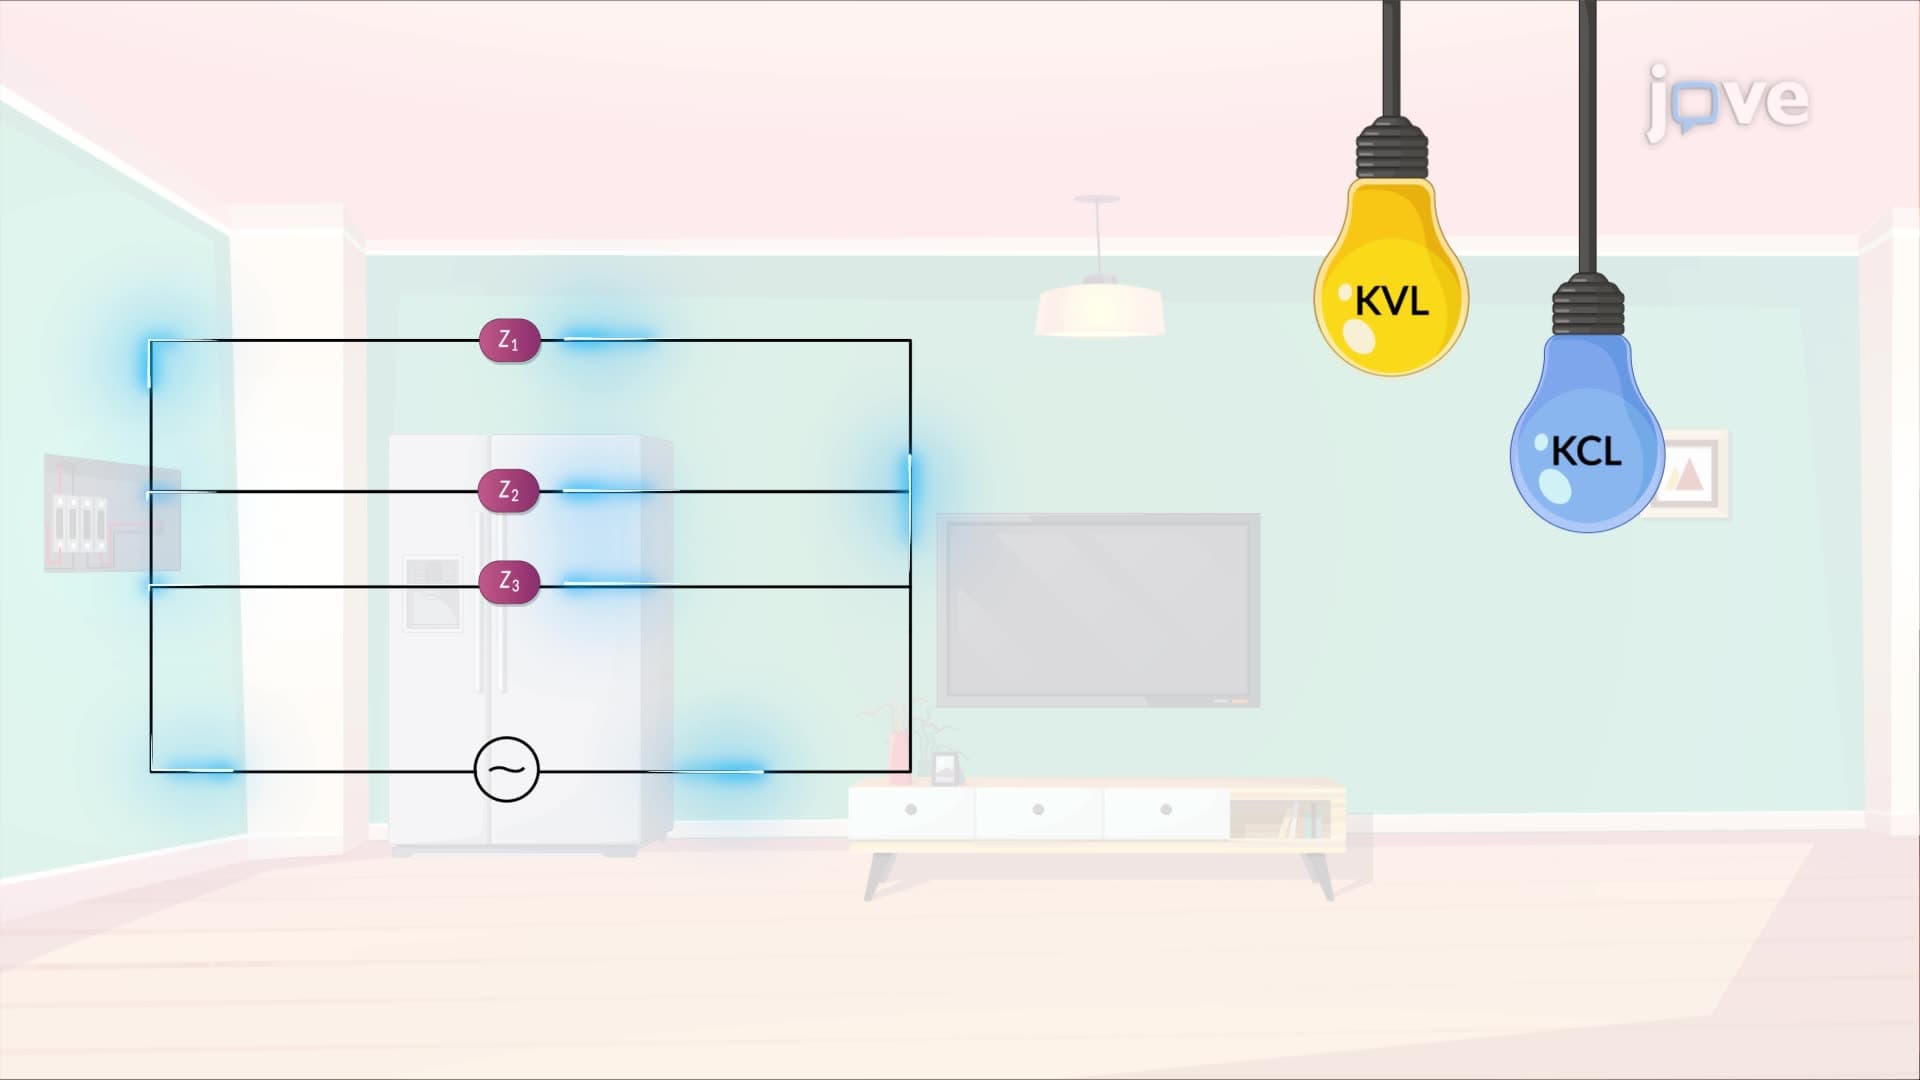
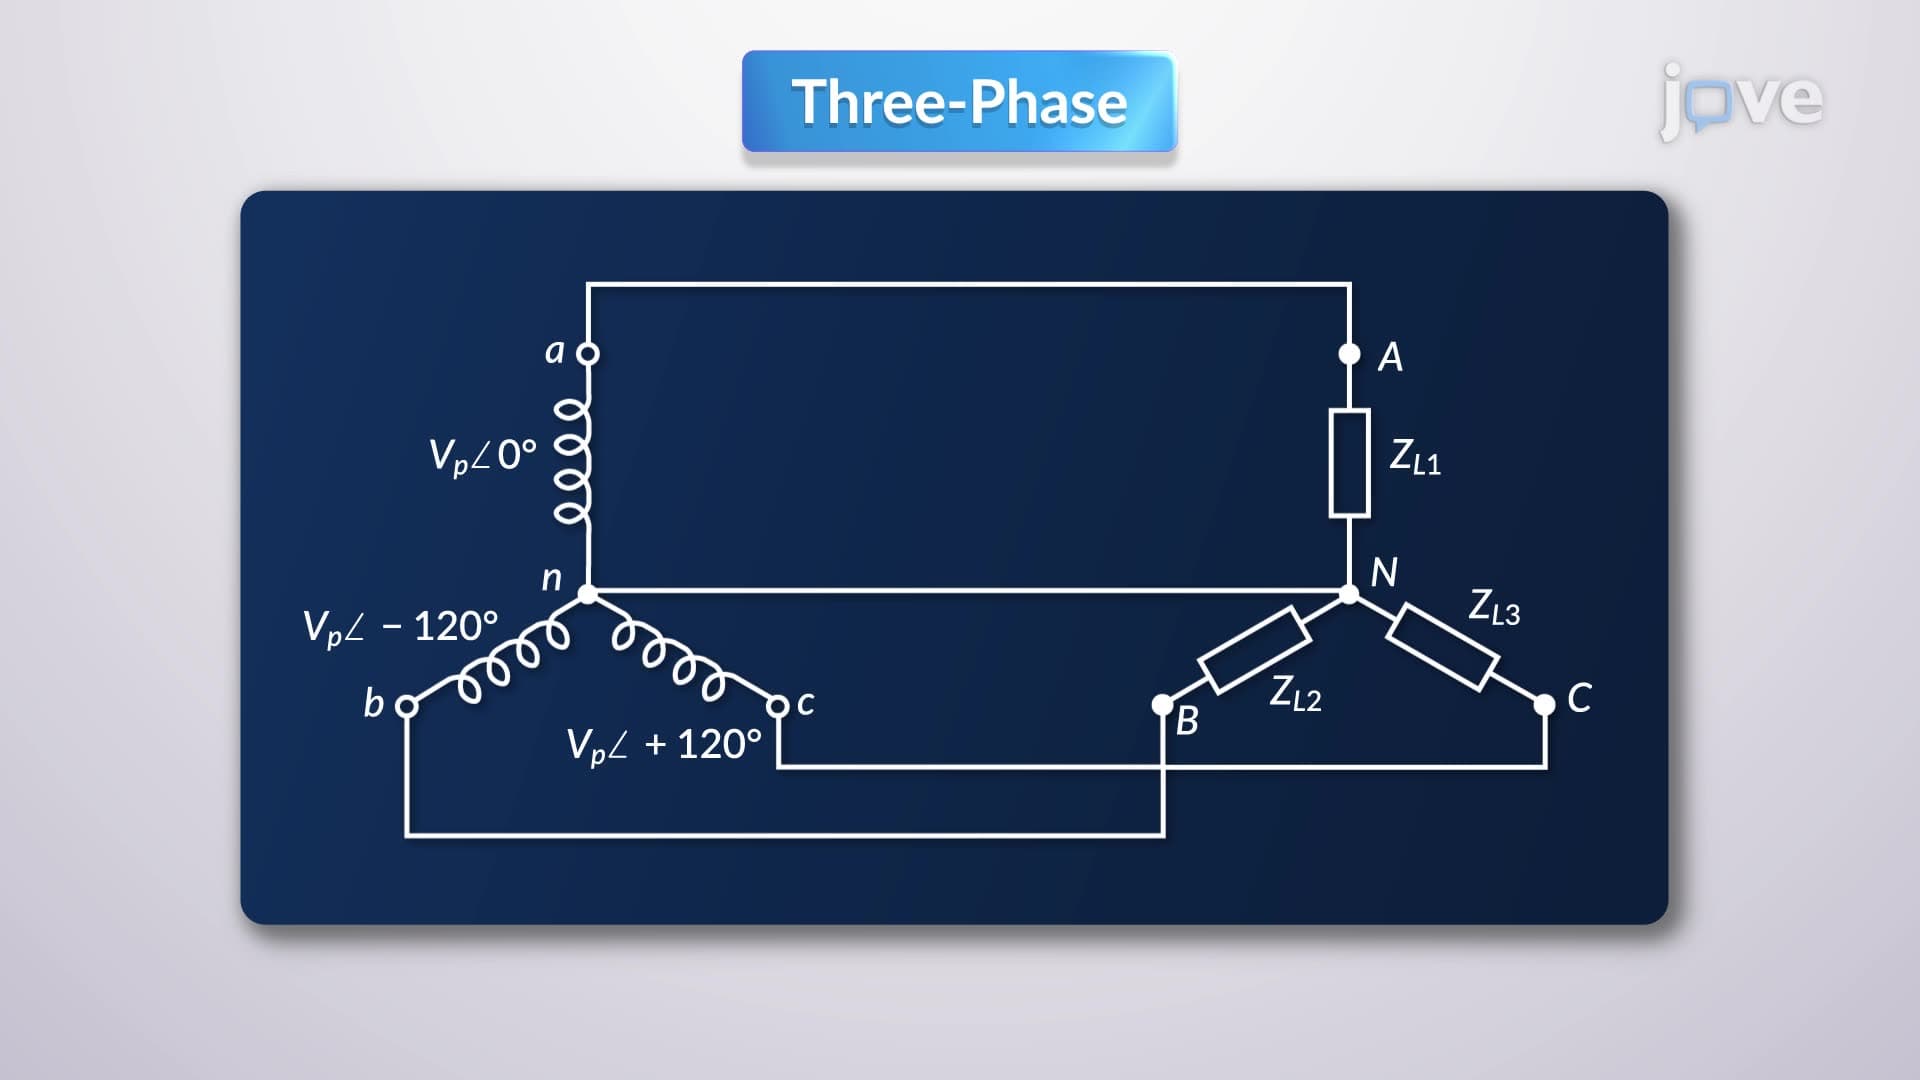
Phase differences between sinusoidal signals become crucial in three-phase power systems used by American industries and large commercial buildings. When multiple sinusoids operate "out of phase," they reach maximum and minimum values at different times. This phase separation enables more efficient power transmission and reduces wire requirements in electrical installations.
Power companies like ConEd in New York and Pacific Gas & Electric in California utilize these phase relationships to deliver electricity across vast distribution networks. The graphical and analytic representation of sinusoids concept helps electrical engineers design transformer stations and switching equipment that maintain voltage stability from generation facilities to your home.
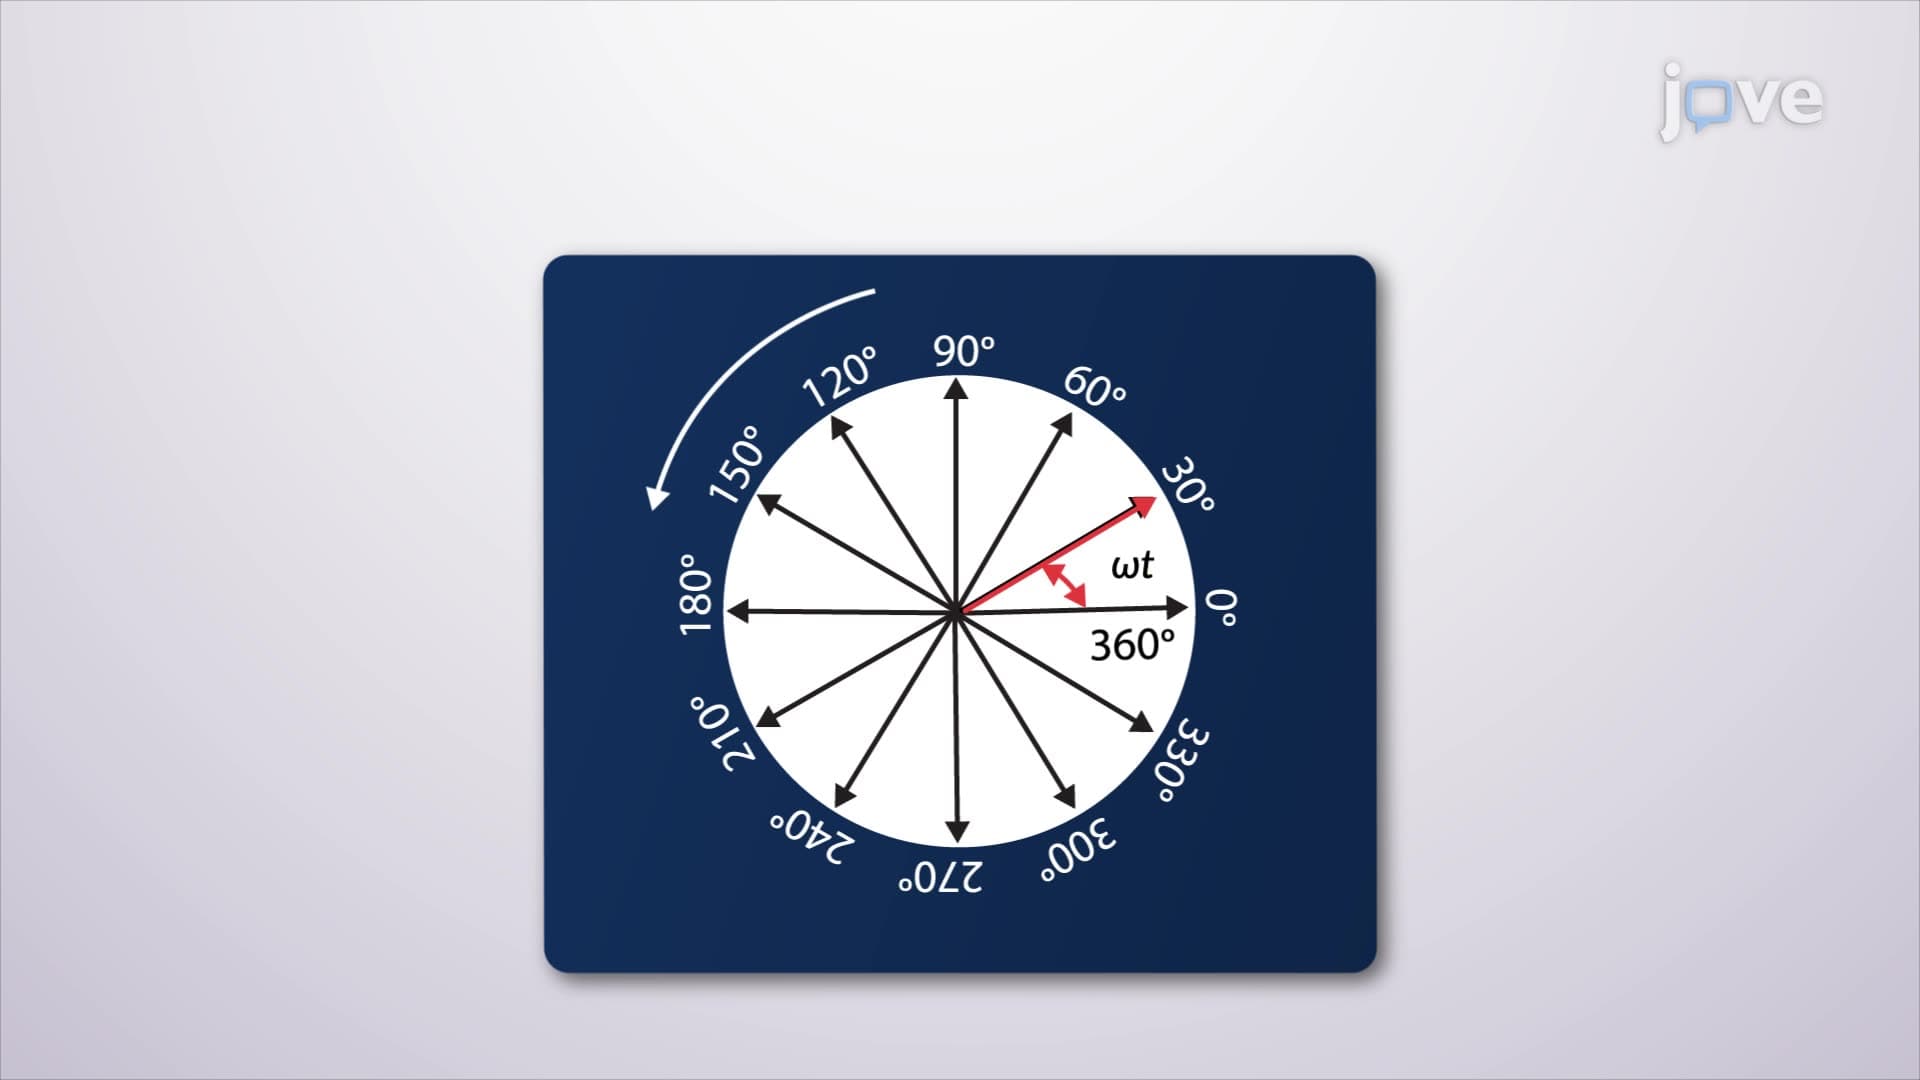
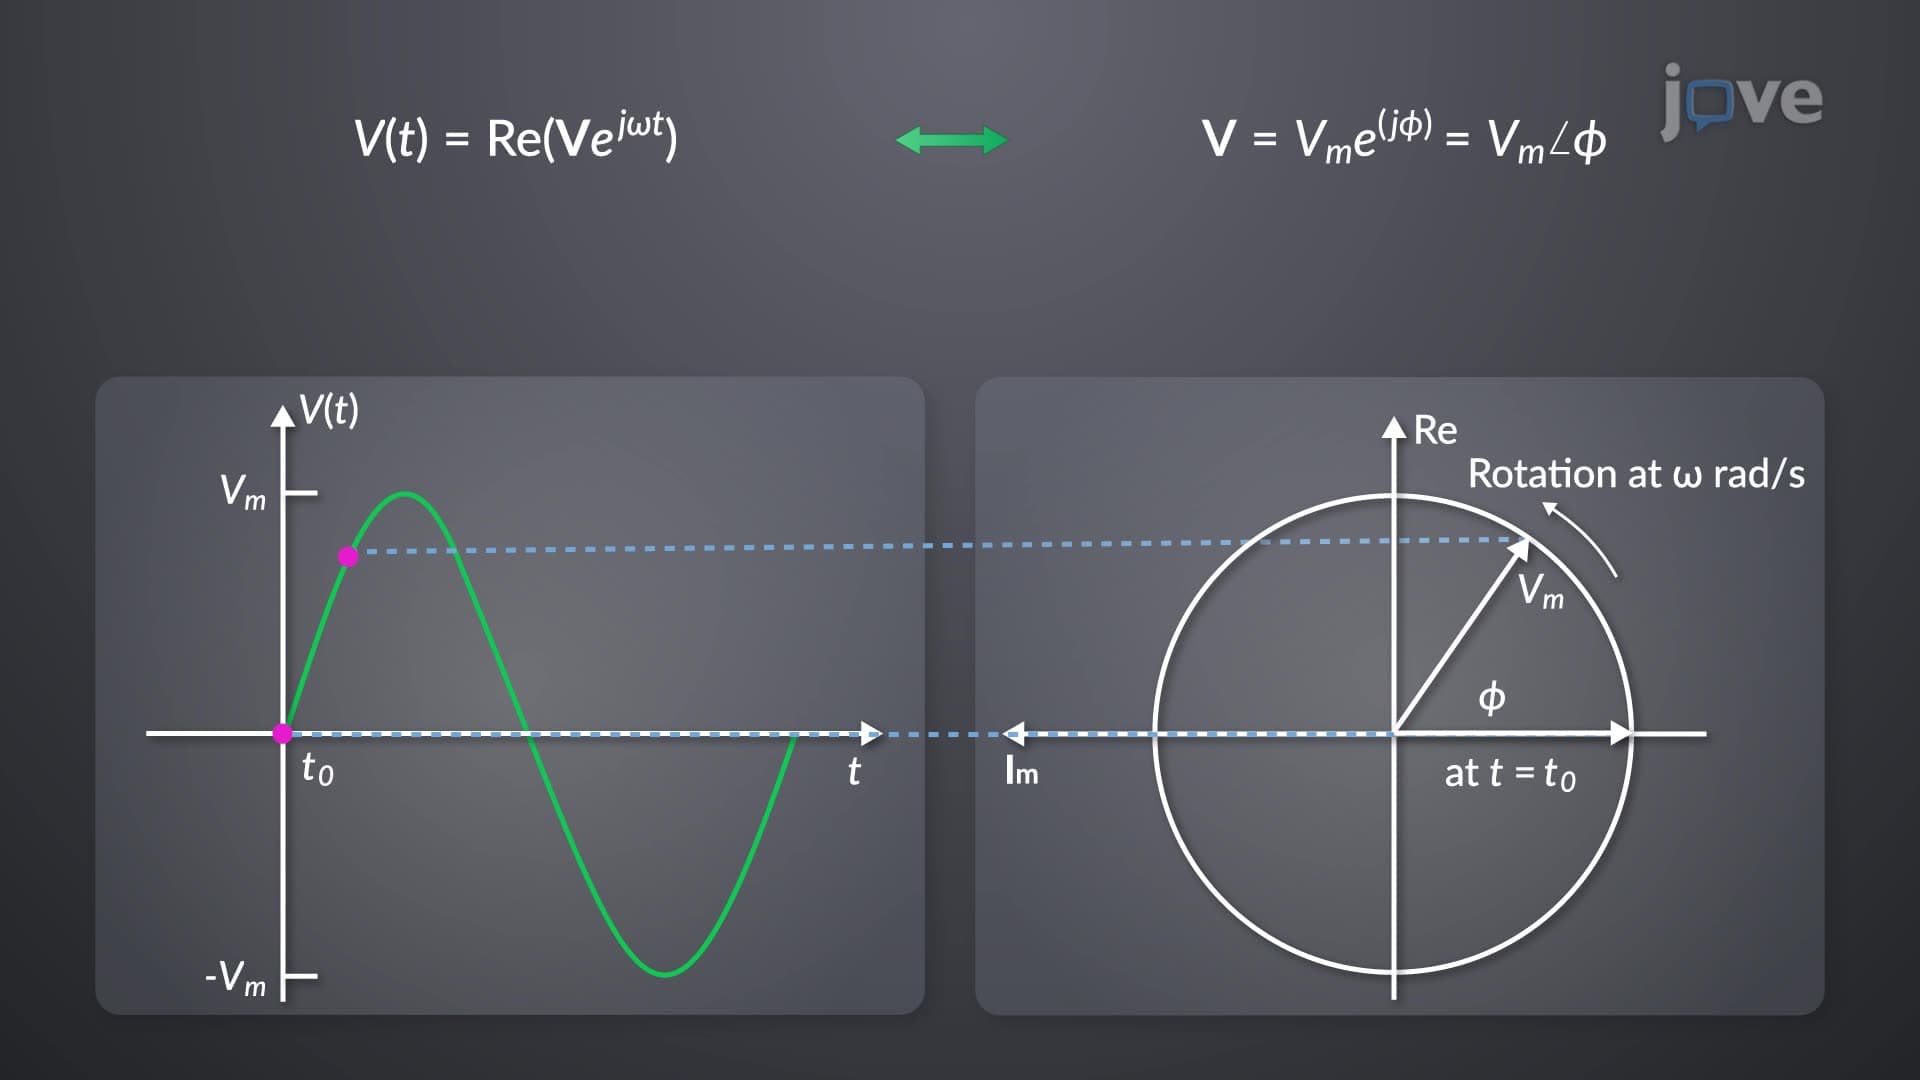
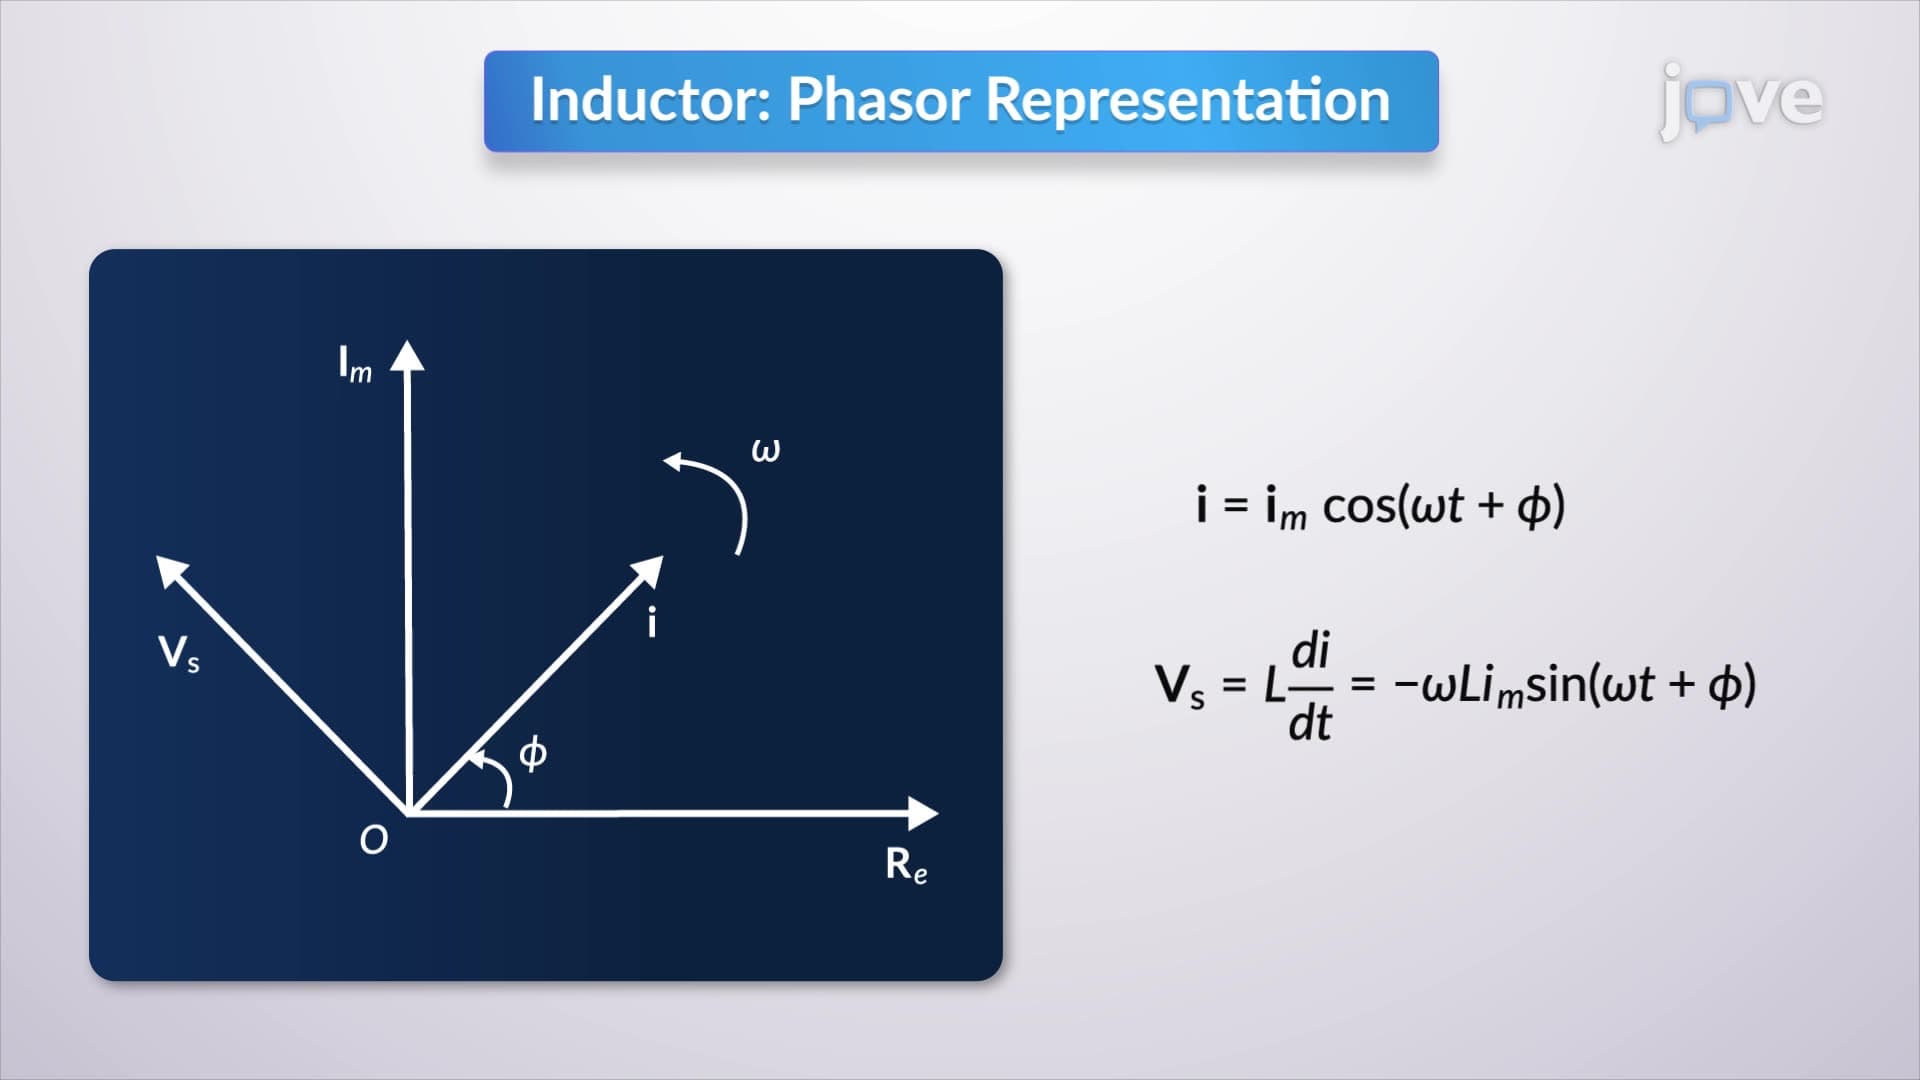
Students preparing for AP Physics exams encounter sinusoidal functions when studying electromagnetic waves and AC circuit analysis. College-level electrical engineering courses at institutions like MIT and Stanford extensively cover phasor diagrams-graphical tools that represent sinusoidal quantities as rotating vectors. The NCEES Fundamentals of Engineering exam tests understanding of sinusoidal sources in power systems analysis, making this concept essential for aspiring professional engineers.
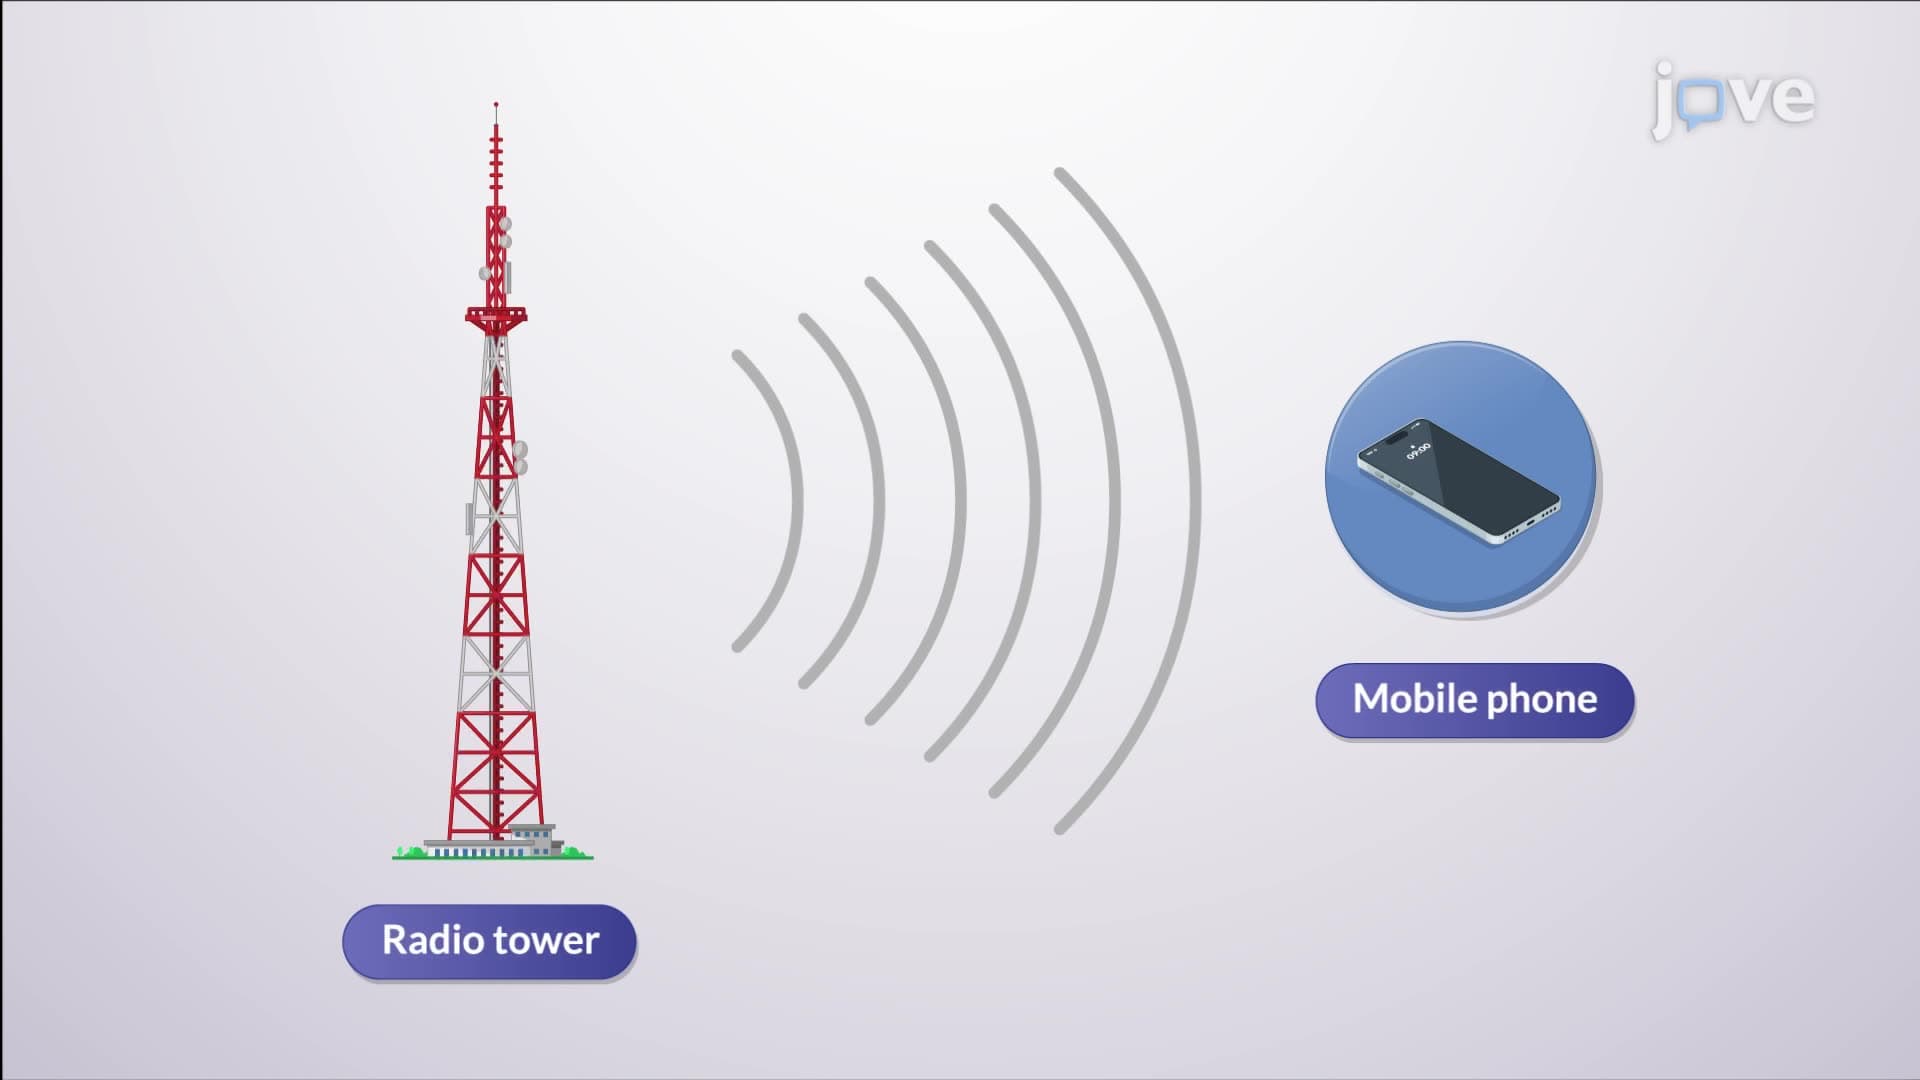
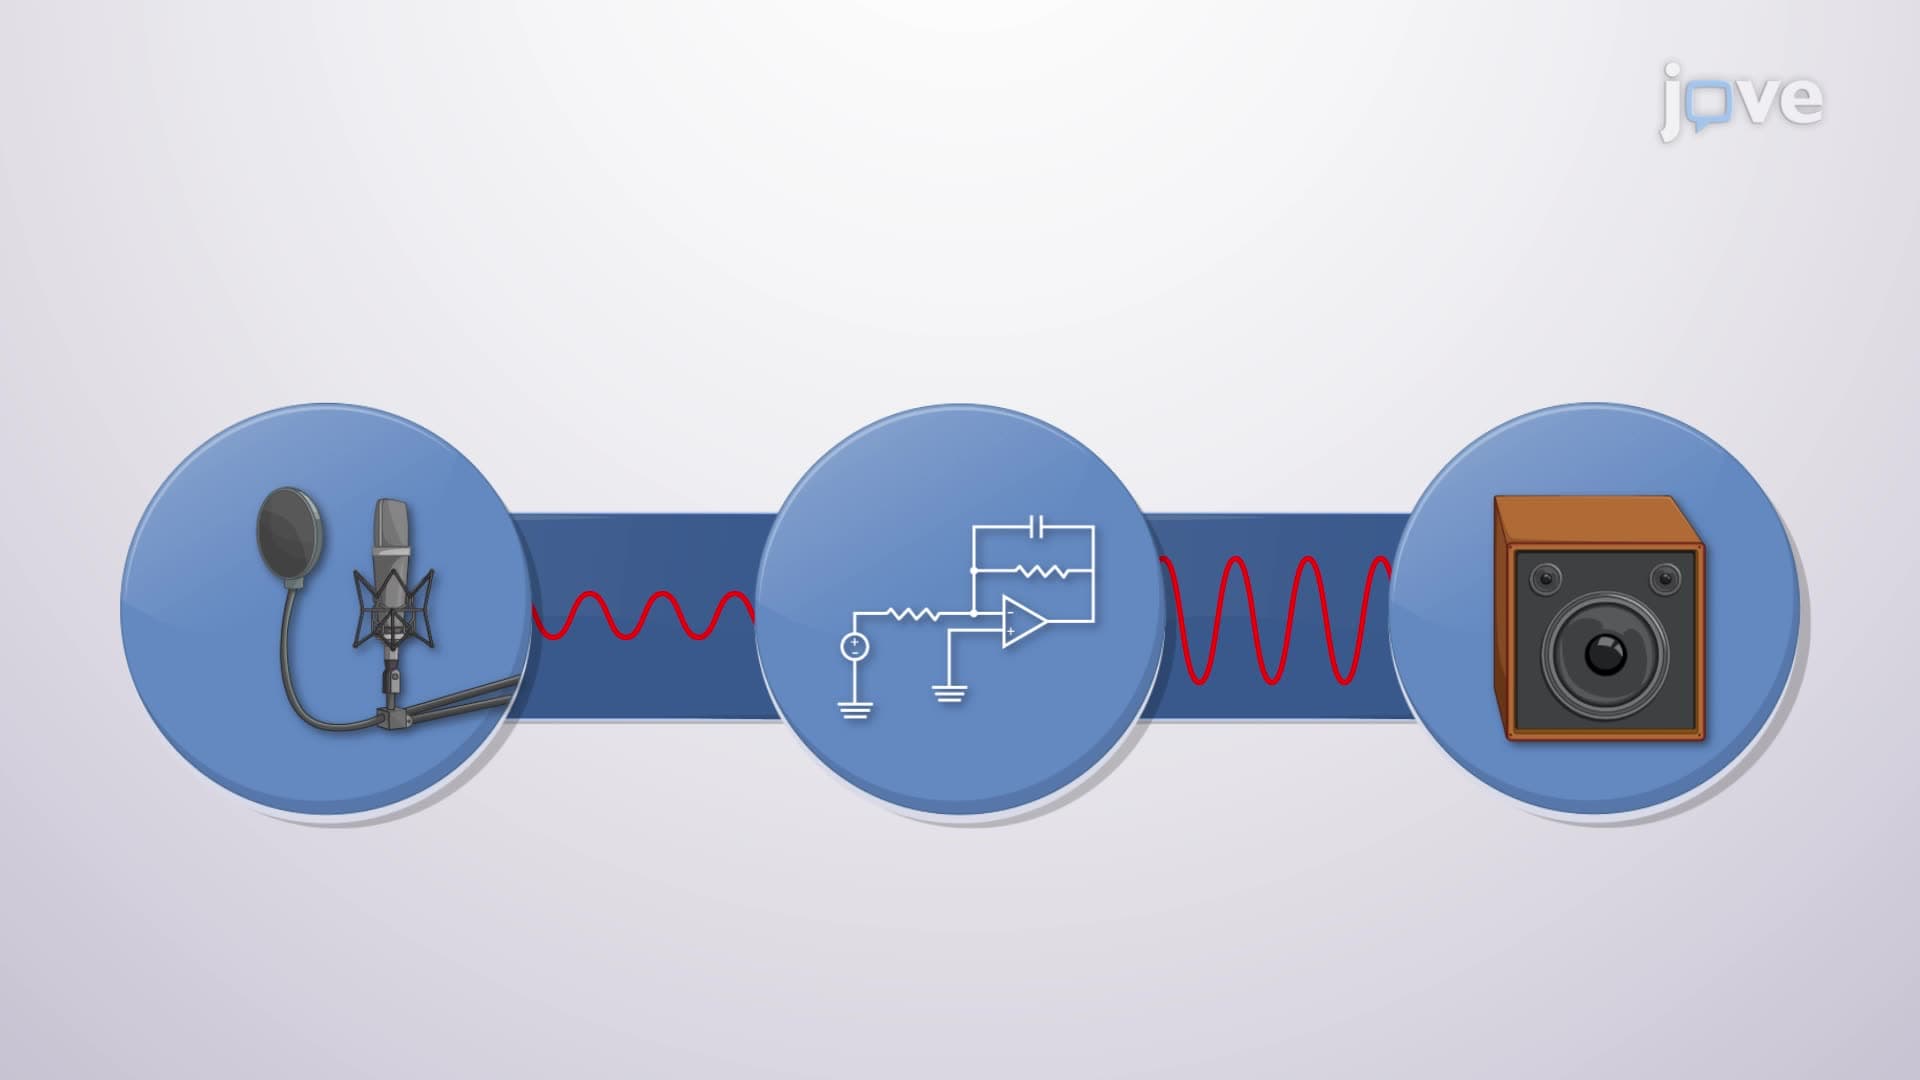
Understanding sinusoidal mathematics also applies to signal processing, wireless communications, and even mechanical vibration analysis. From analyzing earthquake data at USGS monitoring stations to designing audio equipment for Nashville recording studios, the principles remain fundamentally the same across diverse engineering disciplines.
Related Micro-courses