Loading…
Loading video…
130,604 views

Did you know that pharmaceutical companies use statistical methods to determine if new medications are truly effective before FDA approval? The decision making p value method provides a systematic approach to hypothesis testing by comparing calculated probabilities against predetermined significance levels. For instance, when Pfizer tested their COVID-19 vaccine efficacy, researchers used p-value calculations to demonstrate statistical significance. This Decision Making P Value Method Guide breaks down the step-by-step process from hypothesis formation through final statistical conclusions. Watch the full video on JoVE Coach to master this concept with expert-led visuals and step-by-step explanations.
The decision making p value method represents a cornerstone of statistical inference, offering researchers and analysts a quantitative approach to hypothesis testing. Unlike traditional critical value methods, this approach directly calculates the probability of observing test results at least as extreme as those obtained, assuming the null hypothesis is true. This methodology has become the gold standard in fields ranging from medical research at institutions like Johns Hopkins University to quality control processes at major US corporations like General Electric.
The systematic approach begins with hypothesis formulation, where researchers establish both null (H₀) and alternative (H₁) hypotheses. For population parameters, these might take forms such as H₀: μ = μ₀ versus H₁: μ ≠ μ₀ for two-tailed tests. The significance level selection follows, with α = 0.05 representing the standard in most social sciences, while α = 0.01 provides more stringent criteria for medical and pharmaceutical research. Test statistic calculation depends on the parameter being tested—z-tests for large samples, t-tests for small samples with unknown population standard deviation, or chi-square tests for categorical data.
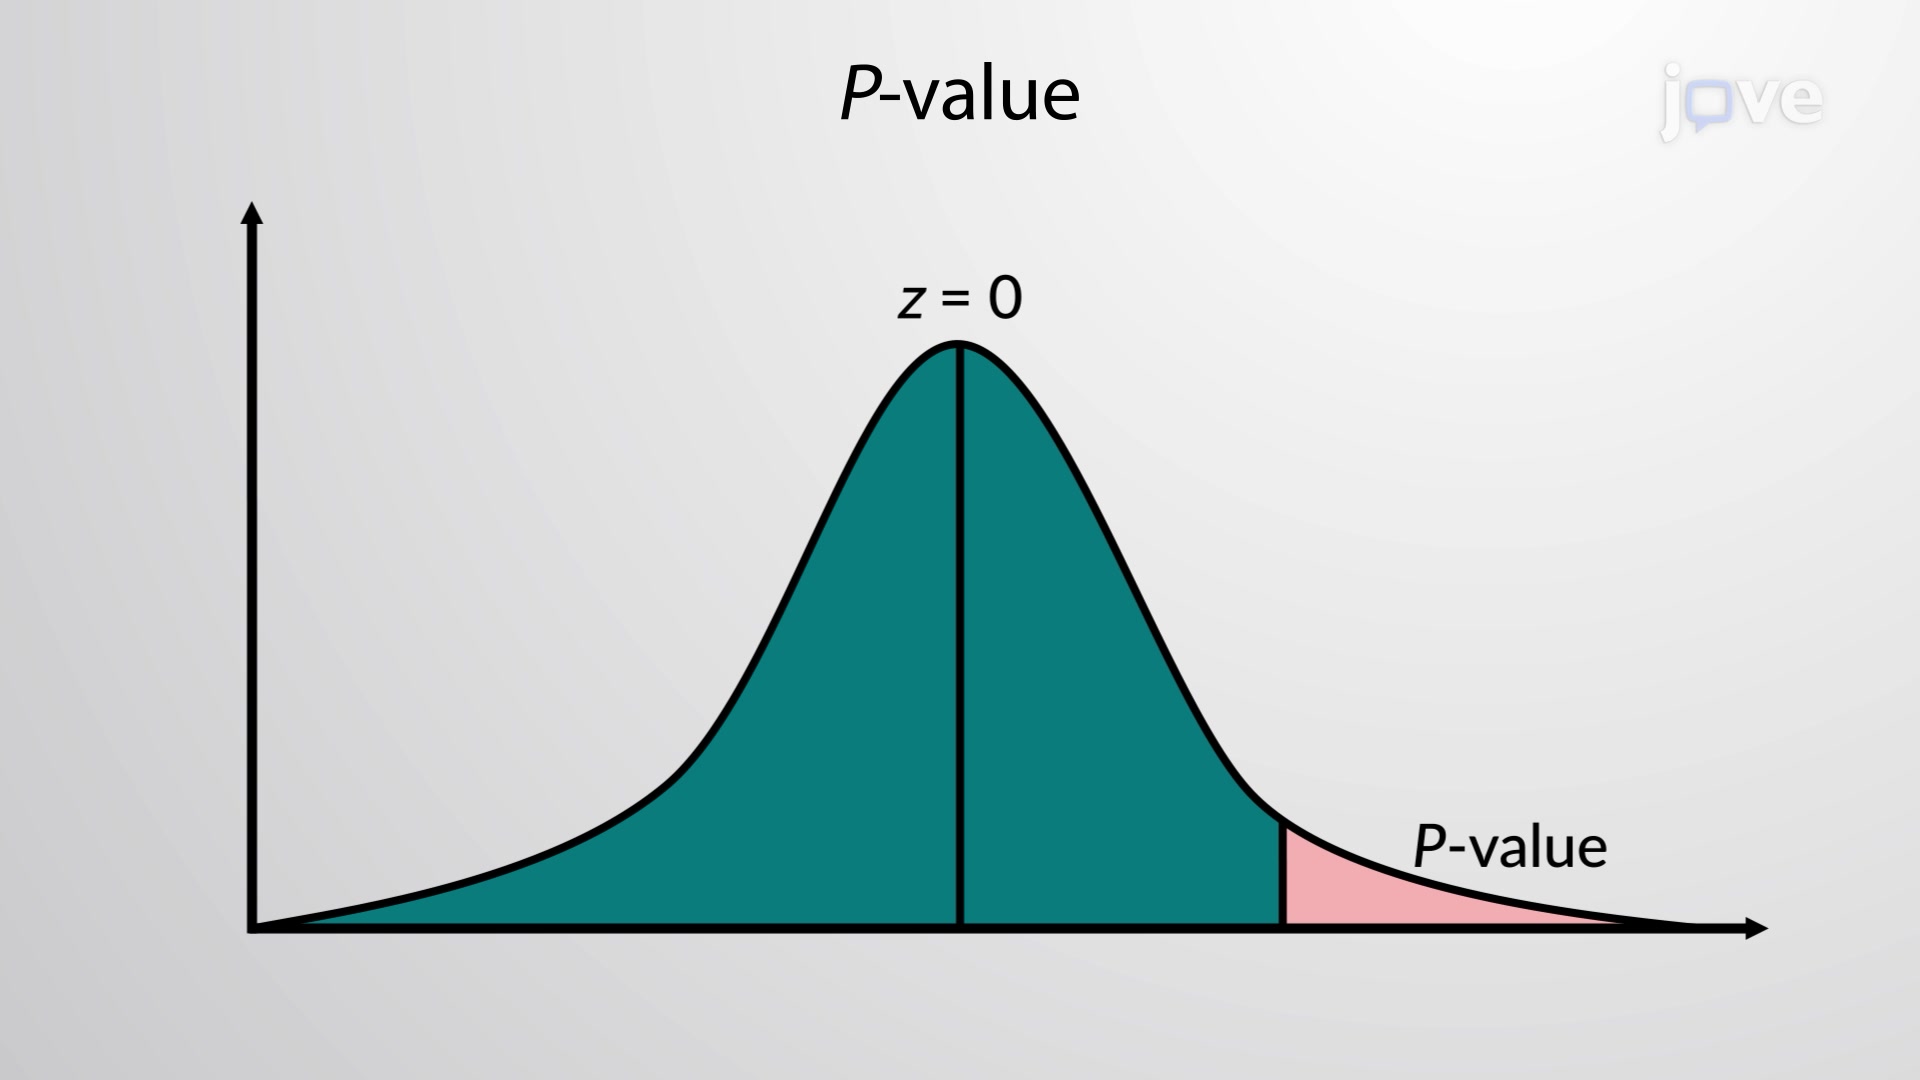
The p-value represents the probability of obtaining results at least as extreme as observed, given that the null hypothesis is true. For example, if testing whether a new teaching method improves standardized test scores, a p-value of 0.03 indicates a 3% chance of observing such improvement (or greater) purely by random variation. This interpretation becomes crucial for AP Statistics students and college undergraduates preparing for comprehensive exams, as understanding p-values directly impacts performance on standardized assessments.
Students encounter p-value methodology extensively in AP Statistics curricula and college-level courses at universities like UCLA and University of Michigan. The method appears frequently on standardized exams, including AP Statistics free-response questions and college statistics midterms. Professional applications span quality control in manufacturing, clinical trial analysis in pharmaceutical development, and A/B testing in technology companies like Google and Facebook. Understanding when p-values indicate statistical significance versus practical significance helps students develop critical thinking skills essential for STEM careers and graduate school preparation.
Frequently Asked Questions
The decision making p value method is a statistical technique that uses calculated probabilities to test hypotheses about population parameters. It compares a computed p-value against a predetermined significance level to determine whether to reject or fail to reject the null hypothesis. This method provides objective criteria for making statistical decisions based on sample data evidence.
AP Statistics exams frequently test p-value interpretation through multiple-choice questions and free-response problems involving hypothesis testing scenarios. College statistics courses emphasize p-value calculations for various test statistics, including z-tests, t-tests, and chi-square tests. Students must demonstrate understanding of significance levels, decision rules, and proper statistical conclusions.
Both methods reach identical conclusions but use different comparison strategies. The p-value method compares calculated probabilities against significance levels, while critical value method compares test statistics against critical boundaries. MCAT questions may present either approach, so understanding both methodologies ensures comprehensive preparation for behavioral sciences sections.
Pharmaceutical companies like Merck and Johnson & Johnson use p-value analysis to demonstrate drug efficacy and safety in clinical trials. FDA approval processes require statistically significant results (typically p < 0.05) to prove new medications outperform existing treatments or placebos. This ensures patient safety and treatment effectiveness before market release.
Basic algebra and introductory statistics knowledge provide sufficient foundation for p-value methodology. High school students in Algebra II or Pre-Calculus can successfully learn these concepts with proper instruction. The method emphasizes logical reasoning and interpretation skills more than complex mathematical calculations, making it accessible to diverse academic backgrounds.
Practice with real data sets strengthens understanding more effectively than memorizing formulas alone. Create decision flowcharts outlining the five-step hypothesis testing process, work through diverse examples from different fields, and focus on interpretation skills. Form study groups to discuss statistical conclusions and practice explaining p-value meanings in plain language.
P-value methodology forms the foundation for advanced topics including ANOVA, regression analysis, and multivariate statistics. Students who master basic p-value interpretation find greater success in upper-level courses at universities and graduate programs. This knowledge proves essential for research methods courses across psychology, biology, economics, and engineering disciplines.
Healthcare professionals use p-values in clinical research and evidence-based medicine practices. Market research analysts at companies like Nielsen employ hypothesis testing for consumer behavior studies. Quality control engineers in manufacturing apply statistical methods for process improvement. Data scientists across technology, finance, and consulting industries use p-value methodology for business intelligence and predictive analytics.
Related Micro-courses


Related Subjects


