Loading subject page…


2,128 views

Video Summary: Phase Diagrams of Ternary Systems Guide
Did you know that mixing just three liquids can create a system where two separate liquid layers exist, until a fourth factor tips everything into one? Phase diagrams of ternary systems basics reveal exactly how that happens. In US pharmaceutical labs, scientists use these diagrams to design drug formulations involving water, oil, and surfactants. The Phase Diagrams of Ternary Systems Guide maps compositions on a triangular plot, showing when mixtures split into phases or merge into one. Watch the full video on JoVE Coach to master this concept with expert-led visuals and step-by-step explanations.
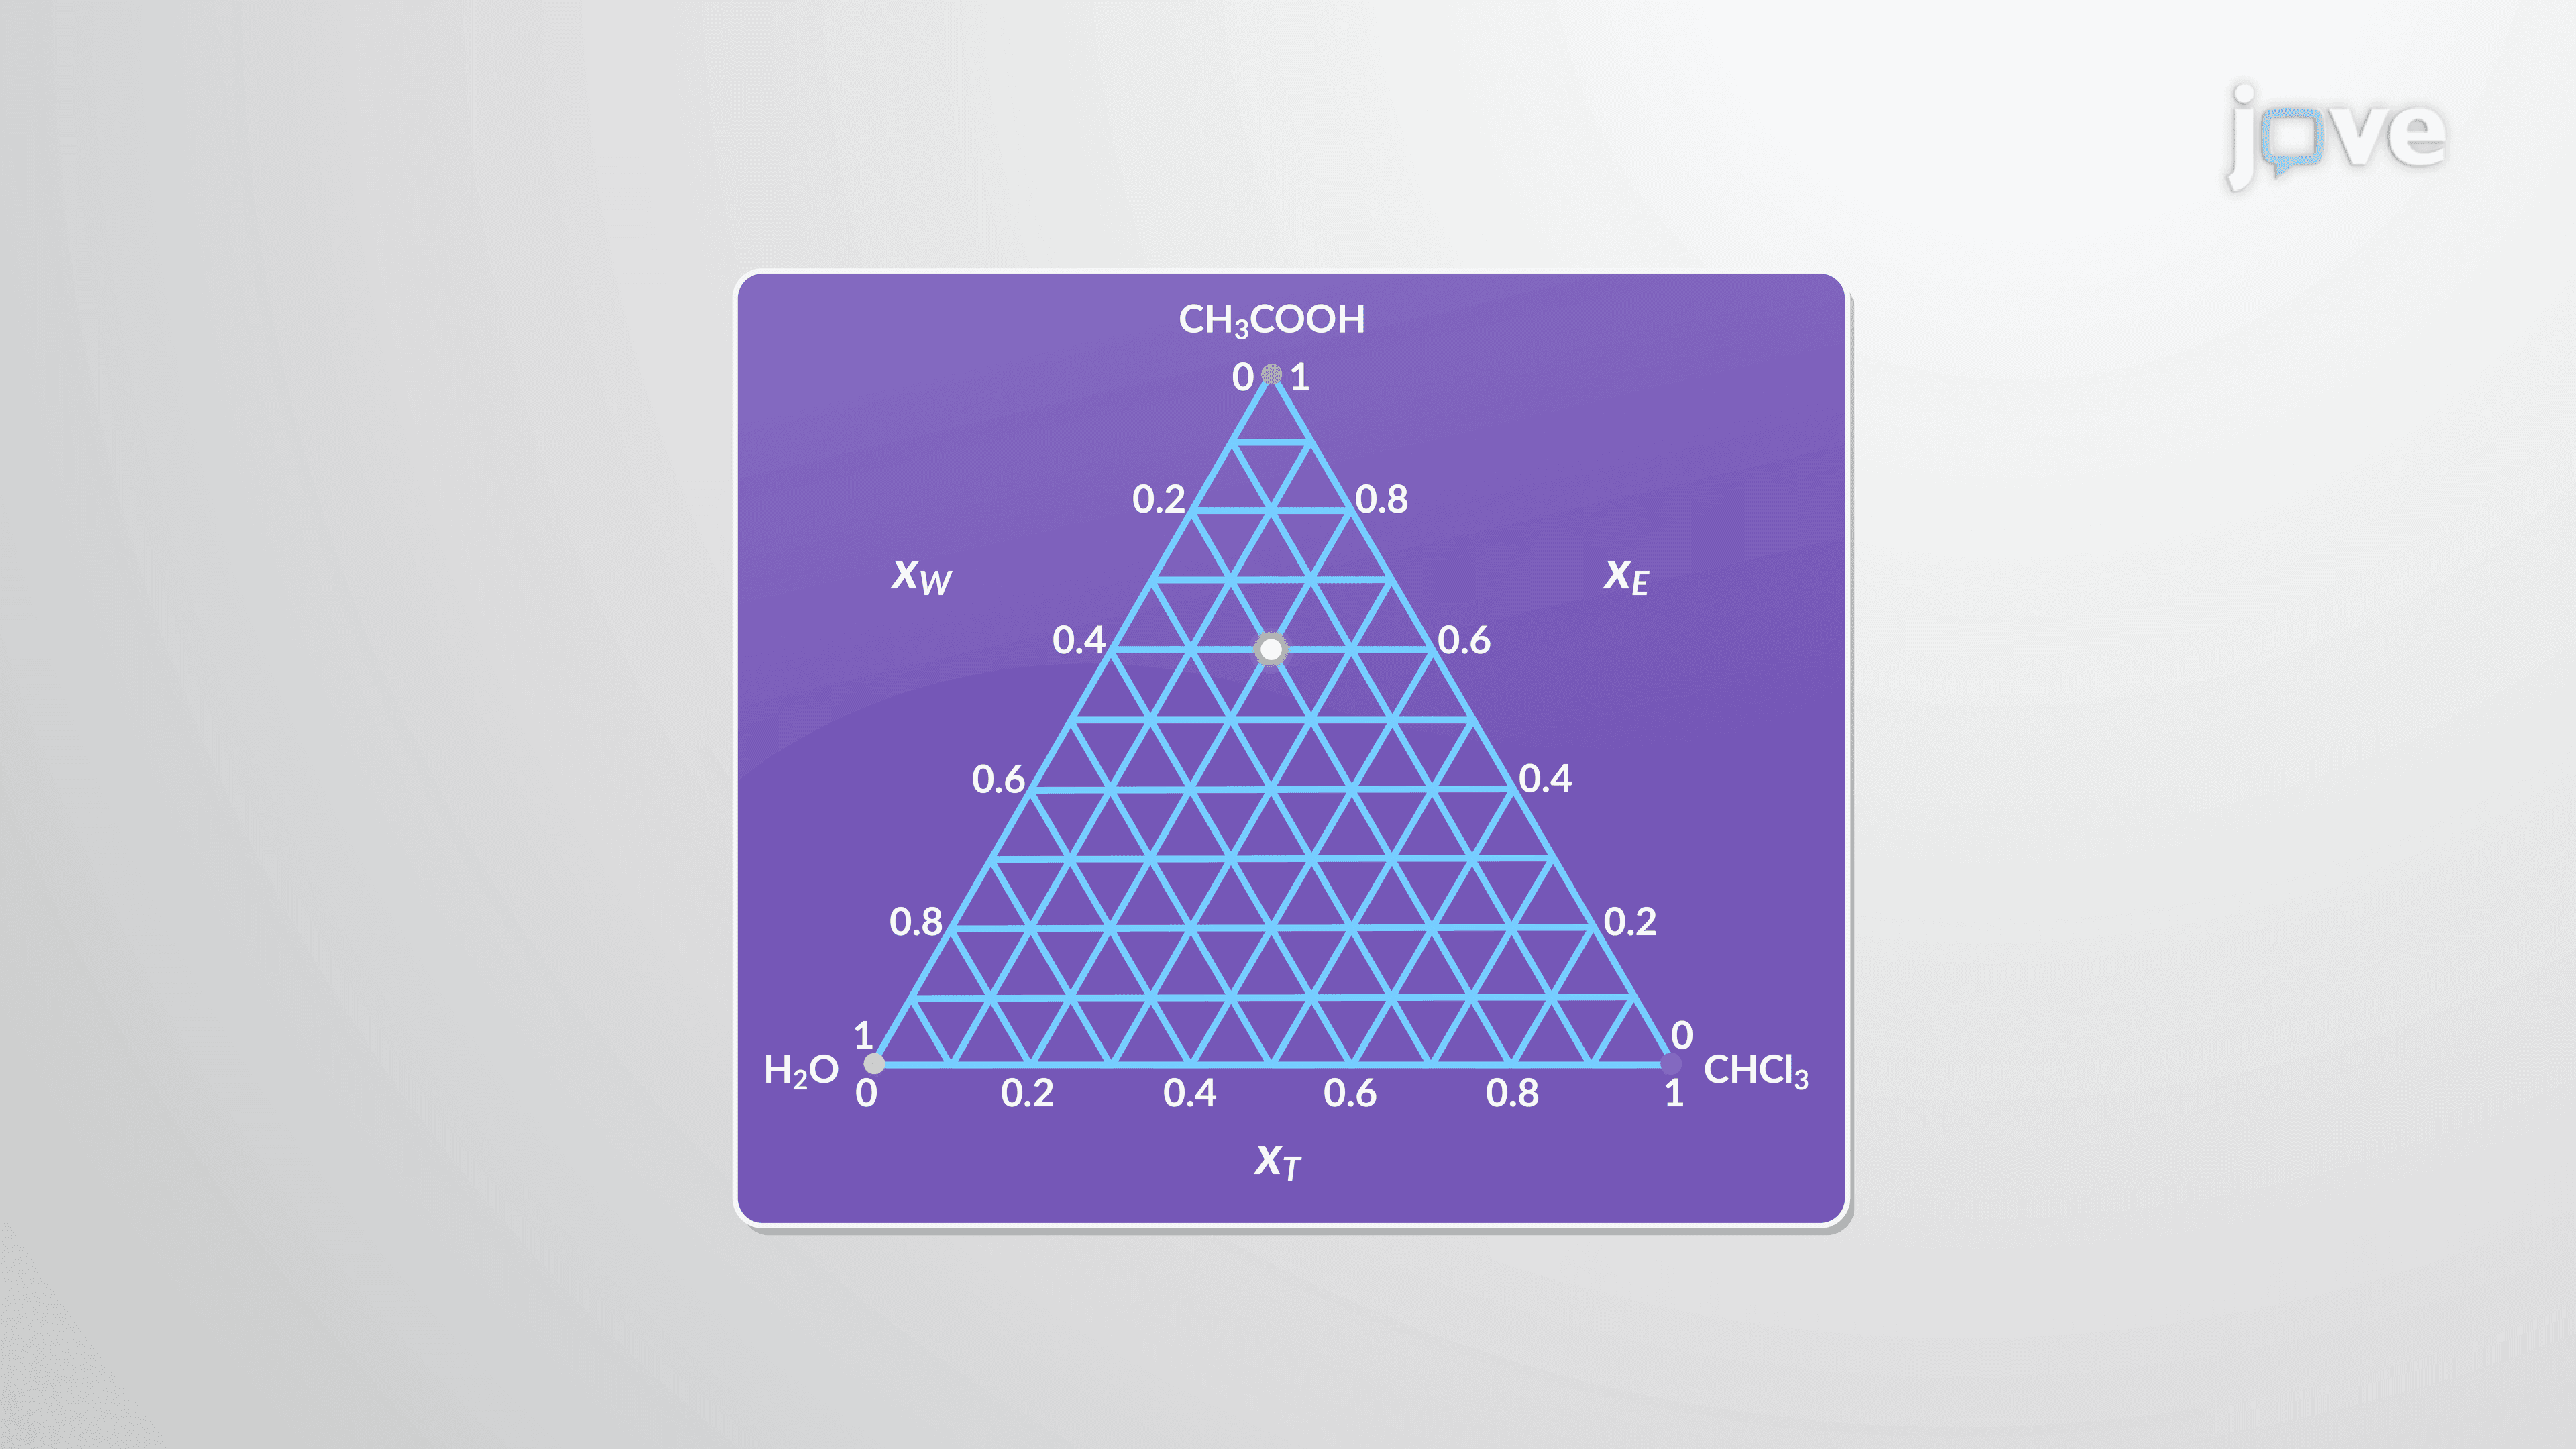
A phase diagram of a ternary system is a graphical tool that maps all possible composition combinations of three components and predicts whether those mixtures exist as one phase or separate into two or more phases. Unlike binary phase diagrams, which use a simple two-axis plot, ternary diagrams are plotted on an equilateral triangle, where each apex (corner) represents a pure component (100%), each edge represents a two-component (binary) mixture, and every interior point represents a mixture of all three components. Reading these diagrams correctly is a core skill in physical chemistry courses at US universities and appears in coursework for chemical engineering, pharmacy, and materials science.
Every point inside the triangle satisfies one rule: the three composition values must add up to 100%. To read any interior point, you draw lines parallel to the opposite sides of the triangle and read off the percentage of each component where those lines intersect the corresponding axis. This coordinate system is elegant because it compresses what would otherwise be a three-dimensional problem into a flat, readable 2D diagram. Students preparing for college-level general chemistry or AP Chemistry should practice locating and interpreting points on triangular plots, as this skill reinforces proportional reasoning and systems thinking.
The binodal curve is the most important feature of a ternary liquid-liquid equilibrium diagram. It divides the triangular space into two regions: inside the curve is the two-phase region, where the mixture spontaneously separates into two distinct liquid layers; outside the curve is the single-phase region, where everything blends into one homogeneous liquid. Within the two-phase region, tie lines connect the compositions of the two coexisting phases, similar in function to the lever rule used in binary phase diagrams. The relative lengths of the tie line segments tell you the relative amounts of each phase present, directly applying the lever rule principle to ternary systems. This is closely related to liquid-liquid equilibrium, a concept tested on the MCAT and covered extensively in undergraduate physical chemistry (PChem) courses across US institutions like MIT, UC Berkeley, and Purdue.
The plait point (labeled P) is where the two liquid phases become identical in composition, it is the terminal point of the binodal curve where tie lines shrink to zero length. At this critical composition, phase separation disappears entirely. When a fully miscible component is added to a partially miscible binary pair, for example, ethanoic acid added to water and trichloromethane, it distributes between both layers and increases their mutual solubility. As more ethanoic acid is added, the two-phase region shrinks and the system eventually crosses into the single-phase region. This principle is directly exploited in liquid-liquid extraction in US chemical plants and pharmaceutical manufacturing, where solvents are chosen to either promote or suppress phase separation. Understanding this behavior also connects to broader topics like Gibbs phase rule (F = C − P + 2), which governs the degrees of freedom in any multi-component system and is a standard topic in college thermodynamics and MCAT prep.
Related Micro-courses