Loading concepts…


8 Concepts
14 Concepts
6 Concepts
6 Concepts
9 Concepts
8 Concepts
2 Concepts
8 Concepts
8 Concepts
9 Concepts
16 Concepts
6 Concepts
 8 Concepts
 2.1K Views
 Popular topics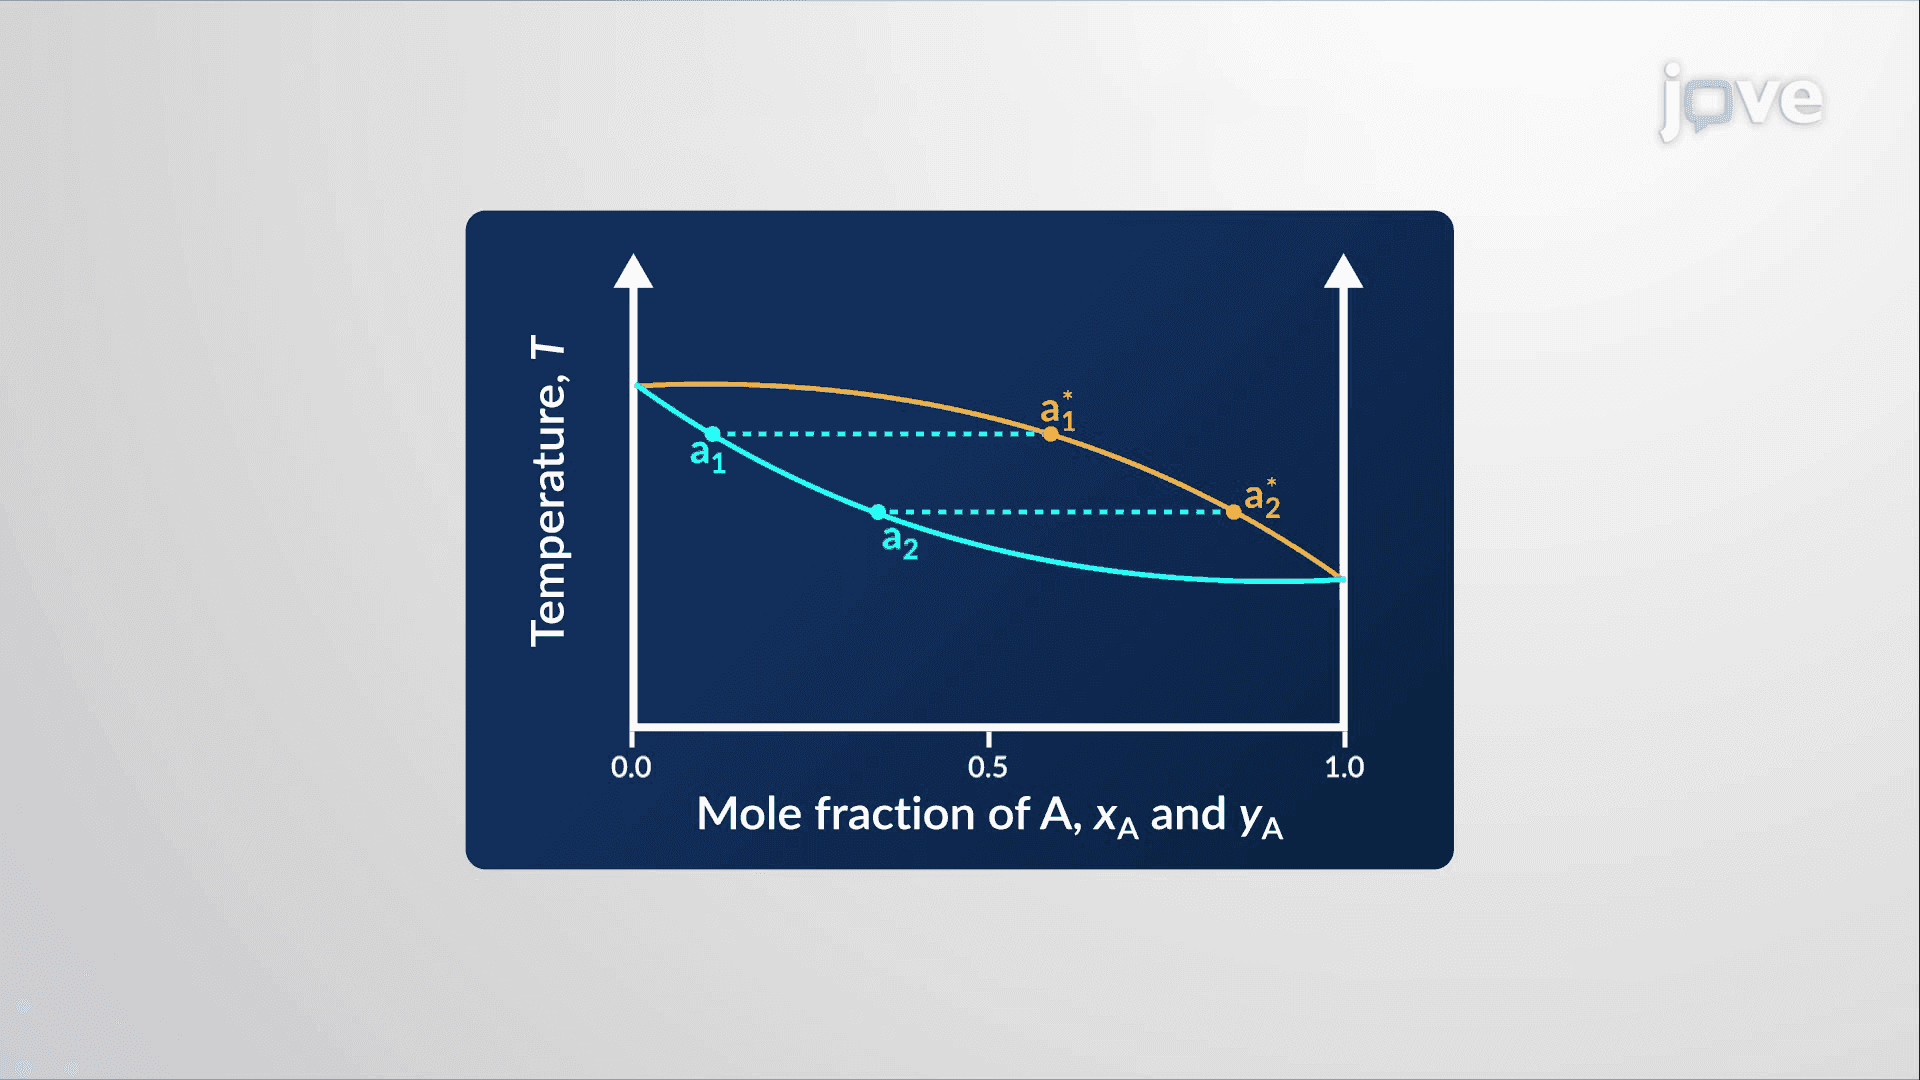
Chemical Equilibria in multiple component systems governs everything from industrial distillation towers in Texas refineries to IV fluid formulation in US hospitals. This micro-course, supported by JoVE Coach, explores how two- and three-component mixtures behave across liquid-liquid, liquid-solid, and solid-solid phases. Students examine phase diagrams, azeotropes, eutectic mixtures, colligative properties, osmotic pressure, and ternary systems using thermodynamic principles grounded in real-world chemistry.
1. Pressure-Composition and Temperature-Composition Phase Diagrams for Ideal Binary Liquid Systems
For an ideal two-component liquid solution, such as benzene and toluene, the pressure-composition phase diagram displays a bubble point line (liquid mole fraction vs. pressure) and a dew point line (vapor mole fraction vs. pressure). A horizontal tie line connects coexisting liquid and vapor compositions at any given equilibrium pressure. Temperature-composition diagrams work analogously: the liquid line marks boiling temperatures across compositions, and the vapor line tracks equilibrium vapor compositions. An isopleth, a vertical constant-composition line, shows how a system moves through phases as temperature or pressure changes. These diagrams form the foundation for understanding fractional distillation design in US petrochemical refineries.
2. Nonideal Solutions and Azeotropes
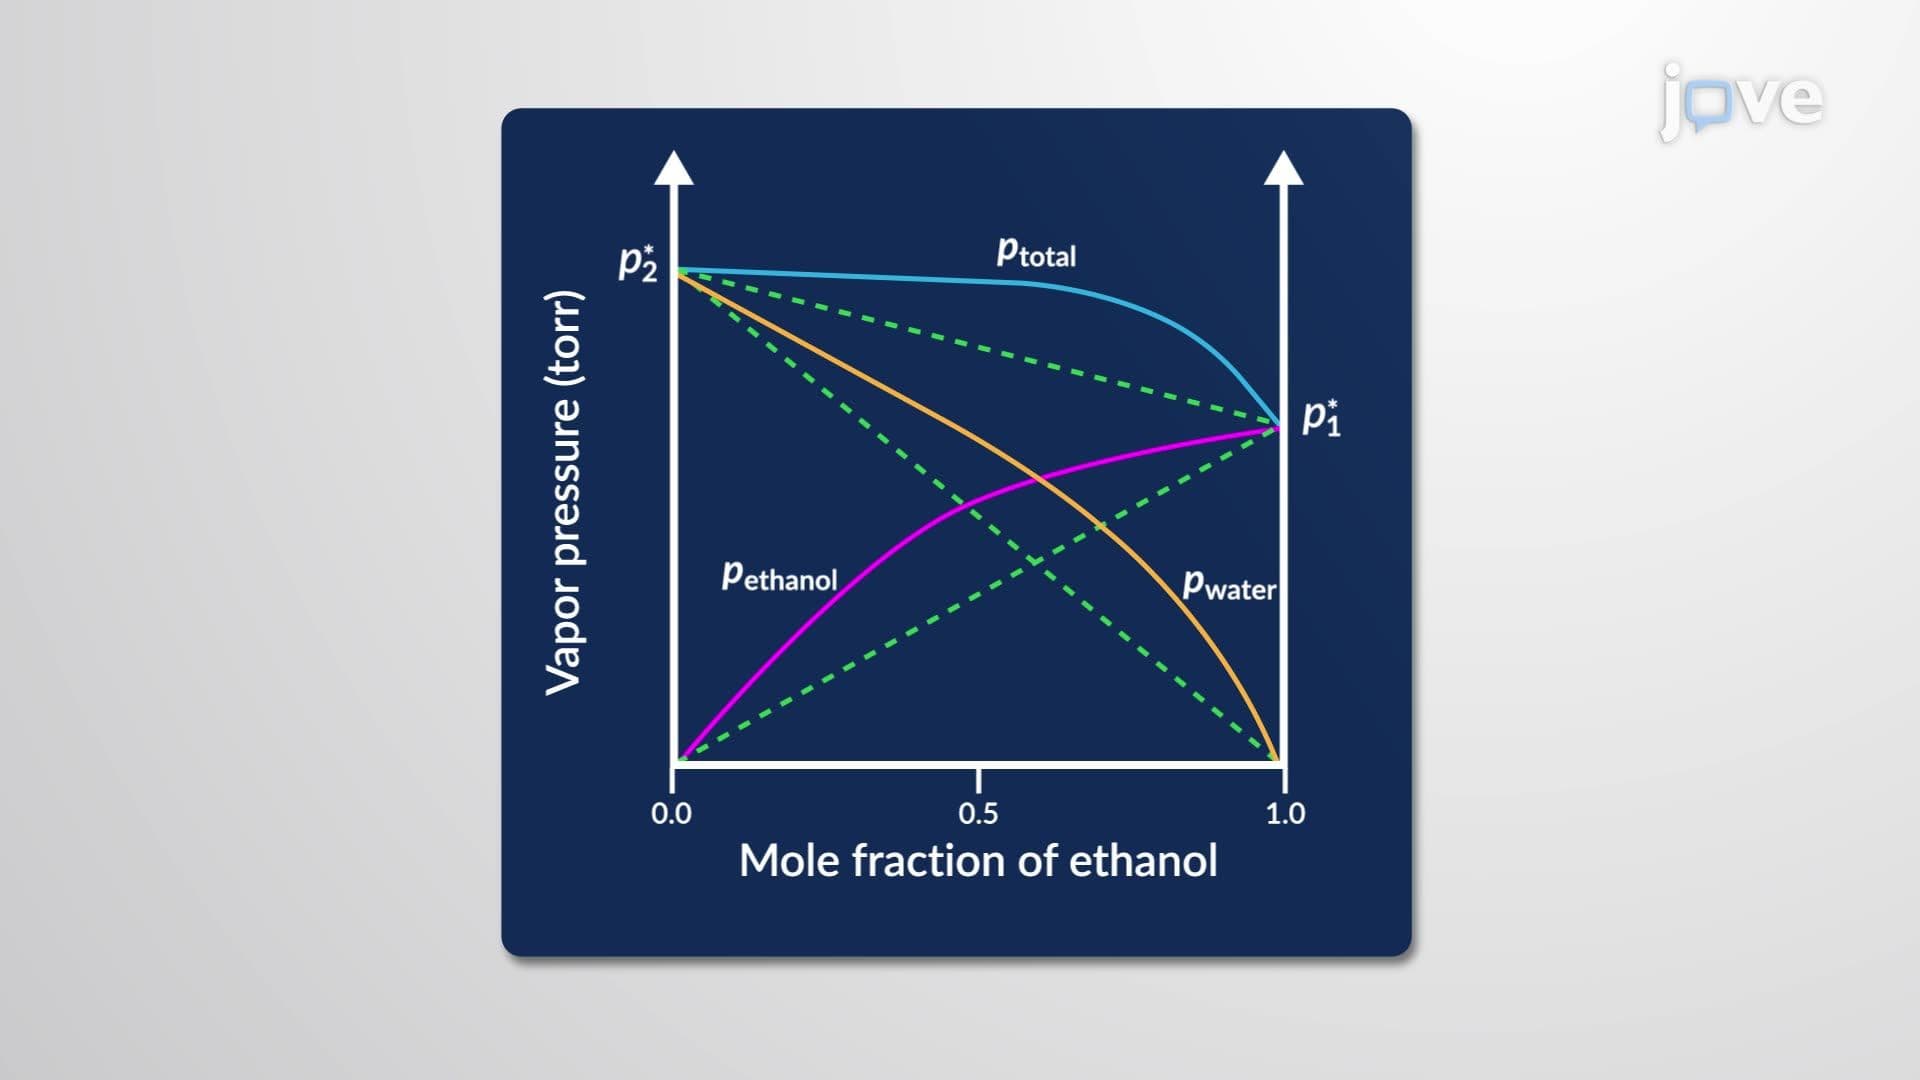
Real solutions deviate from Raoult's law when solute-solvent molecular interactions differ from solute-solute and solvent-solvent interactions. Strong solute-solvent attraction, as in acetone-chloroform mixtures, reduces vapor pressure below ideal predictions, producing a negative deviation. Weak cross-interactions, as in ethanol-water mixtures, raise vapor pressure above ideal predictions, producing a positive deviation. On a temperature-composition diagram, these deviations create an azeotrope: a specific composition where bubble and dew point lines intersect. At this point, liquid and vapor phases share identical compositions, so standard distillation cannot separate them further. Positive-deviation systems form minimum-boiling azeotropes; negative-deviation systems form maximum-boiling azeotropes. The ethanol-water azeotrope (95.6% ethanol) is a classic US industrial example encountered in fuel-grade ethanol production.
3. Liquid-Solid Solutions and Solubility
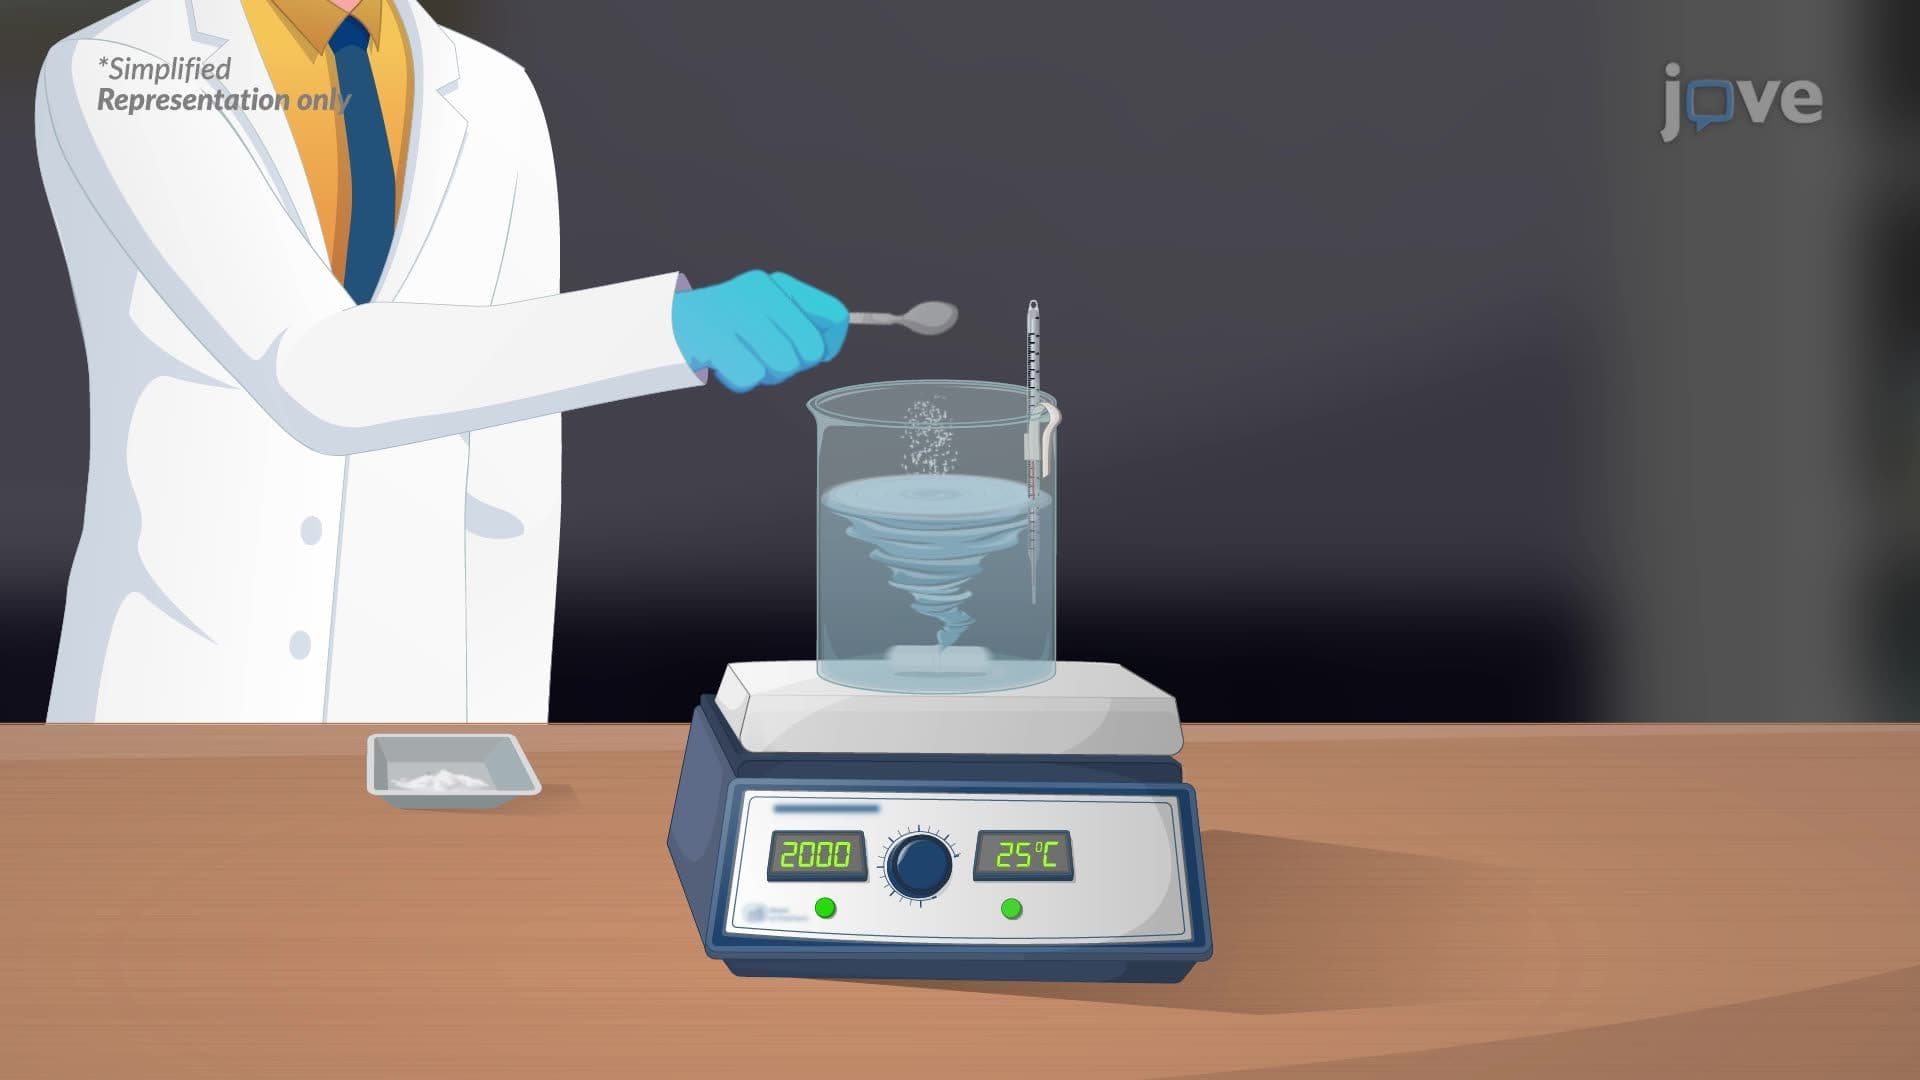
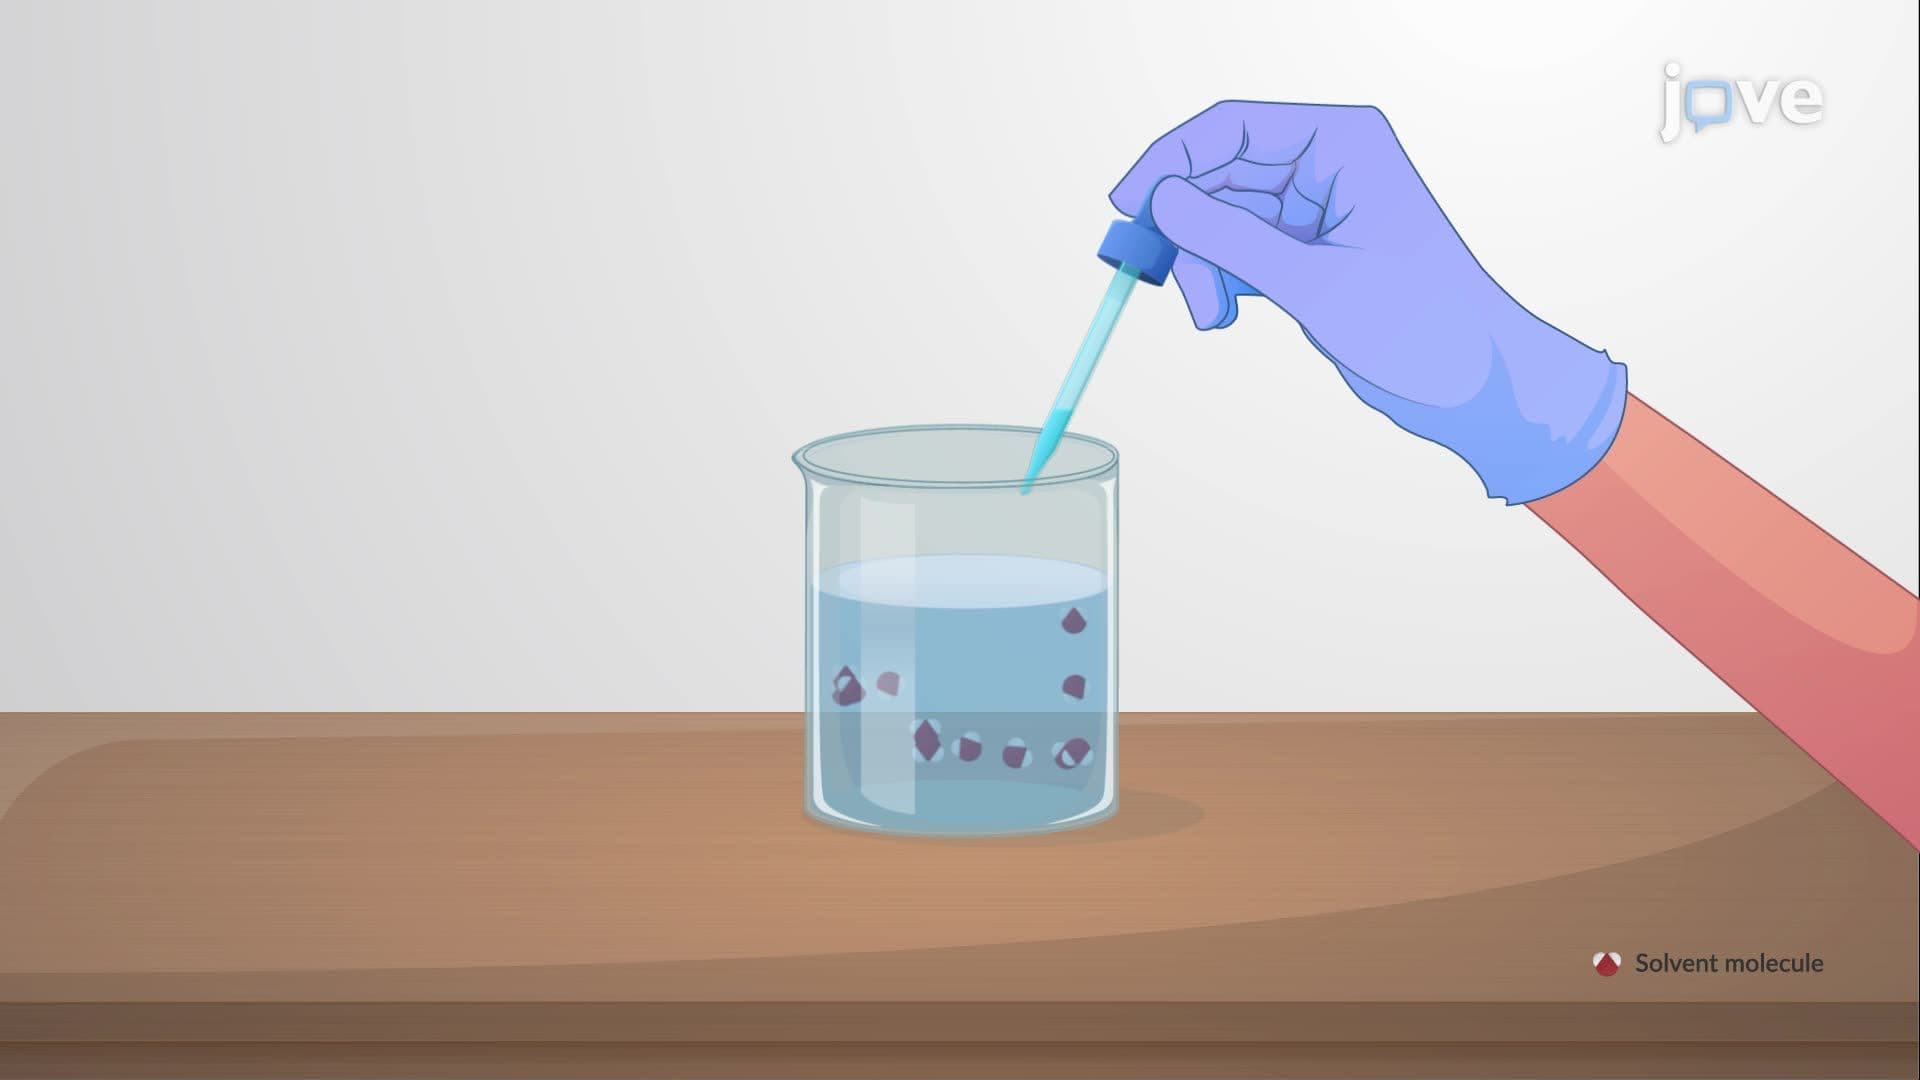
When a solid dissolves in a liquid, dissolution continues until the solution reaches its solubility limit, at which point the solution is saturated and the chemical potential of dissolved and undissolved solute are equal. For an ideal liquid-solid solution, solubility can be expressed mathematically using the solute's mole fraction, which depends on the Gibbs energy of fusion, enthalpy of fusion, entropy of fusion, and the solute's melting point. This framework reveals a key principle: solutes with higher melting points tend to be less soluble at a given temperature. This thermodynamic approach explains, for example, why aspirin (a high-melting-point compound) has limited solubility in water at room temperature, a consideration critical to US pharmaceutical formulation.
4. Solid-Solid Solutions and Eutectic Systems
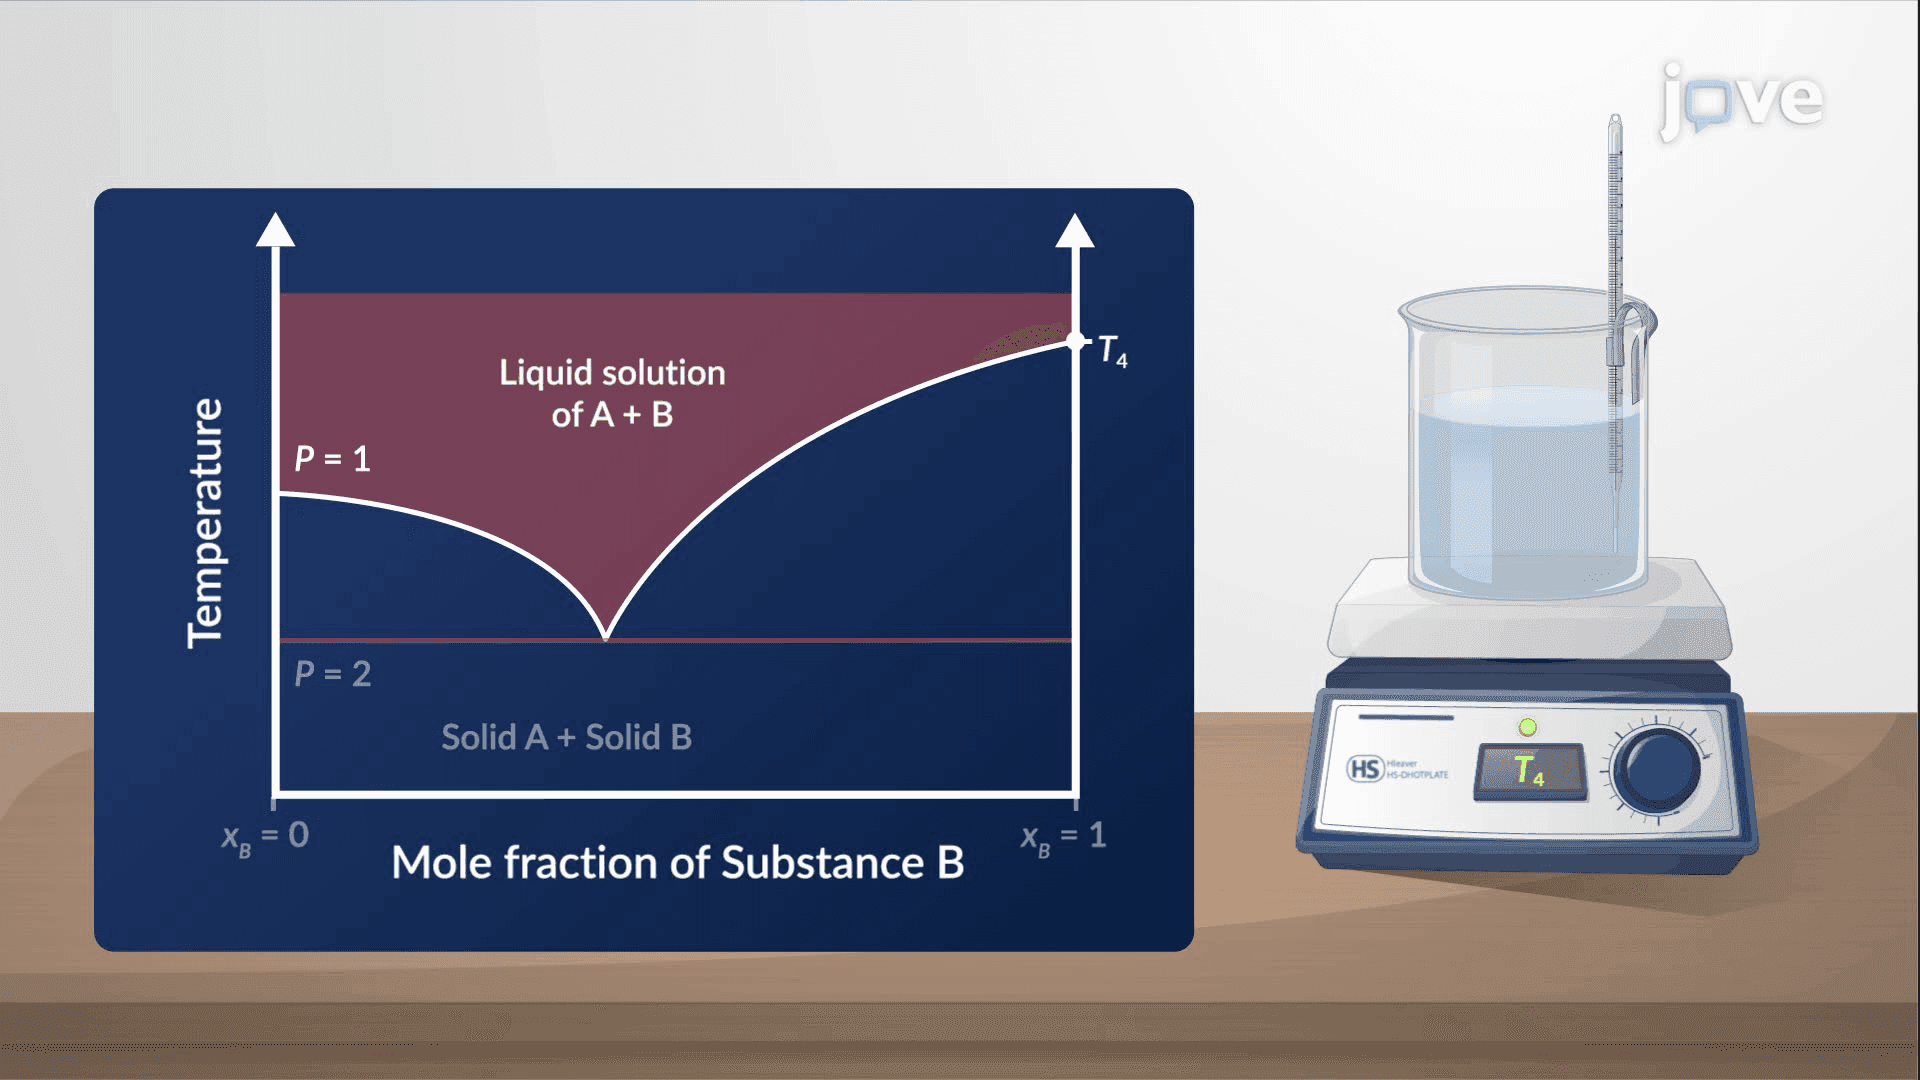
When two mutually insoluble solids, such as bismuth and cadmium, studied historically in US metallurgy, form completely miscible liquids, their temperature-composition phase diagram reveals a characteristic eutectic point. Cooling a liquid mixture causes one pure solid component to crystallize first, enriching the remaining liquid in the other component. This continues until the liquid reaches the eutectic composition, the mixture with the absolute lowest melting point. At this composition, the system freezes at a single, constant temperature, a phenomenon called the eutectic halt, producing a two-phase solid of pure A and pure B. Eutectic behavior is critical in solder alloy design and in understanding igneous rock solidification studied in US geology and materials engineering programs.
5. Colligative Properties and Vapor Pressure Lowering
Colligative properties depend solely on the number of dissolved solute particles, not their chemical identity. When a nonvolatile solute is added to a pure solvent, it reduces the solvent's mole fraction and therefore lowers the solvent's chemical potential. This reduction directly decreases the solution's equilibrium vapor pressure relative to the pure solvent, a relationship described by Raoult's law for dilute ideal solutions. The change in vapor pressure equals the product of the solute's mole fraction and the pure solvent's vapor pressure. This principle is applied in US industries ranging from antifreeze formulation (ethylene glycol in coolants) to food preservation, where dissolved sugars and salts lower the water activity of products.
6. Freezing Point Depression and Boiling Point Elevation
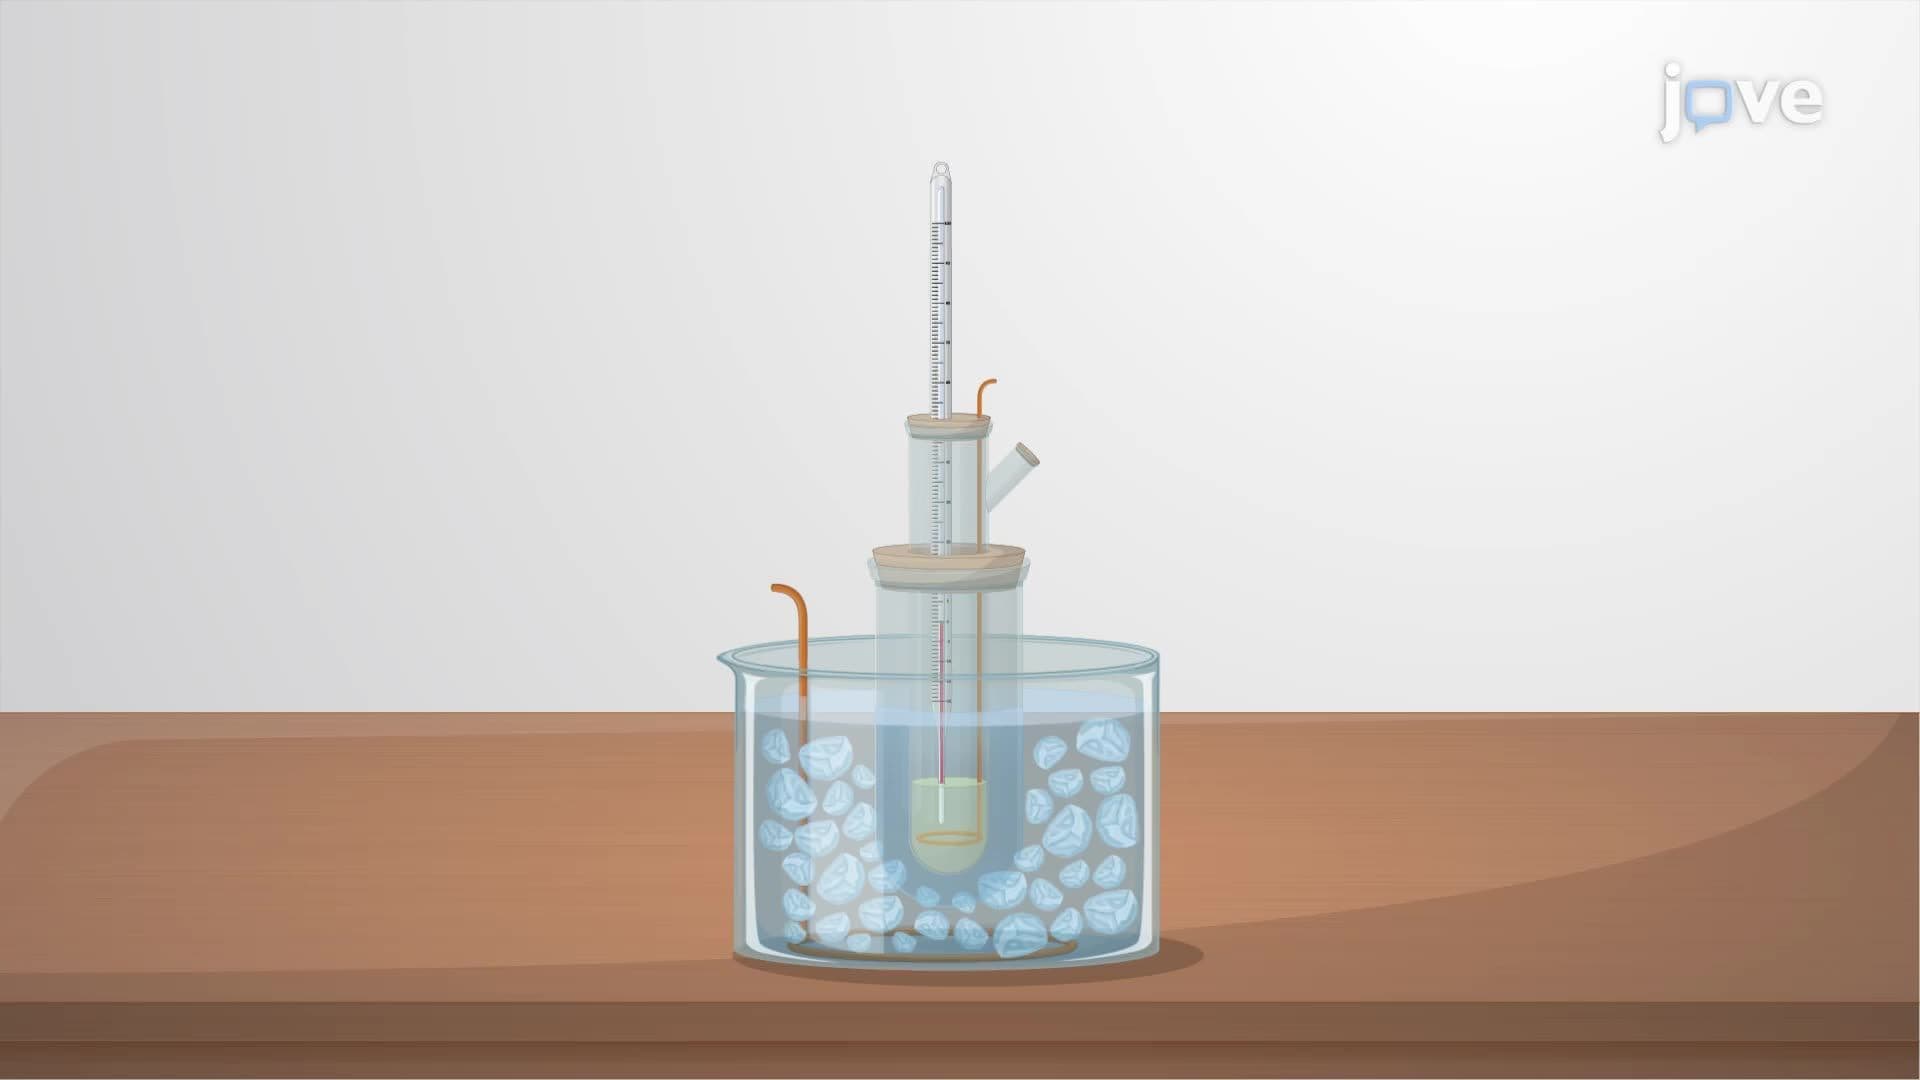
Adding a nonvolatile solute to a solvent shifts the chemical potential of the liquid phase downward without affecting the solid or vapor phases. On a chemical potential versus temperature plot, this shift moves the liquid-solid intersection to a lower temperature (freezing point depression) and the liquid-vapor intersection to a higher temperature (boiling point elevation). Quantitatively, freezing point depression equals the product of the solute's molality and the solvent's cryoscopic constant (Kf); boiling point elevation equals molality times the ebullioscopic constant (Kb). These effects explain why road salt lowers the freezing point of water on US highways in winter, and why dissolved solutes raise pasta-water's boiling point, though the latter effect is negligible at culinary concentrations.
7. Osmotic Pressure
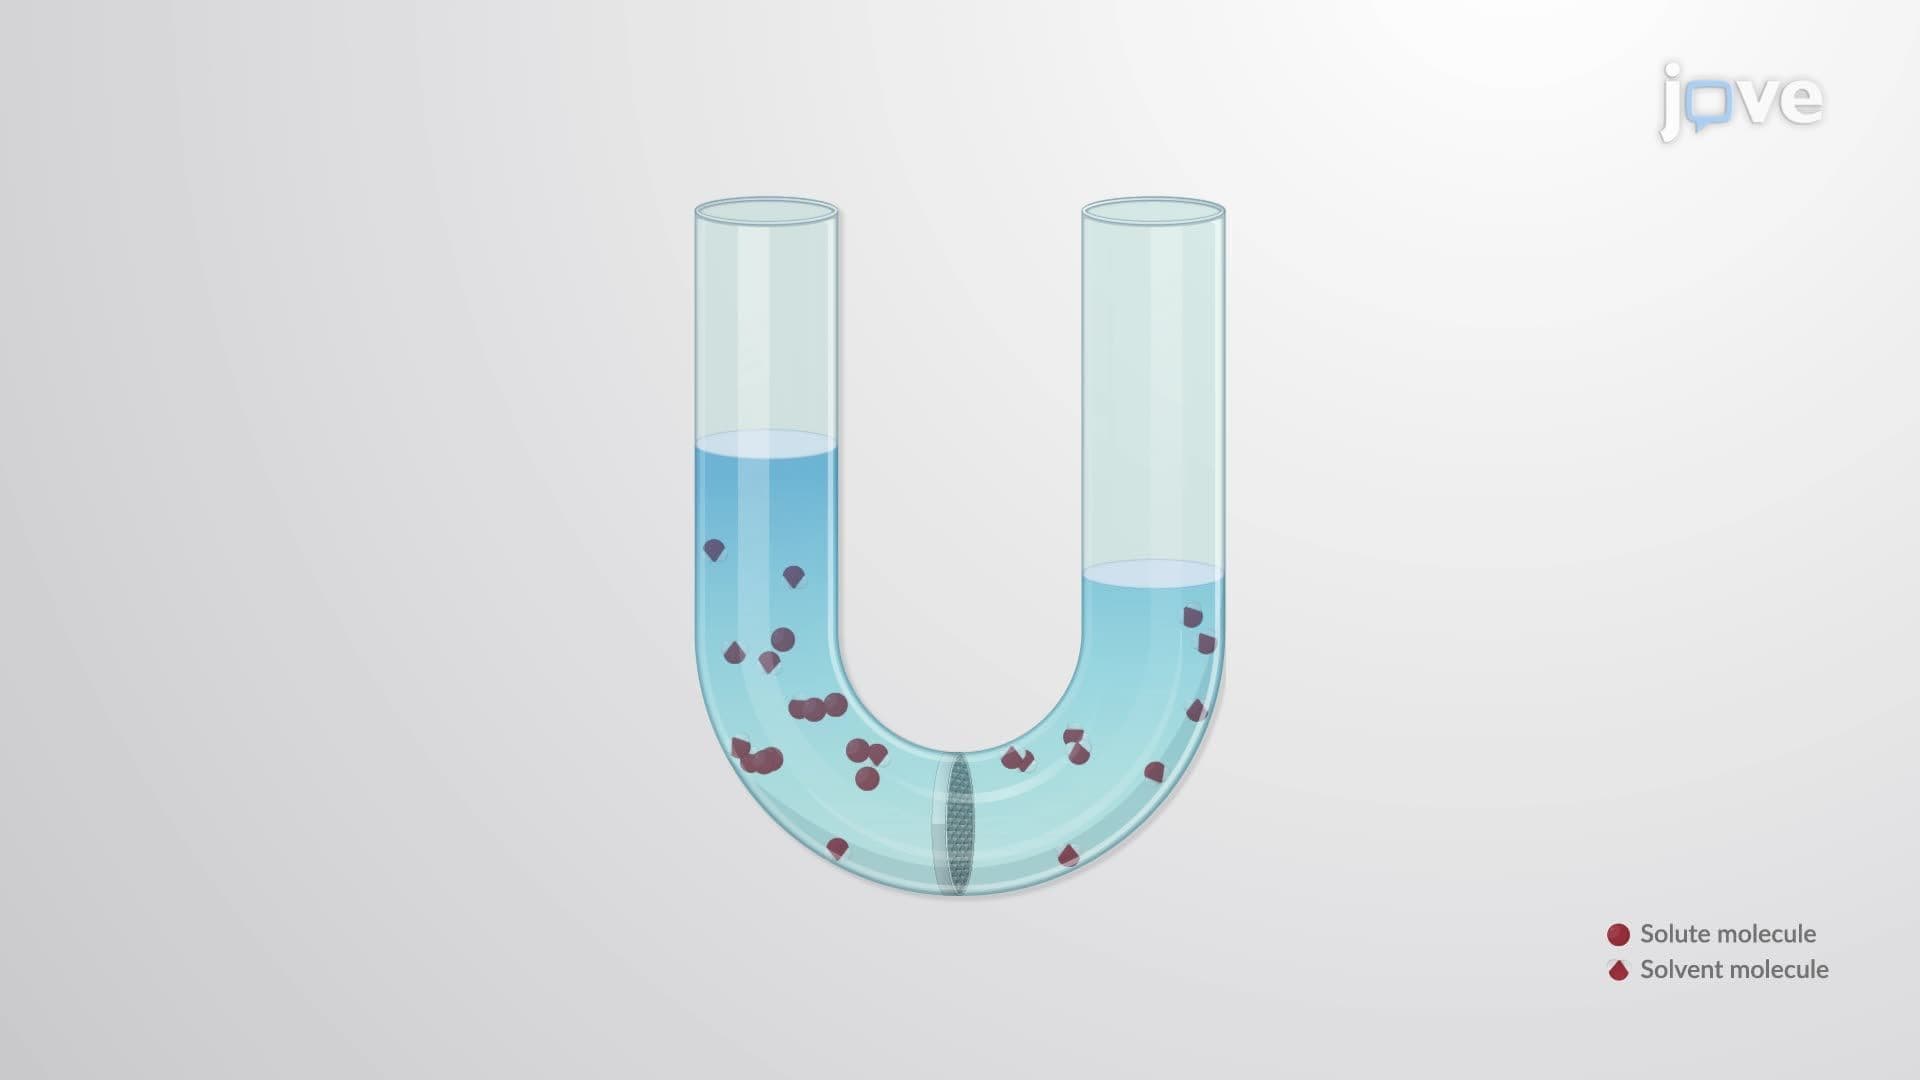
Osmosis is the net movement of solvent molecules through a semipermeable membrane from a region of lower solute concentration to higher solute concentration. The pressure required to stop this flow is the osmotic pressure (π), calculated for ideal dilute solutions using the van't Hoff equation: π = MRT, where M is molar concentration, R is the gas constant, and T is absolute temperature. For nonideal solutions of macromolecules, such as proteins or synthetic polymers studied in US biomedical research, an expanded van't Hoff equation incorporating the osmotic virial coefficient (B) corrects for excluded volume and intermolecular interactions. Plotting π/c_mass vs. c_mass allows researchers to determine polymer molar mass from the y-intercept and the virial coefficient from the slope, a technique used in US polymer laboratories for quality control.
8. Phase Diagrams of Ternary Systems
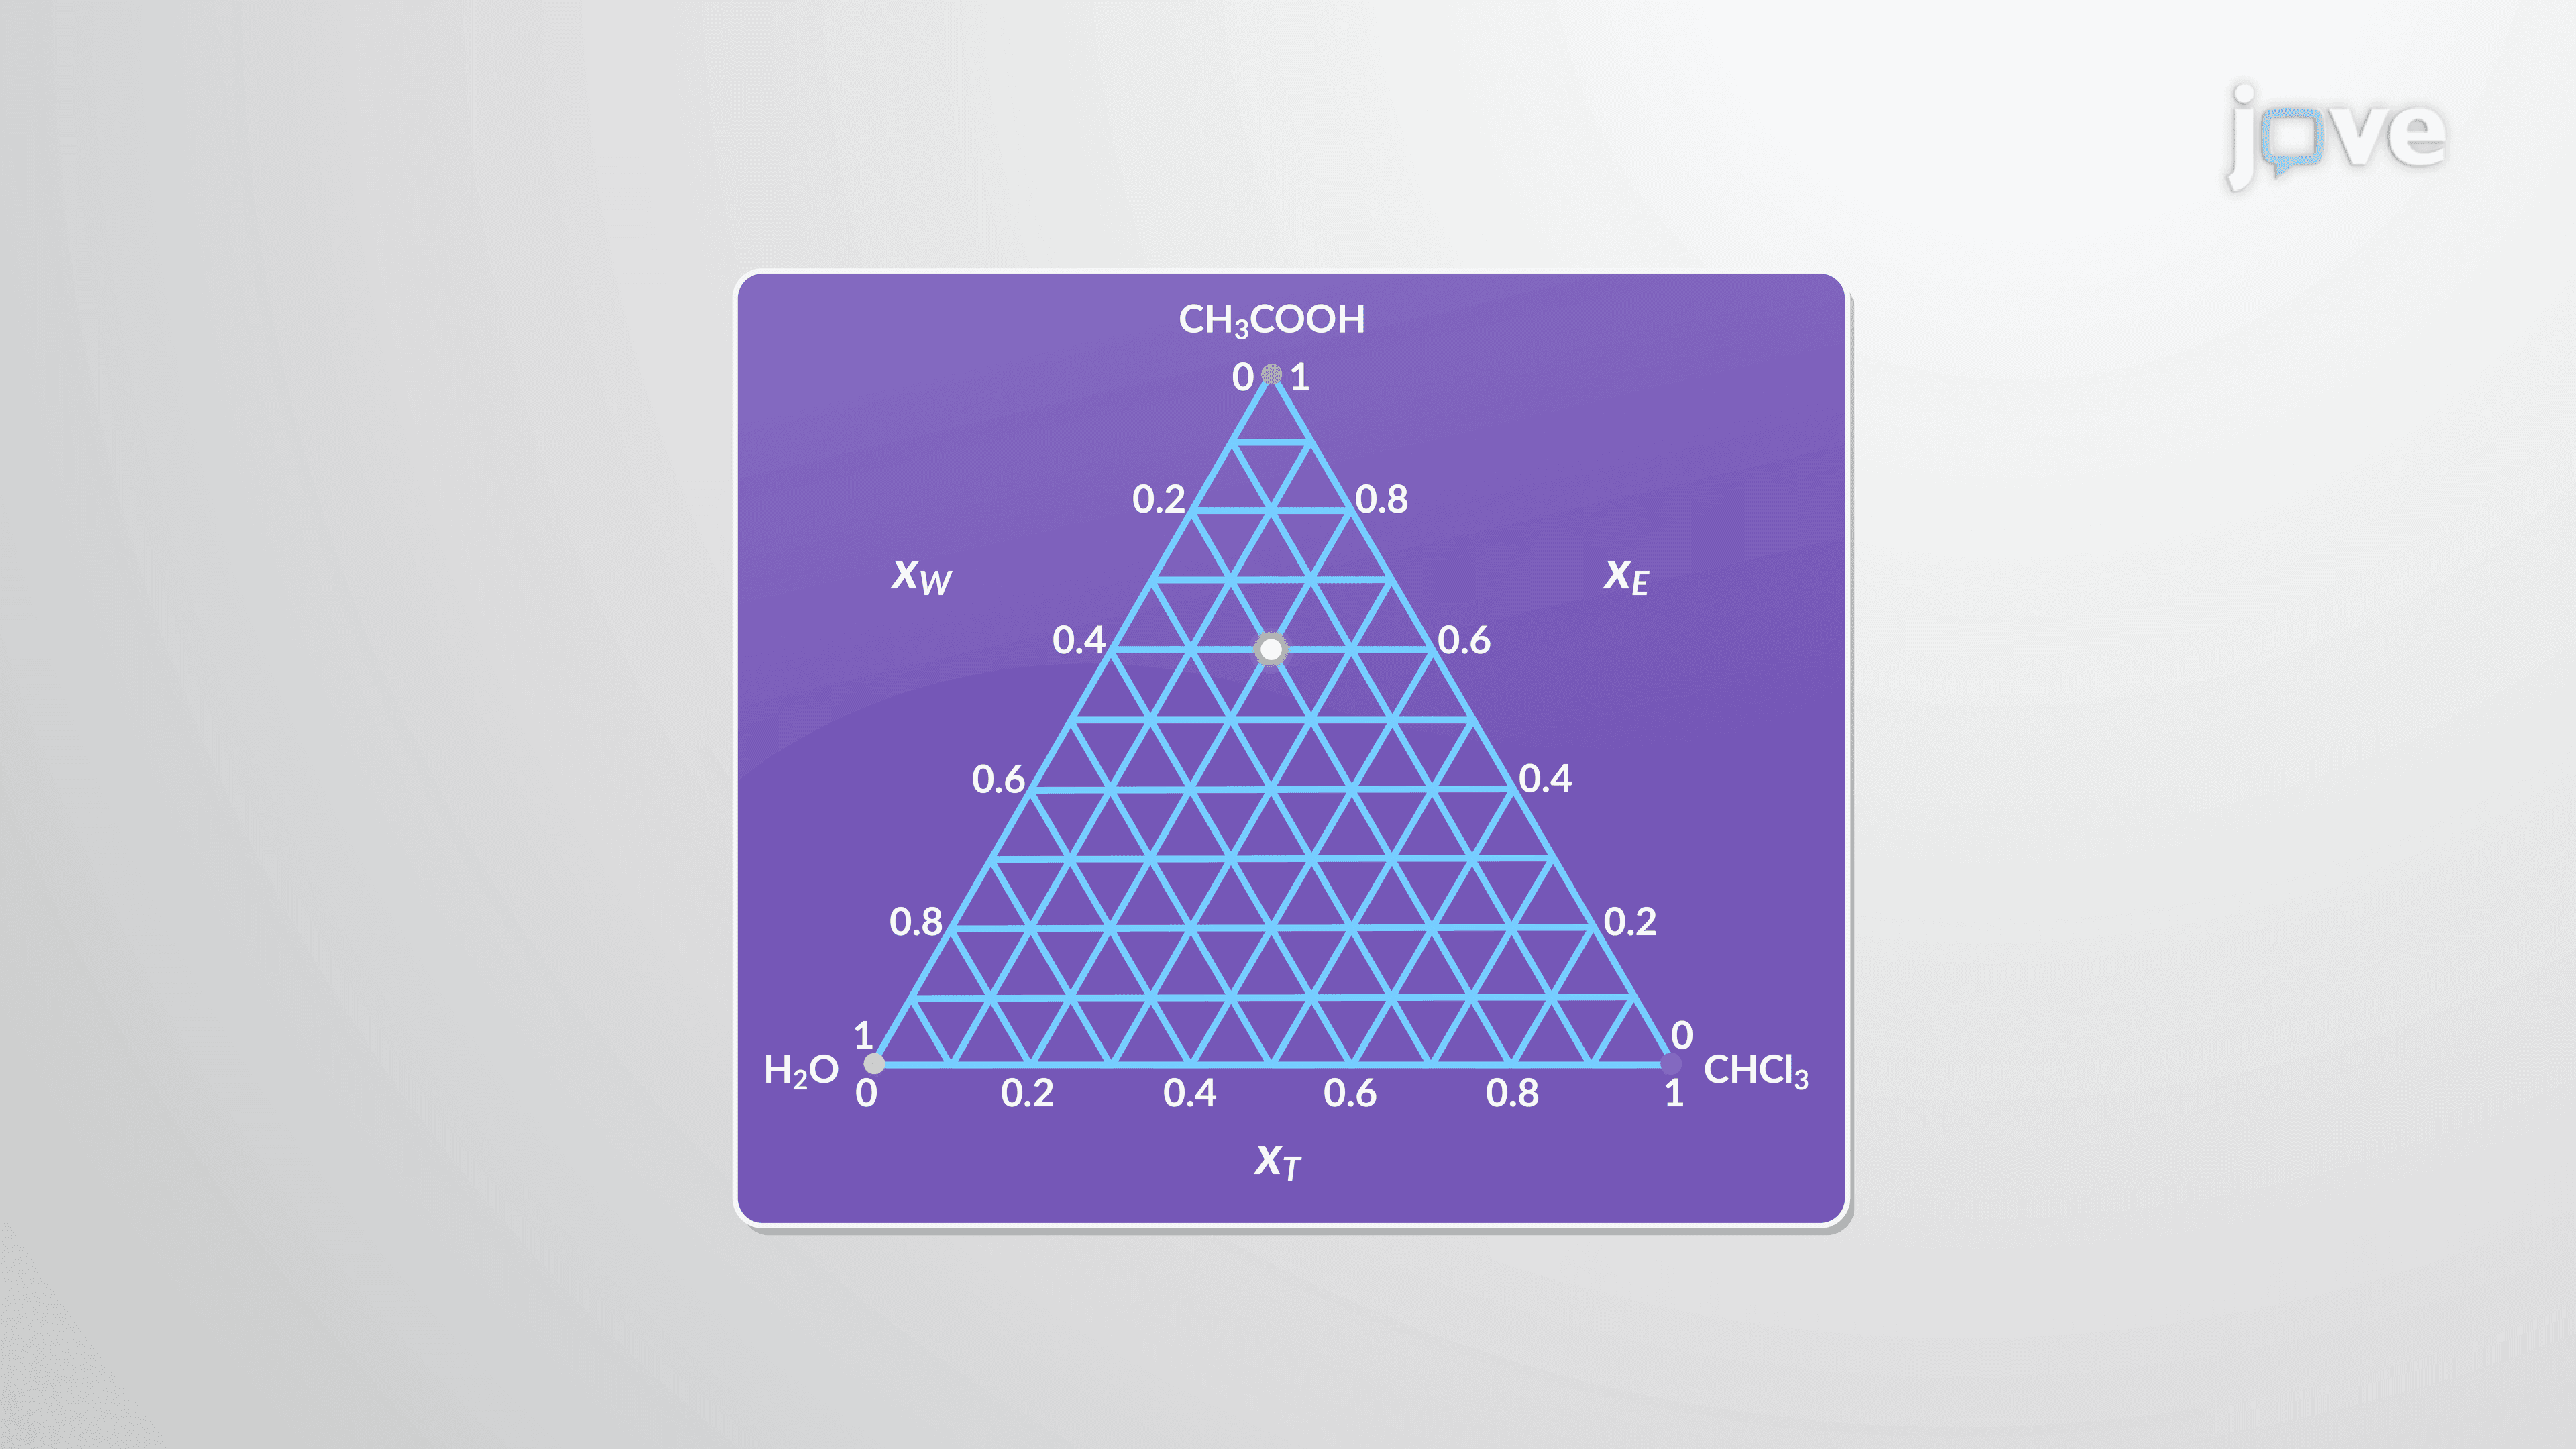
A ternary phase diagram represents three-component systems on an equilateral triangle, where each vertex is a pure component, each edge is a binary mixture, and interior points represent all three components present simultaneously. The binodal curve encloses the two-phase region. A classic example is the water-trichloromethane-ethanoic acid system: water and trichloromethane are only partially miscible, but ethanoic acid (acetic acid) is fully miscible with both. Adding acetic acid increases mutual solubility of water and trichloromethane, shrinking the two-phase region. The plait point marks where the two liquid phases become compositionally identical and merge into one. Ternary diagrams guide liquid-liquid extraction processes used in US pharmaceutical and chemical manufacturing to optimize solvent selection.