Loading subject page…


8 Concepts
14 Concepts
6 Concepts
6 Concepts
9 Concepts
8 Concepts
2 Concepts
8 Concepts
8 Concepts
9 Concepts
16 Concepts
6 Concepts
 9 Concepts
 2K Views
 Popular topics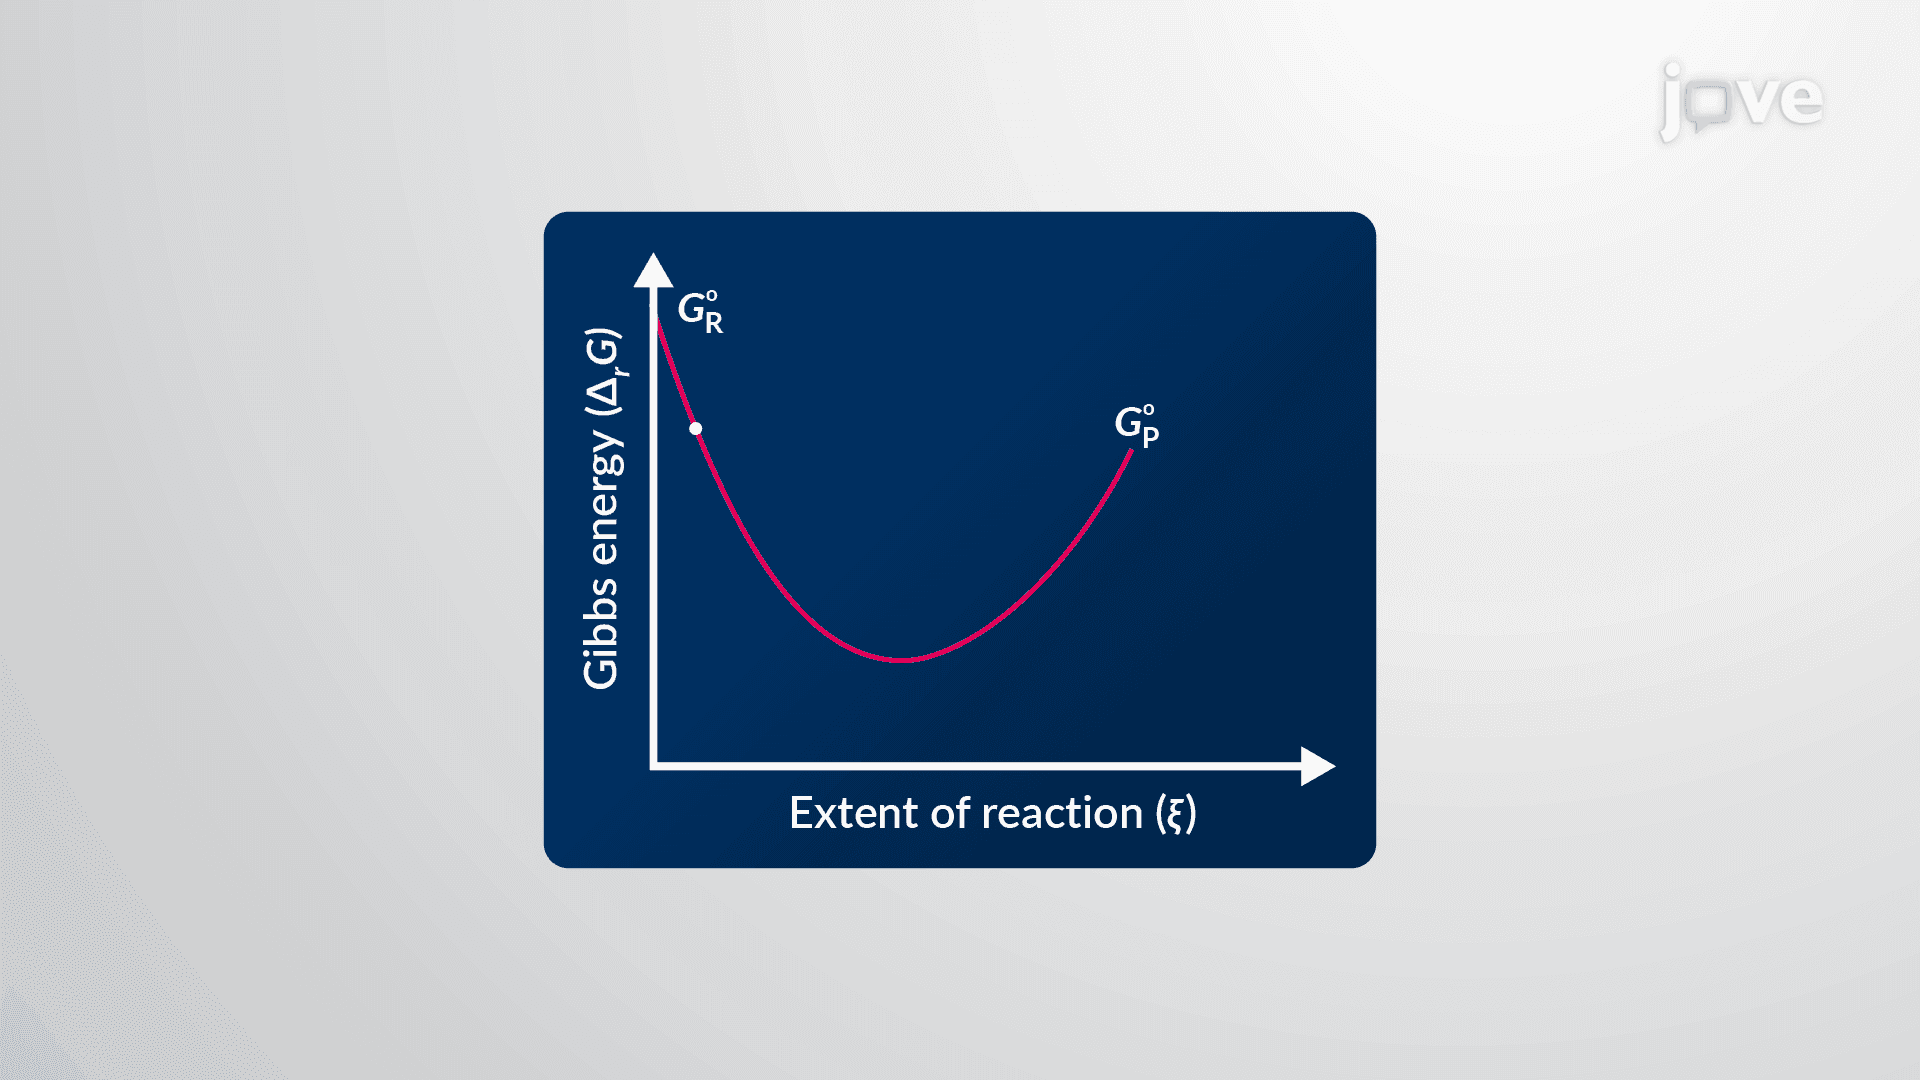
Single component systems sit at the heart of physical chemistry, connecting thermodynamic principles to real-world phase behavior. This micro-course explores chemical equilibrium basics, Gibbs energy, Le Chatelier's principle, phase transitions, and phase diagrams for single components-covering the Clausius-Clapeyron equation and the phase rule. JoVE Coach guides students from reaction spontaneity through interpreting water's phase diagram with precision and clarity.
1. Thermodynamic Background and Reaction Gibbs Energy The Gibbs energy (G) of a reaction system changes as the reaction progresses. Plotting Gibbs energy against the extent of reaction produces a curve whose slope defines the reaction Gibbs energy (ΔᵣG). This value reflects the difference in chemical potential between products and reactants. When ΔᵣG < 0, the forward reaction is spontaneous (exergonic); when ΔᵣG > 0, the reverse reaction is favored (endergonic); when ΔᵣG = 0, the system is at equilibrium. A classic US classroom example is cellular respiration, where glucose oxidation releases energy (exergonic) to power biological processes.
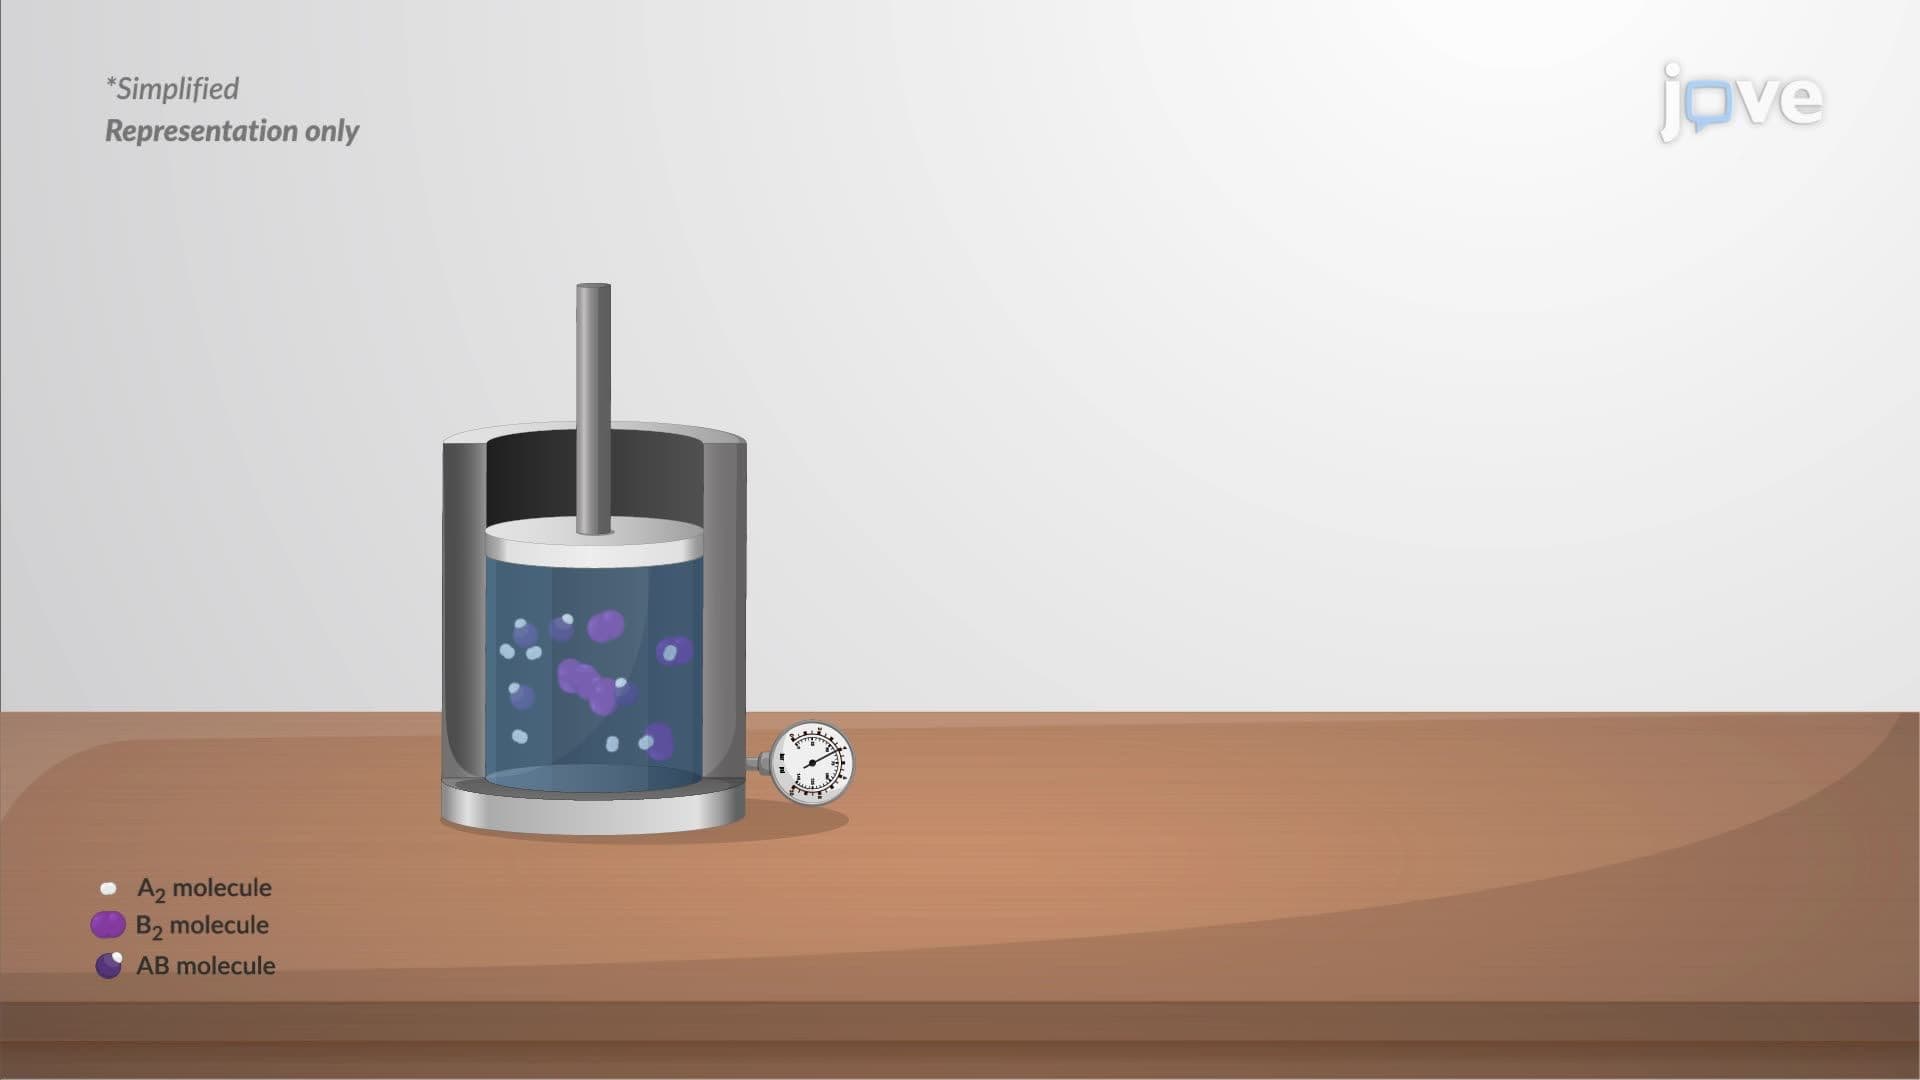
2. Equilibrium Constant, Reaction Quotient, and Standard Gibbs Energy The equilibrium constant K is the ratio of product concentrations to reactant concentrations, each raised to their stoichiometric coefficients, measured at equilibrium. The reaction quotient Q has the same mathematical form but applies at any point during the reaction. The key relationship linking these quantities is ΔᵣG = ΔᵣG° + RT ln Q. At equilibrium, ΔᵣG = 0 and Q = K, yielding ΔᵣG° = −RT ln K. When K ≫ 1, products are favored; when K ≪ 1, reactants dominate. This framework is fundamental to AP Chemistry and MCAT problem-solving.
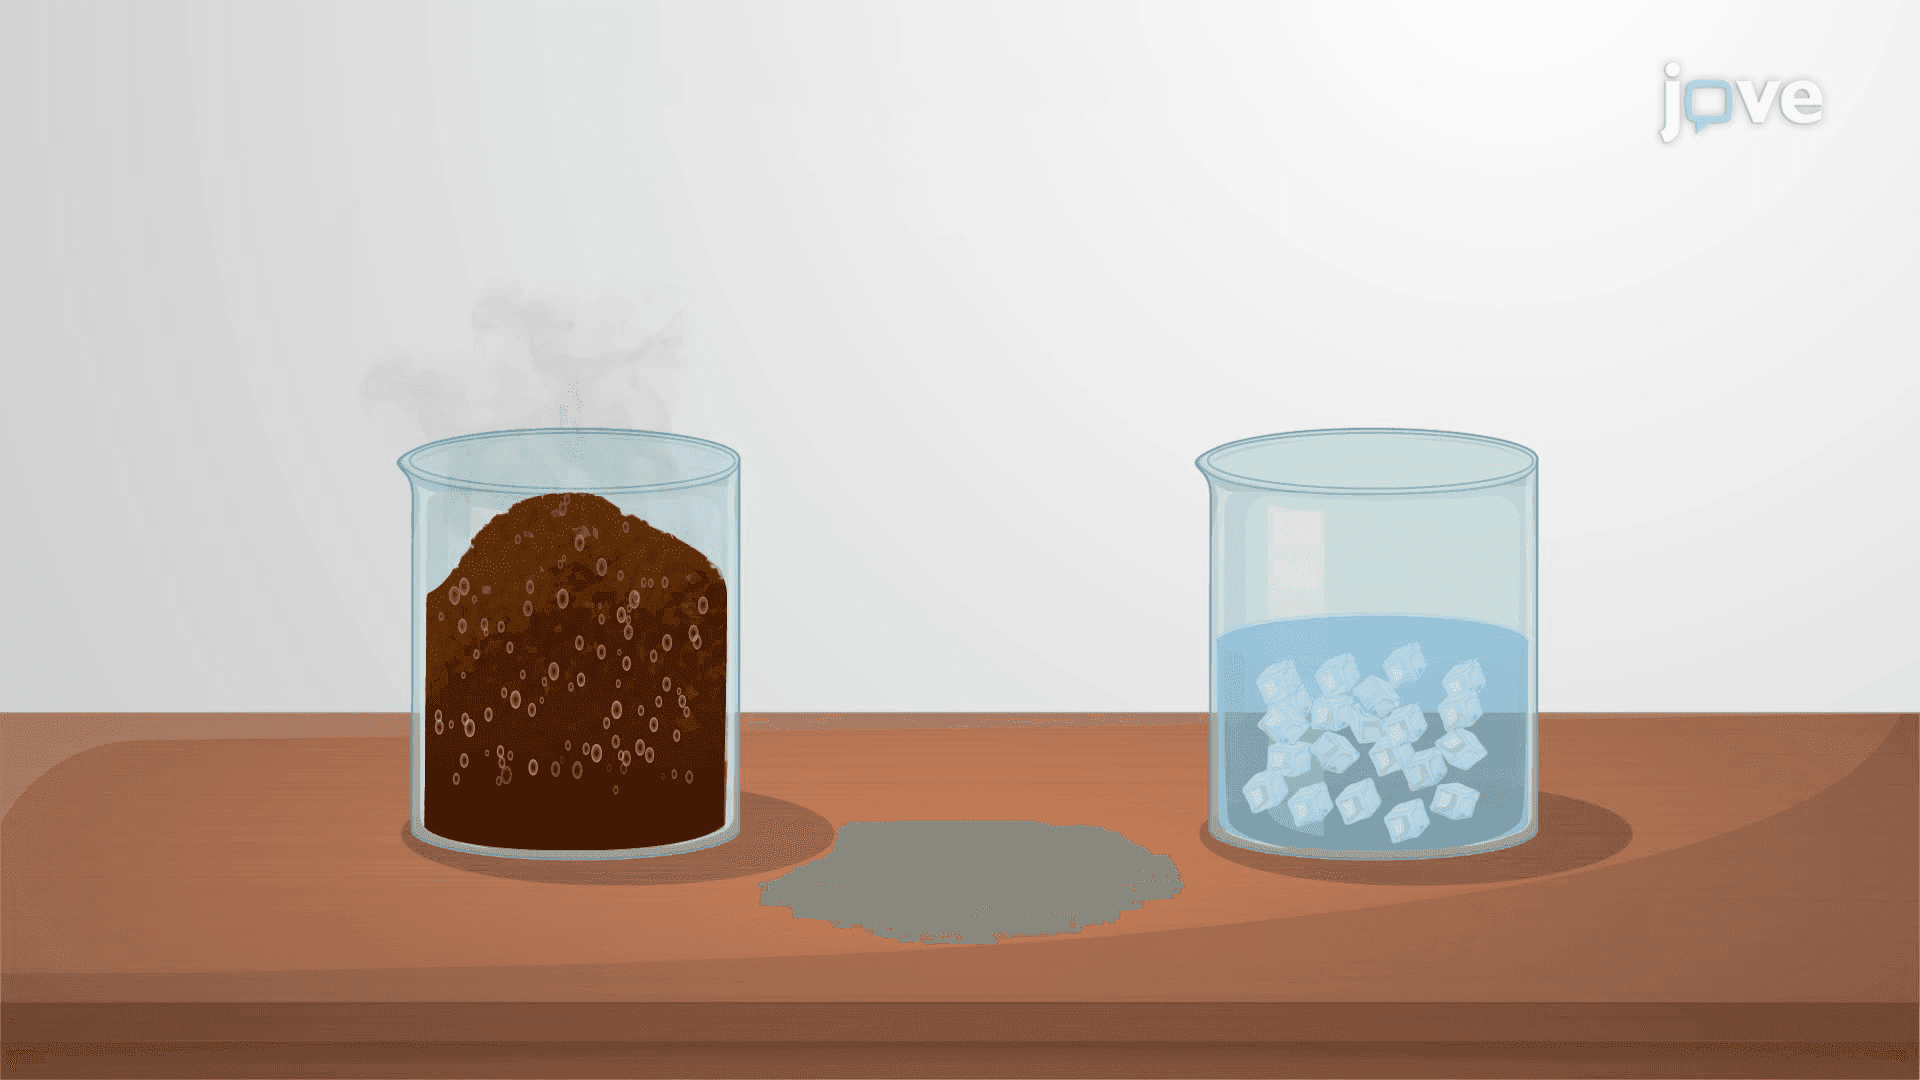
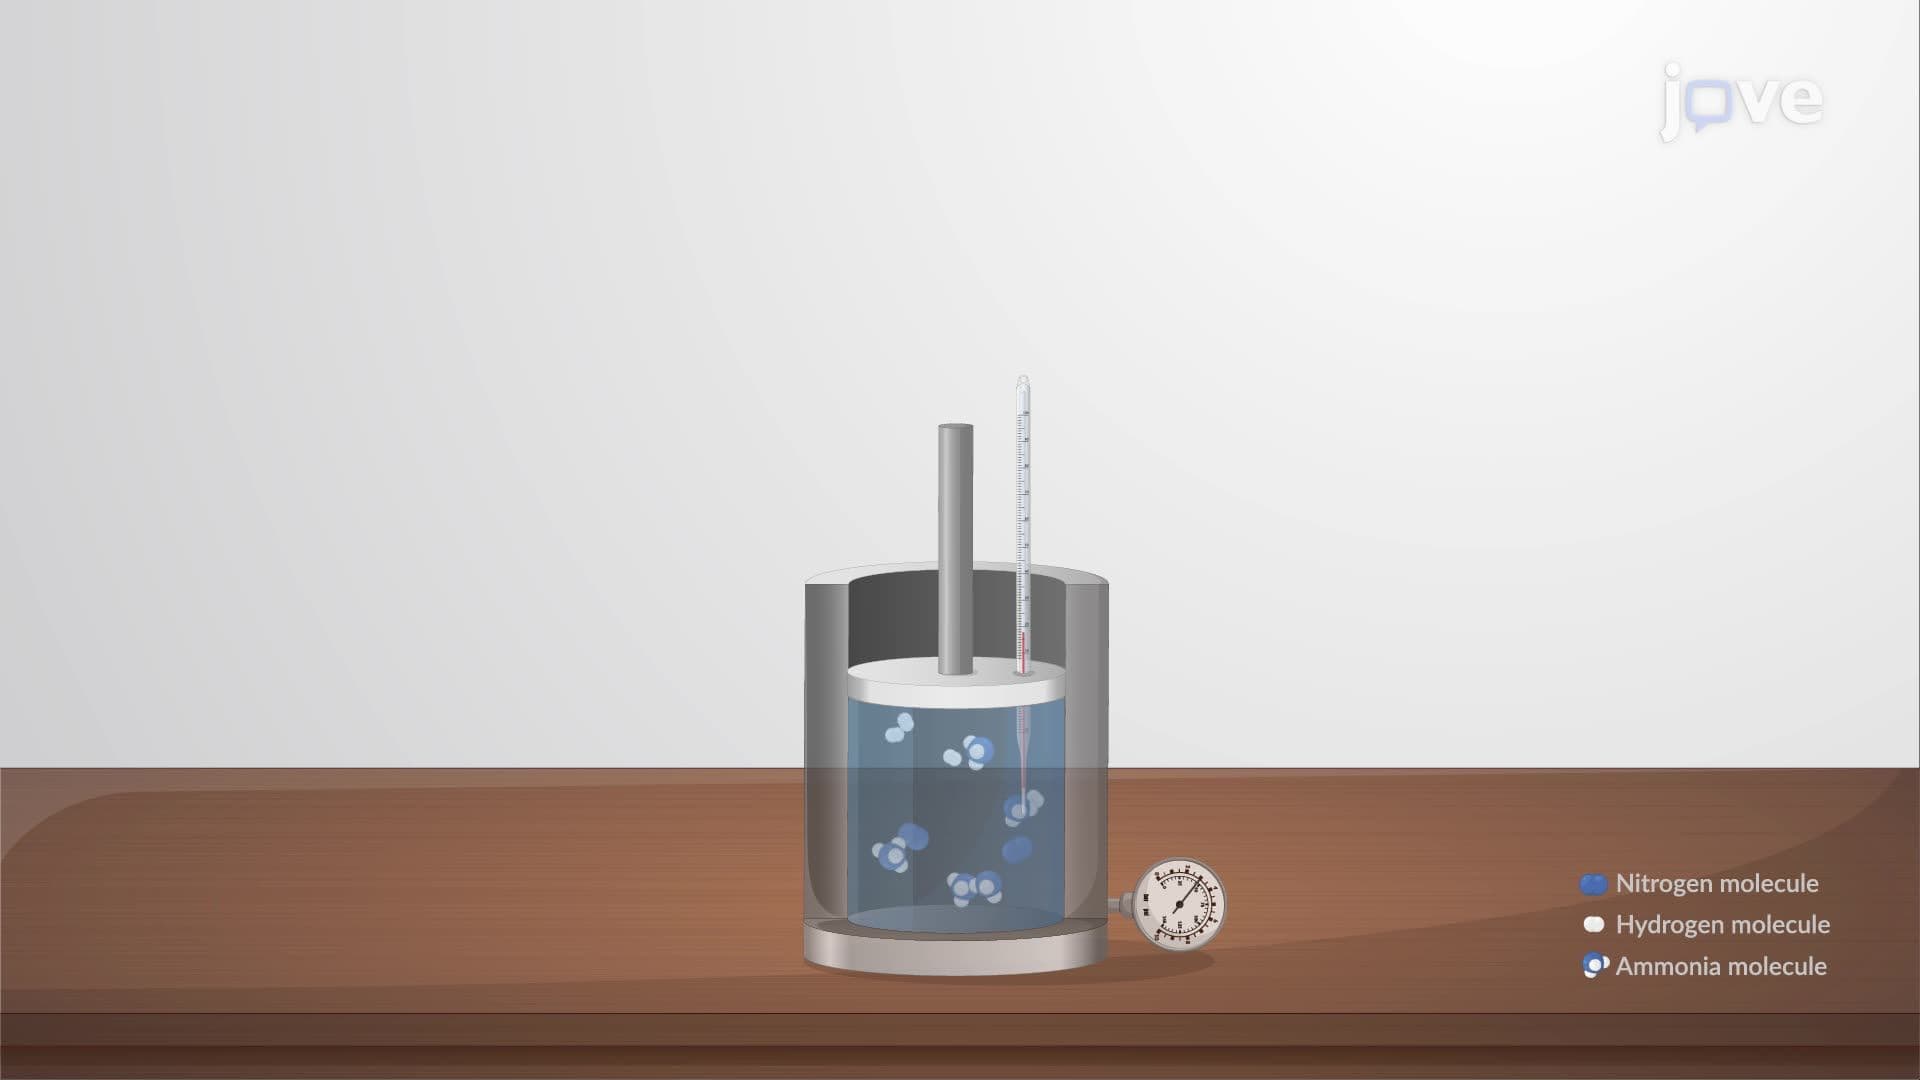
3. Response of Equilibria to Changing Conditions Le Chatelier's principle states that a system at equilibrium shifts to counteract imposed changes. Increasing temperature favors the endothermic direction; decreasing temperature favors the exothermic direction. The van't Hoff equation quantifies how K changes with temperature based on the standard reaction enthalpy (ΔᵣH°). In gas-phase reactions, increasing pressure shifts equilibrium toward the side with fewer moles of gas. Catalysts speed up both forward and reverse reactions equally, leaving K unchanged. These principles are routinely tested on AP Chemistry exams and appear in MCAT biochemistry contexts.
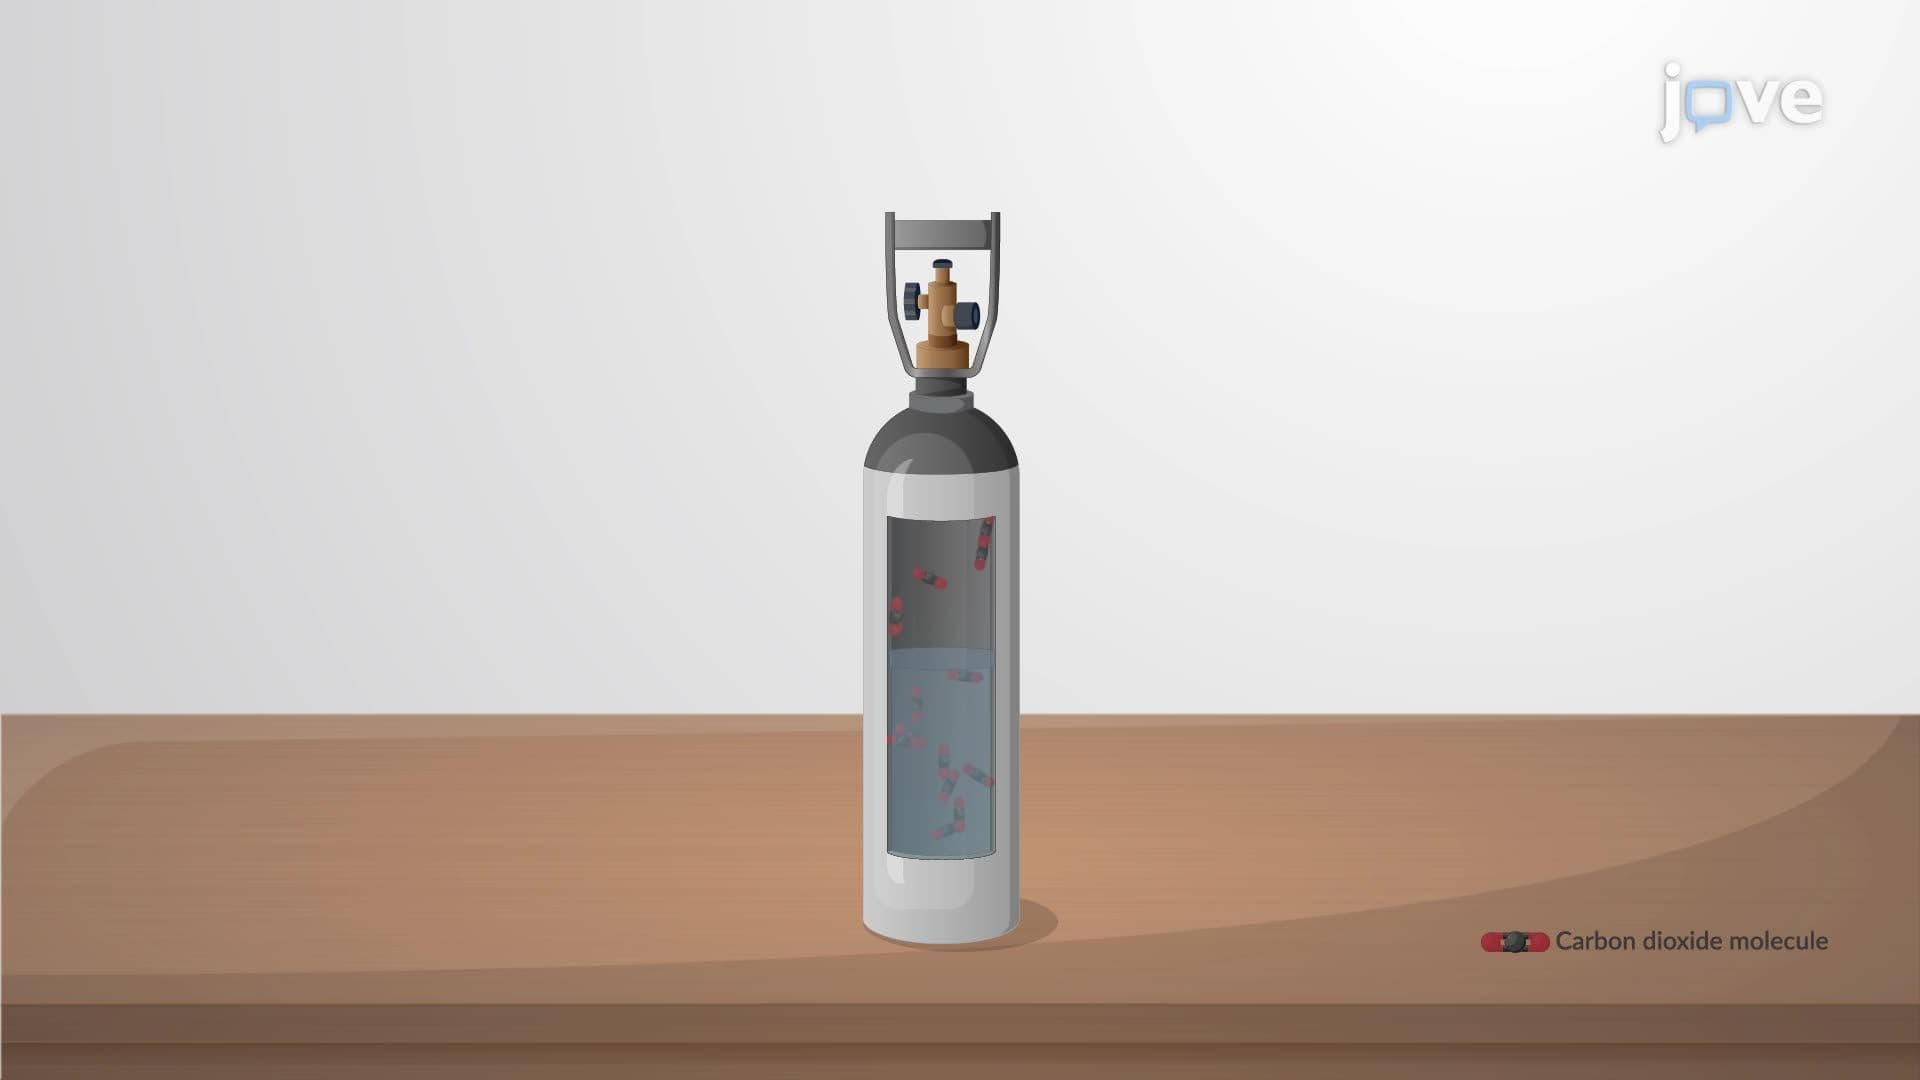
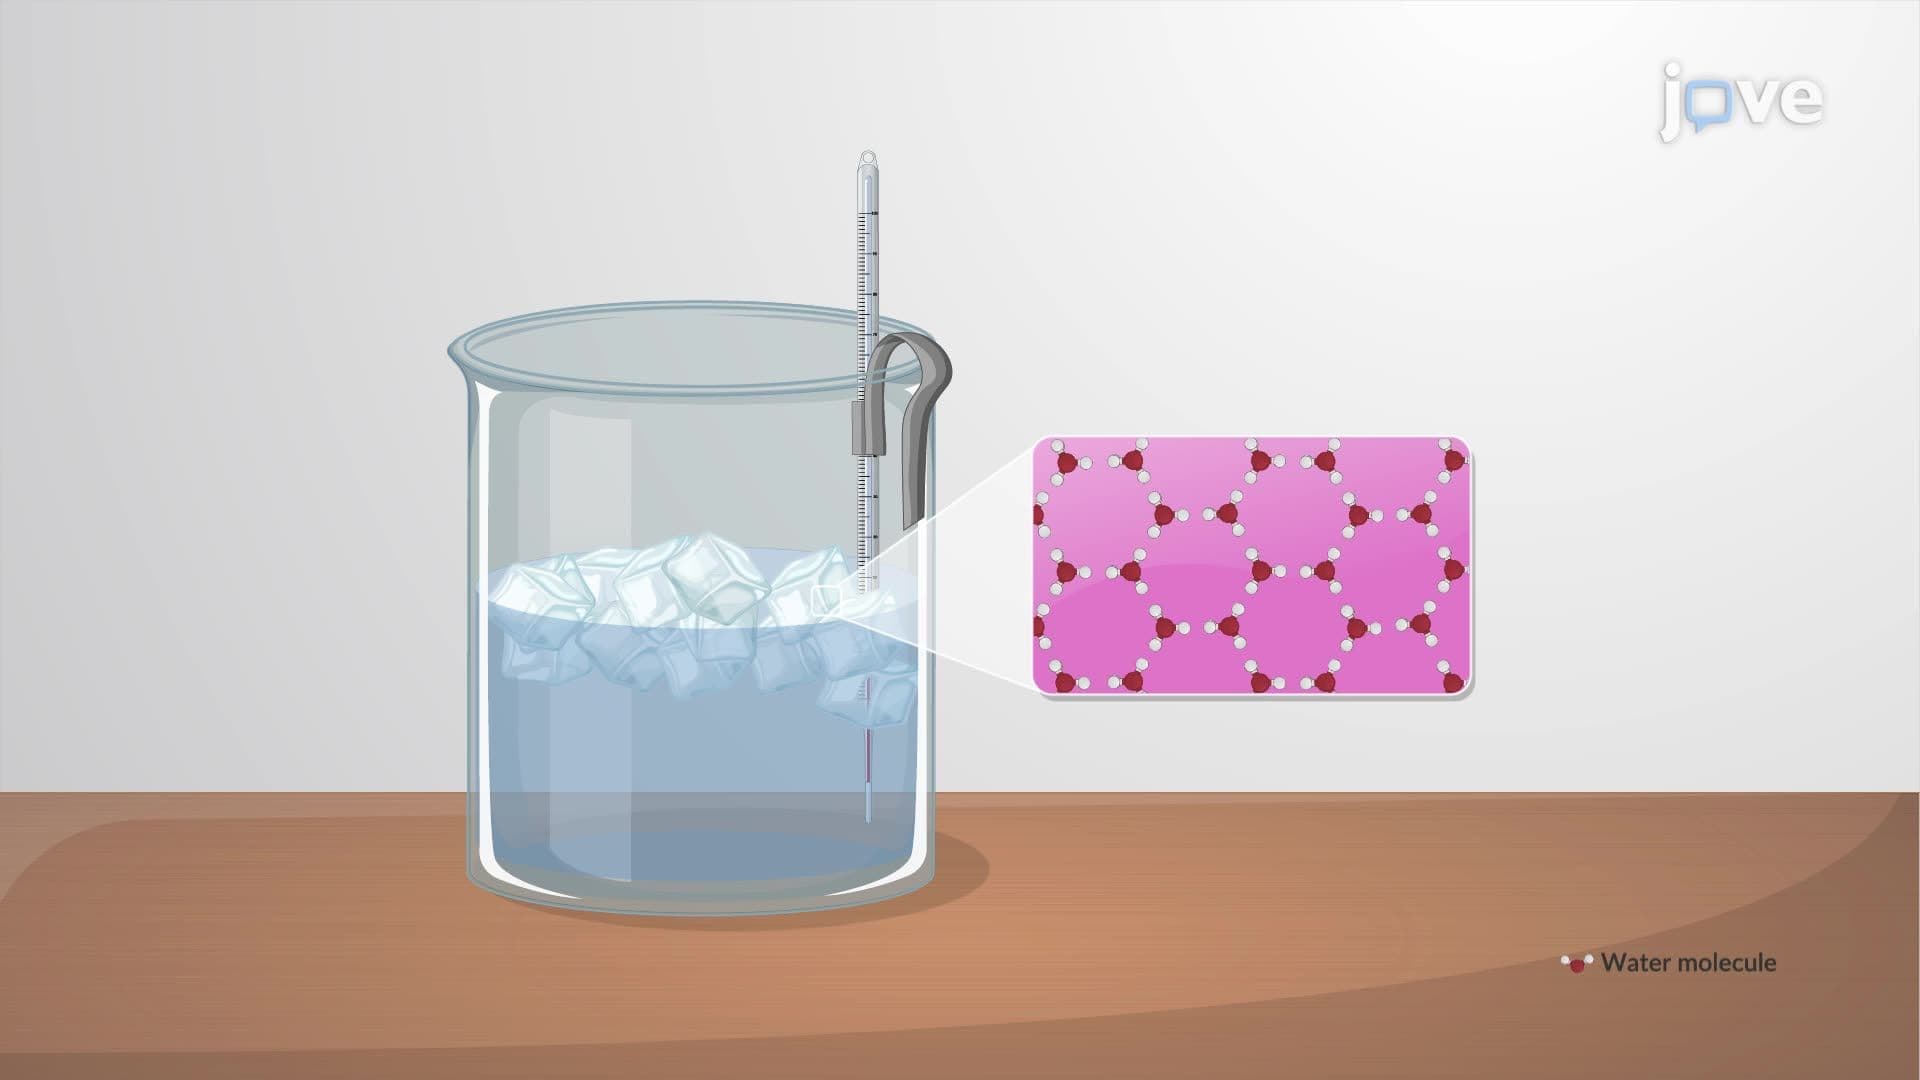
4. Single-Component Systems and Phase Transitions A single-component system contains one chemically distinct substance that can exist in multiple phases simultaneously-solid, liquid, or gas. A pressurized CO₂ canister, for example, holds liquid and gaseous CO₂ in equilibrium, forming a two-phase single-component system. Phase transitions occur at specific temperatures and pressures where two phases coexist. Because temperature remains constant during a transition, the process is isothermal. At the transition point, the Gibbs free energy change equals zero, and the entropy change is expressed as ΔS = ΔH_transition / T_transition, where ΔH is the enthalpy of the phase change.
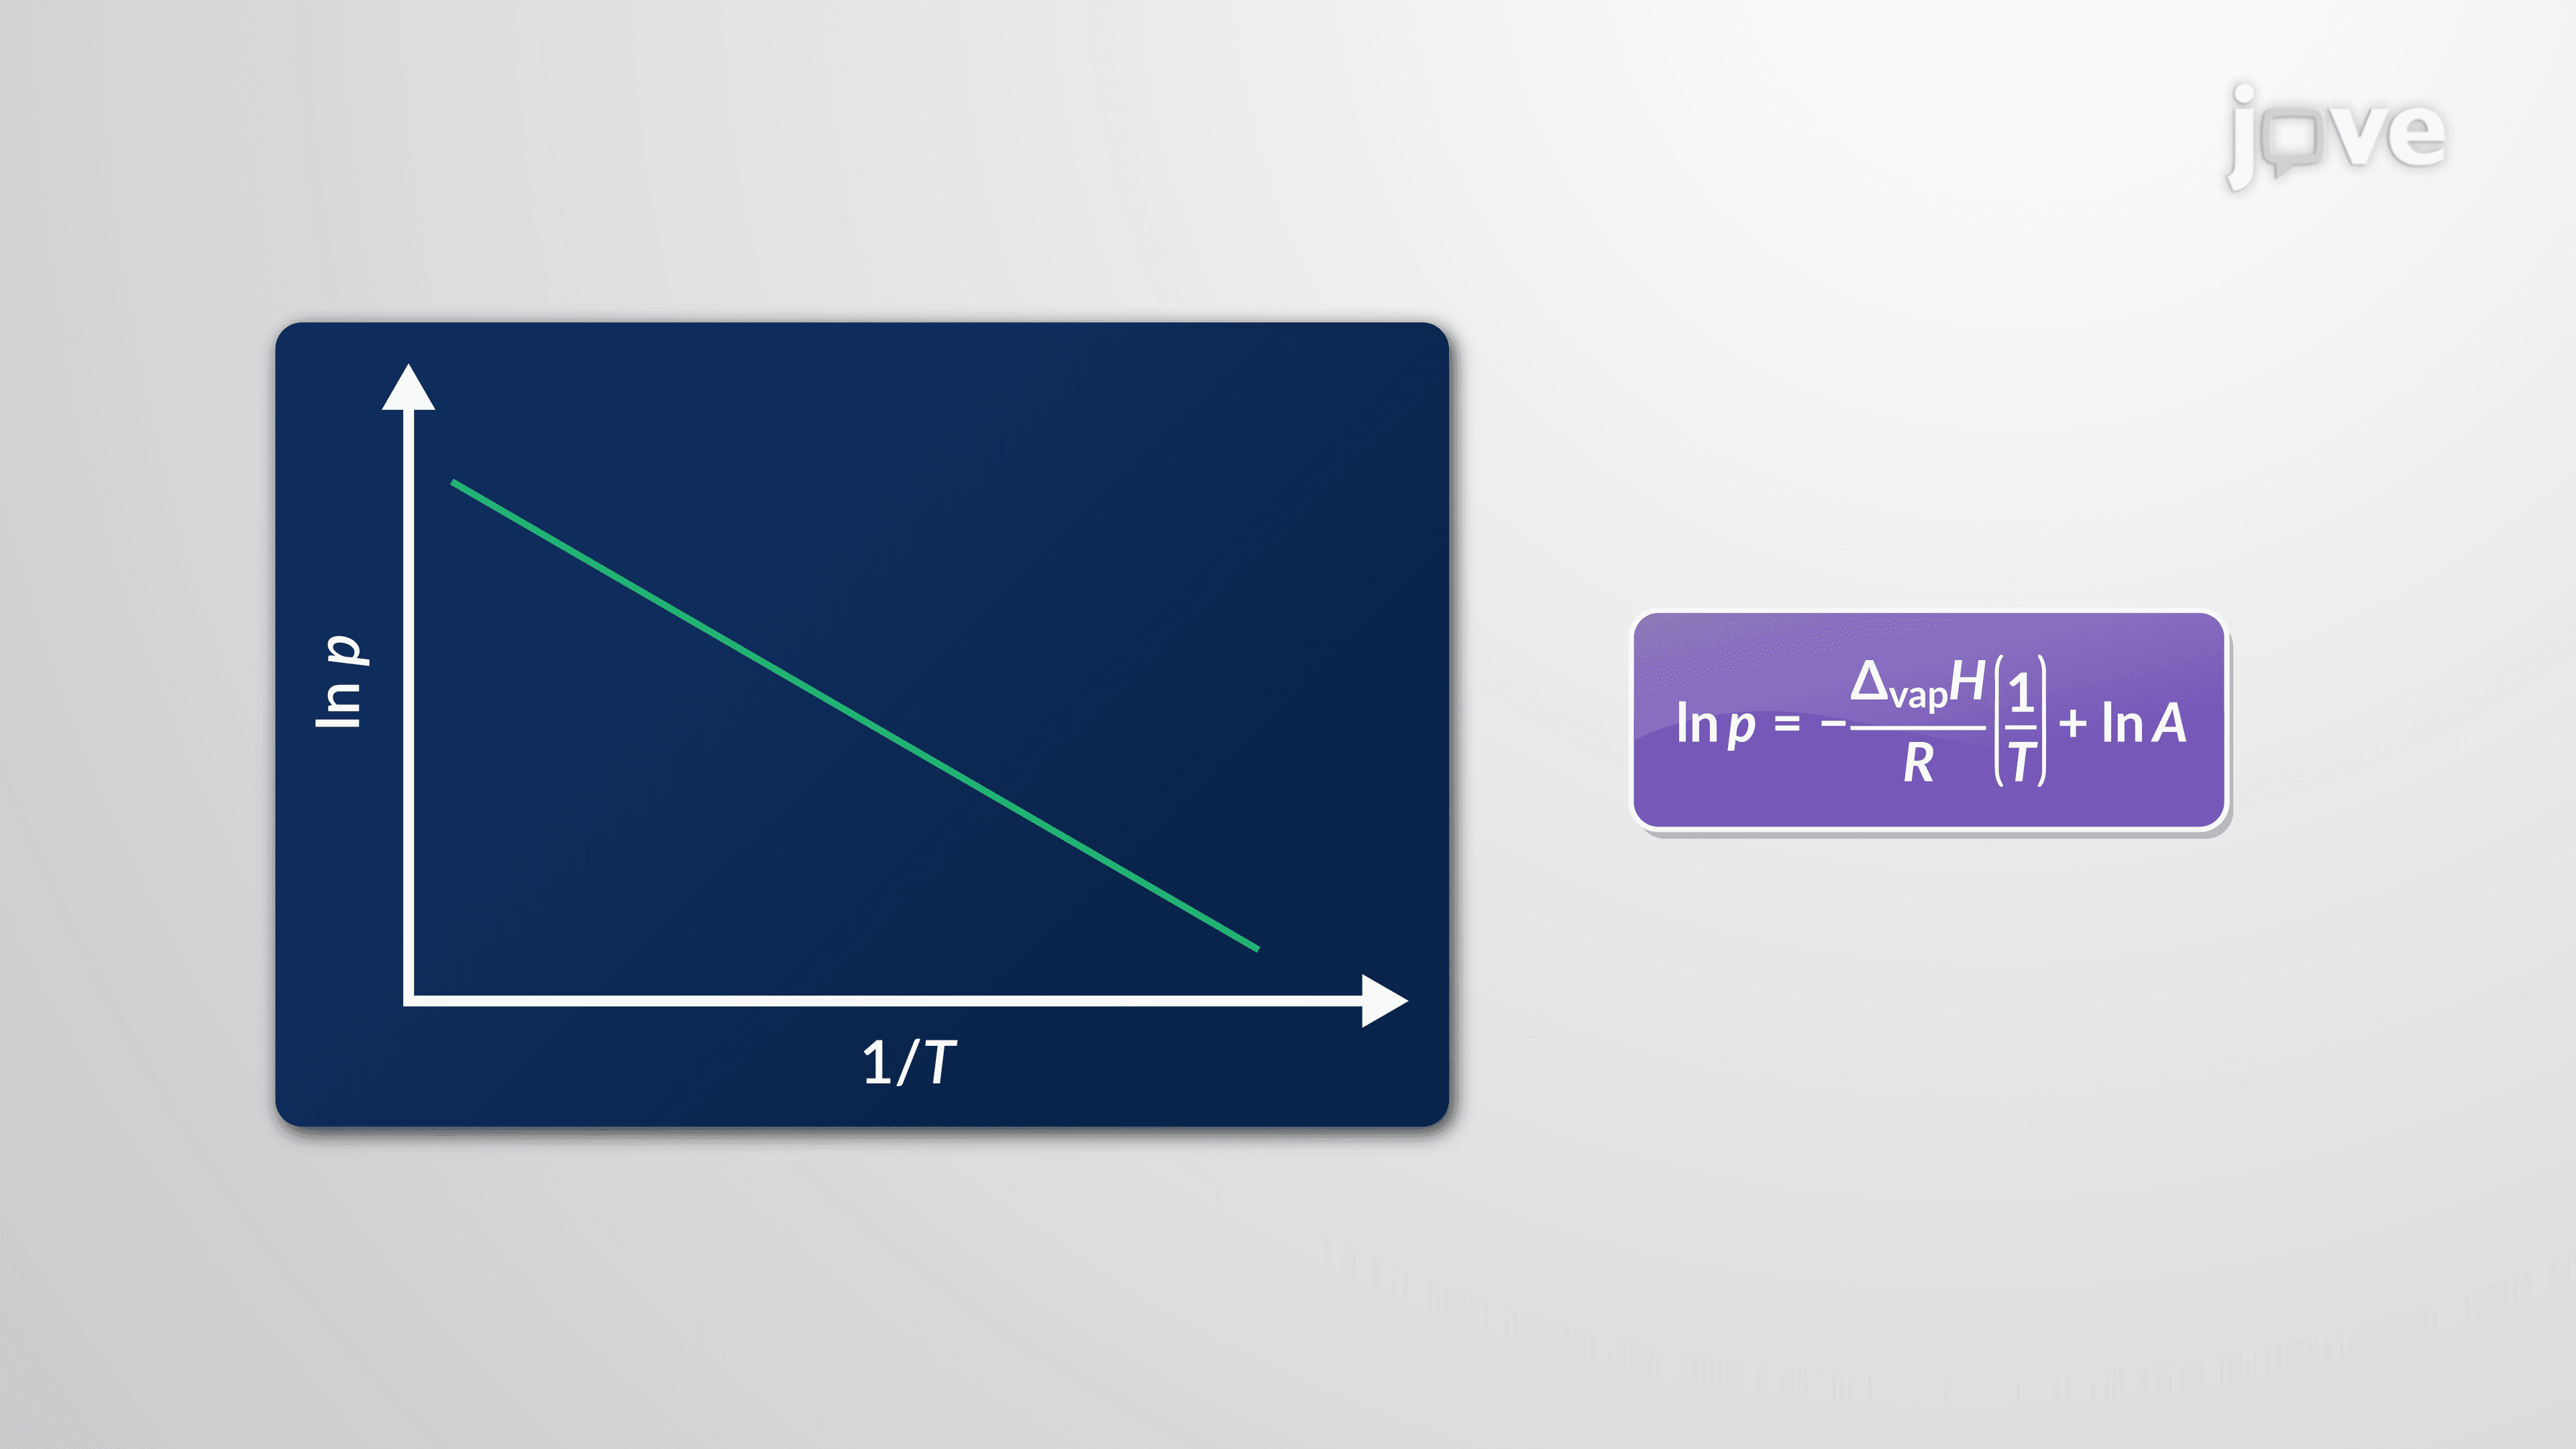
5. The Clausius-Clapeyron Equation and Vapor Pressure The Clausius-Clapeyron equation mathematically describes how a substance's vapor pressure varies with temperature. In its logarithmic form, plotting ln(P) against 1/T produces a straight line whose slope equals −ΔH_vap / R. The two-point form of the equation-ln(P₂/P₁) = −(ΔH_vap/R)(1/T₂ − 1/T₁)-is especially practical. For example, knowing water's vapor pressure at 100°C (1 atm) and its enthalpy of vaporization (~40.7 kJ/mol), you can calculate its vapor pressure at any other temperature. This equation is a staple of AP Chemistry free-response questions and physical chemistry coursework.
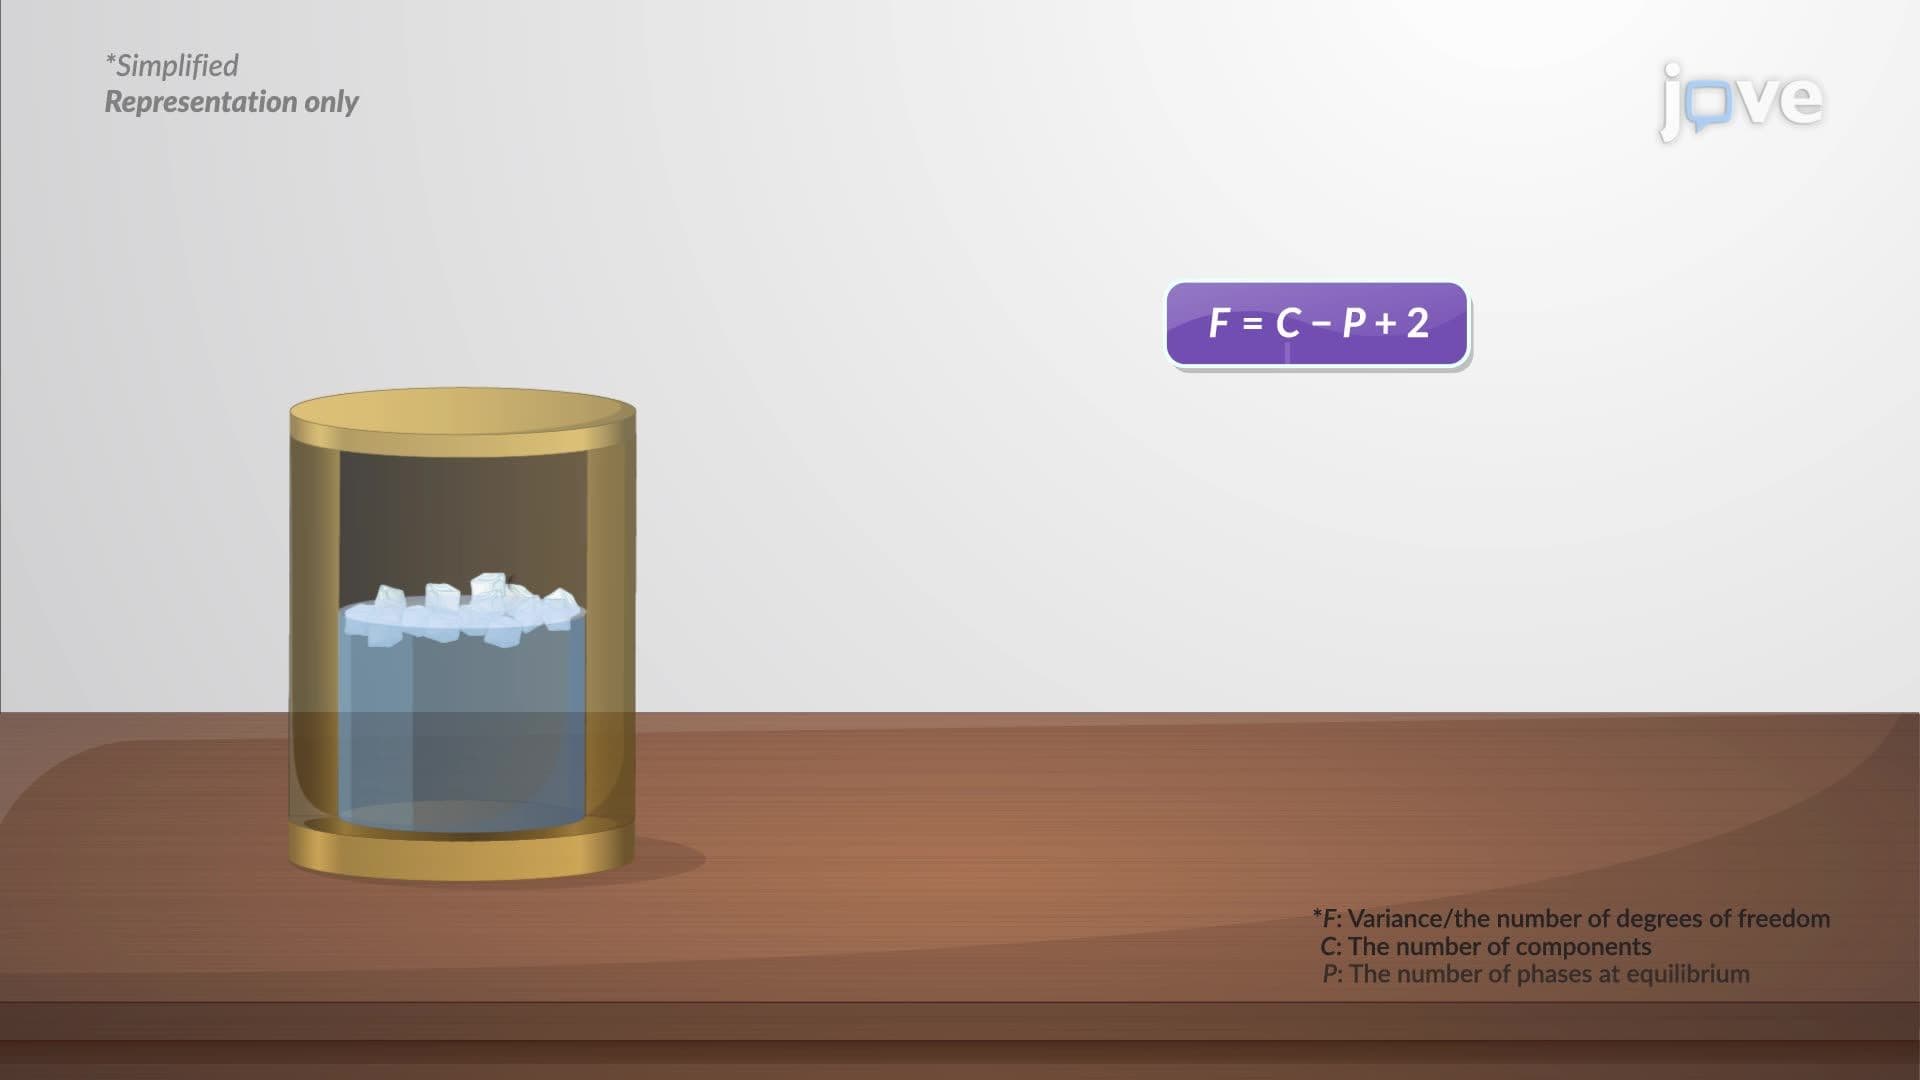
6. The Phase Rule The phase rule, formulated by Josiah Willard Gibbs, defines the degrees of freedom (F) in a system at equilibrium: F = C − P + 2, where C is the number of components and P is the number of phases. For a single-component system (C = 1): one phase gives F = 2 (both temperature and pressure are independently variable); two coexisting phases give F = 1 (only one variable can be changed independently); and three coexisting phases give F = 0, meaning the system is invariant. This fixed state is the triple point-a unique temperature and pressure combination for each substance.
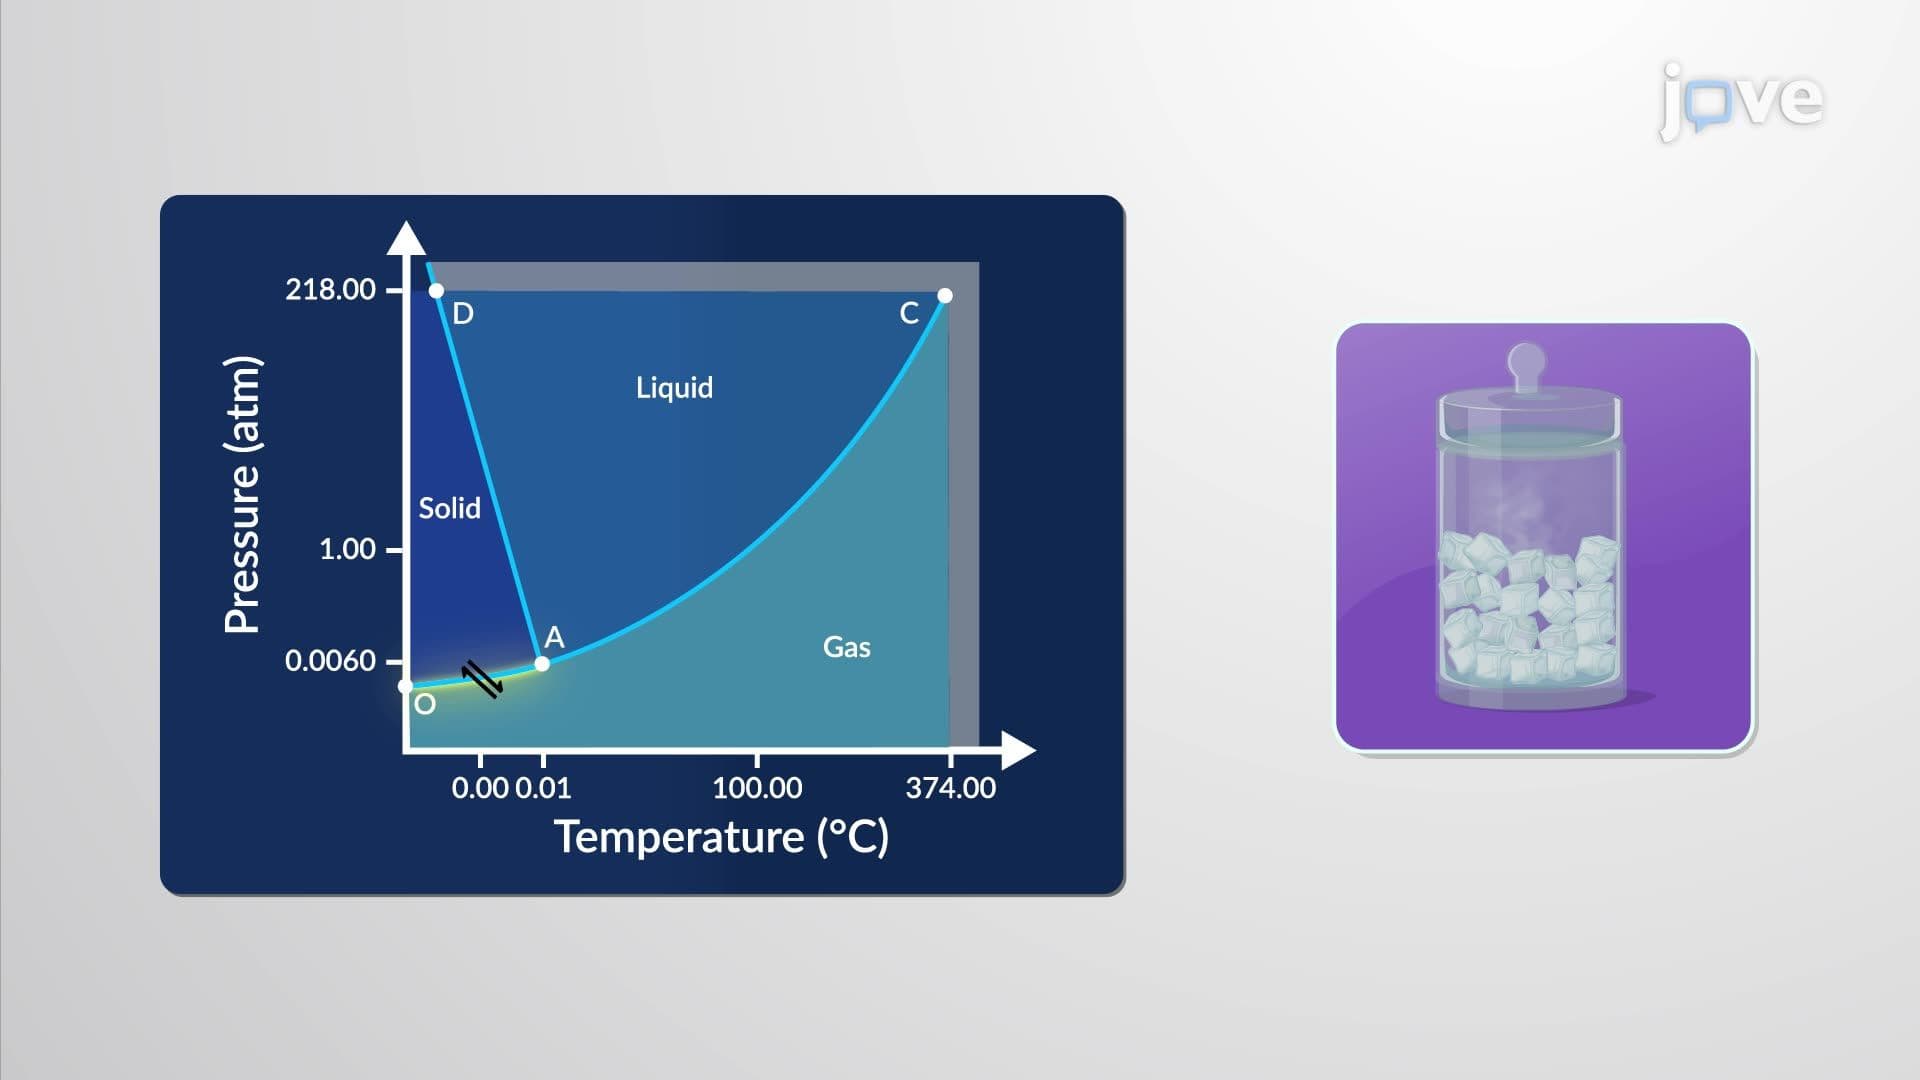
7. Phase Diagrams for Single Components A phase diagram is a pressure-versus-temperature graph showing which phase of a substance is stable under given conditions. Areas represent single stable phases; boundary lines represent two-phase equilibria. In water's phase diagram, the solid-liquid boundary has a negative slope (ice is less dense than liquid water-a unique property). The vapor-pressure curve of liquid water (line AC) ends at the critical point (374°C, 218 atm), beyond which water exists as a supercritical fluid. The triple point occurs at 0.01°C and 0.006 atm. Interpreting phase diagrams is a key skill for both AP Chemistry and university physical chemistry courses.