Loading video…

 9 Concepts
 2K views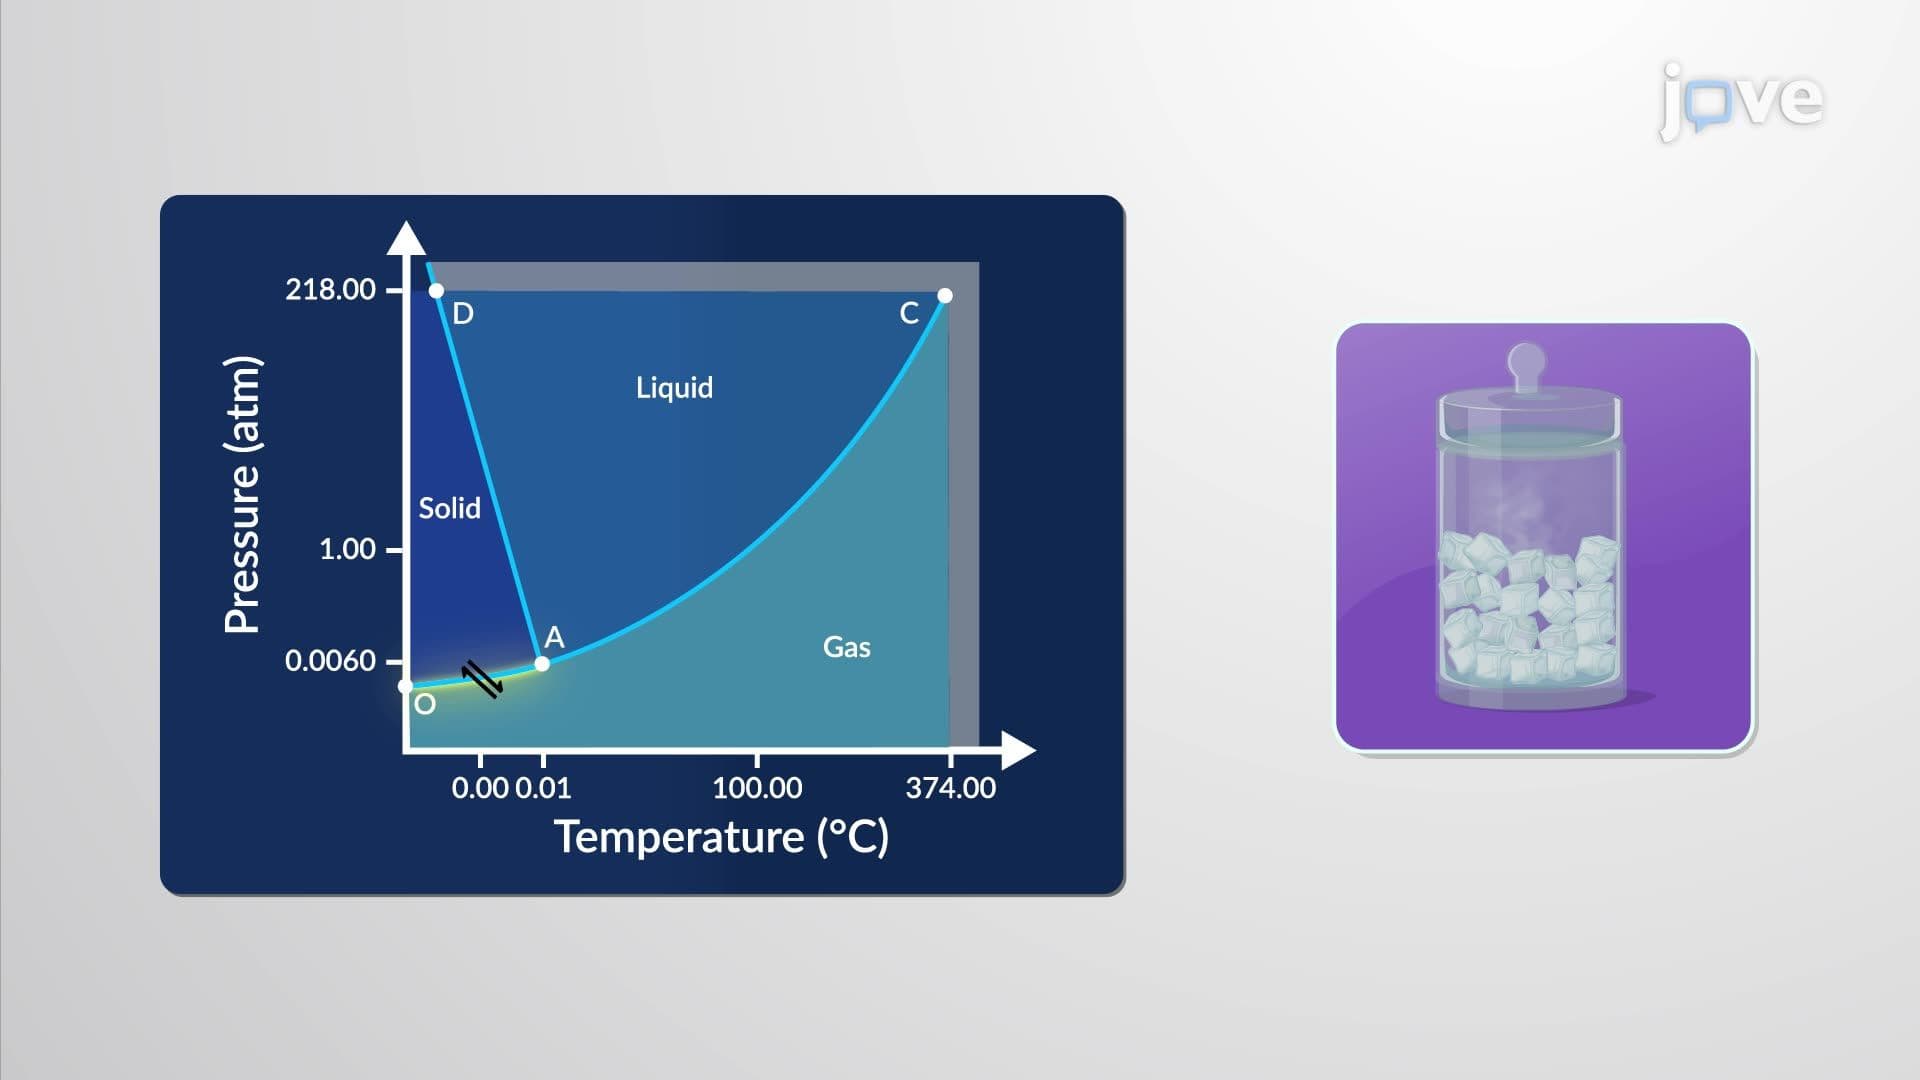

Video Summary: What Is Phase Diagram
Did you know that water can exist as a solid, liquid, and gas simultaneously at a precise temperature and pressure? A phase diagram is a powerful graphical tool that maps exactly when and how substances change states. Used in AP Chemistry courses and college labs across the US, phase diagrams reveal critical points, triple points, and vapor pressure curves. Watch the full video on JoVE Coach to master this concept with expert-led visuals and step-by-step explanations.
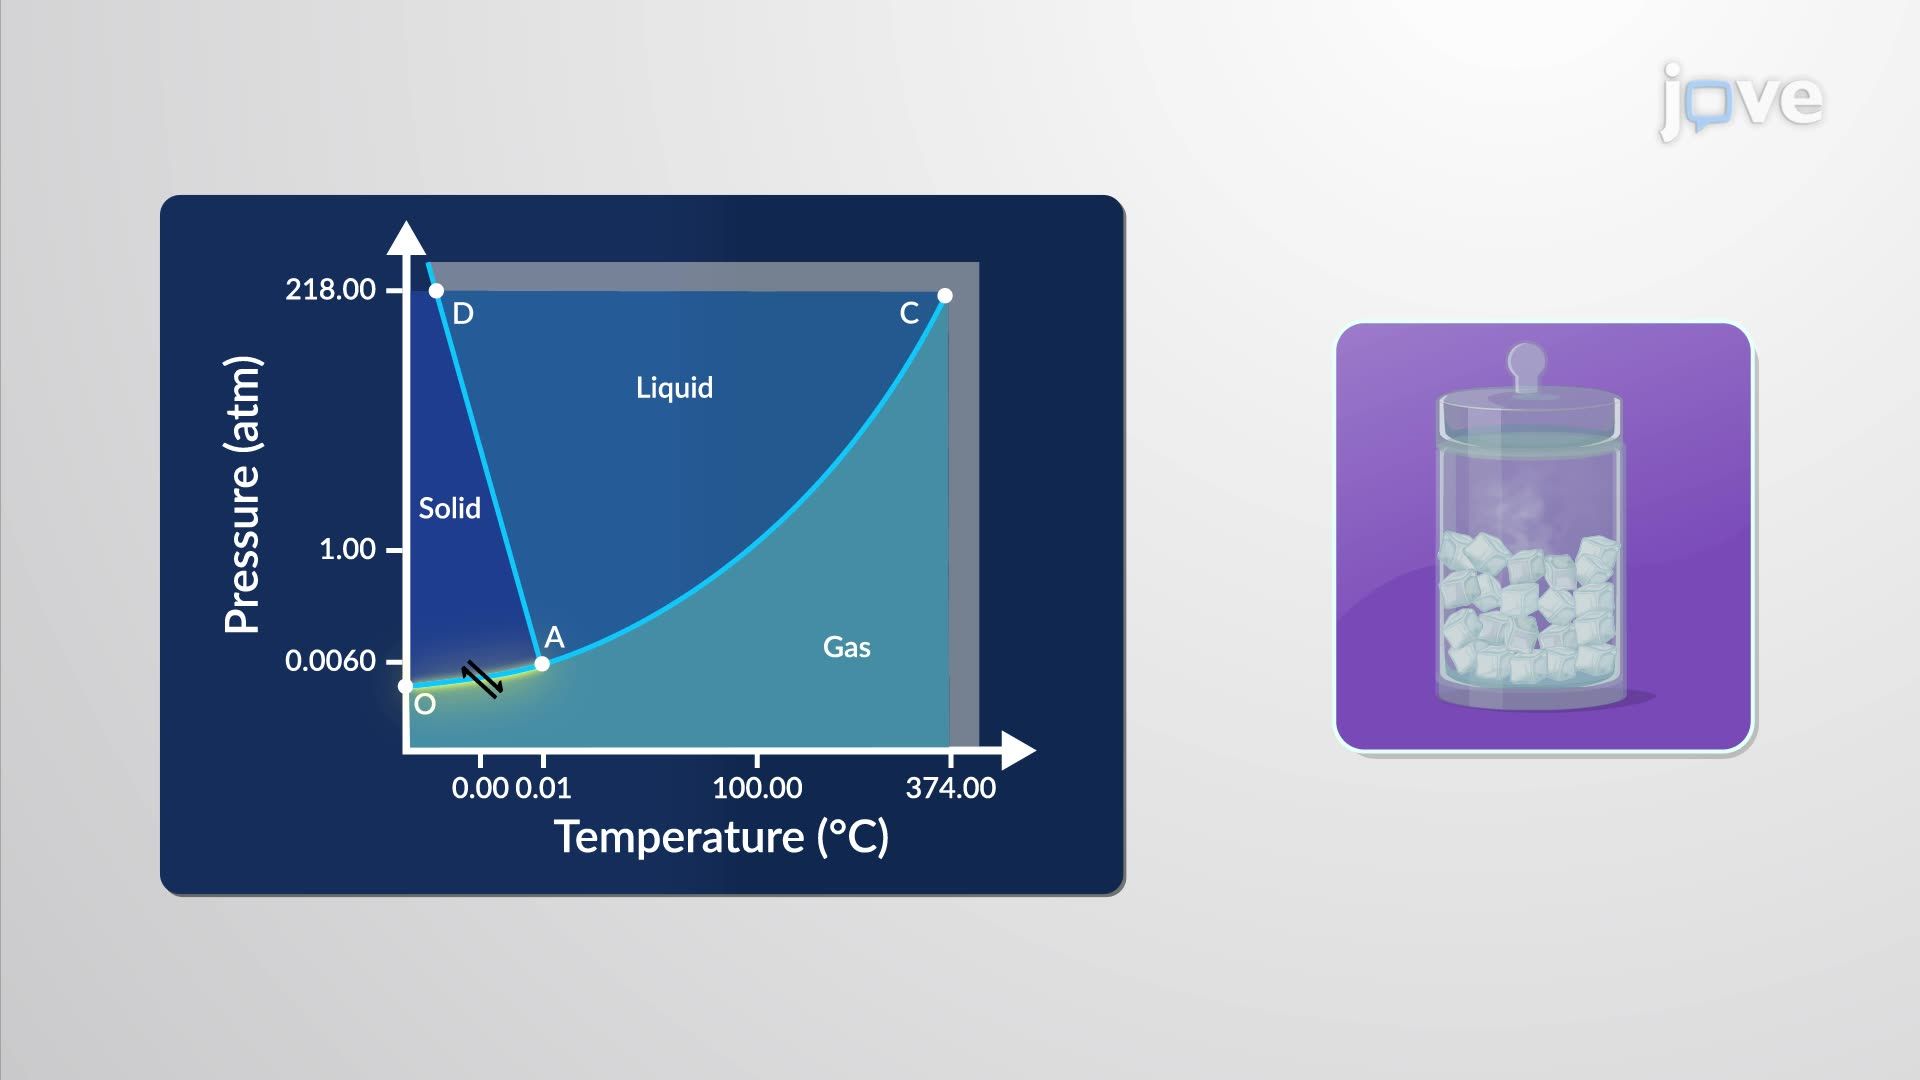
A phase diagram is a graph that shows which physical state, solid, liquid, or gas, a pure substance occupies at any given combination of temperature and pressure. Think of it as a map: just as a road map tells you what terrain to expect, a phase diagram tells you what phase of matter to expect. Understanding phase diagrams is a foundational skill in AP Chemistry, college General Chemistry (Chem 101), and standardized tests like the MCAT.
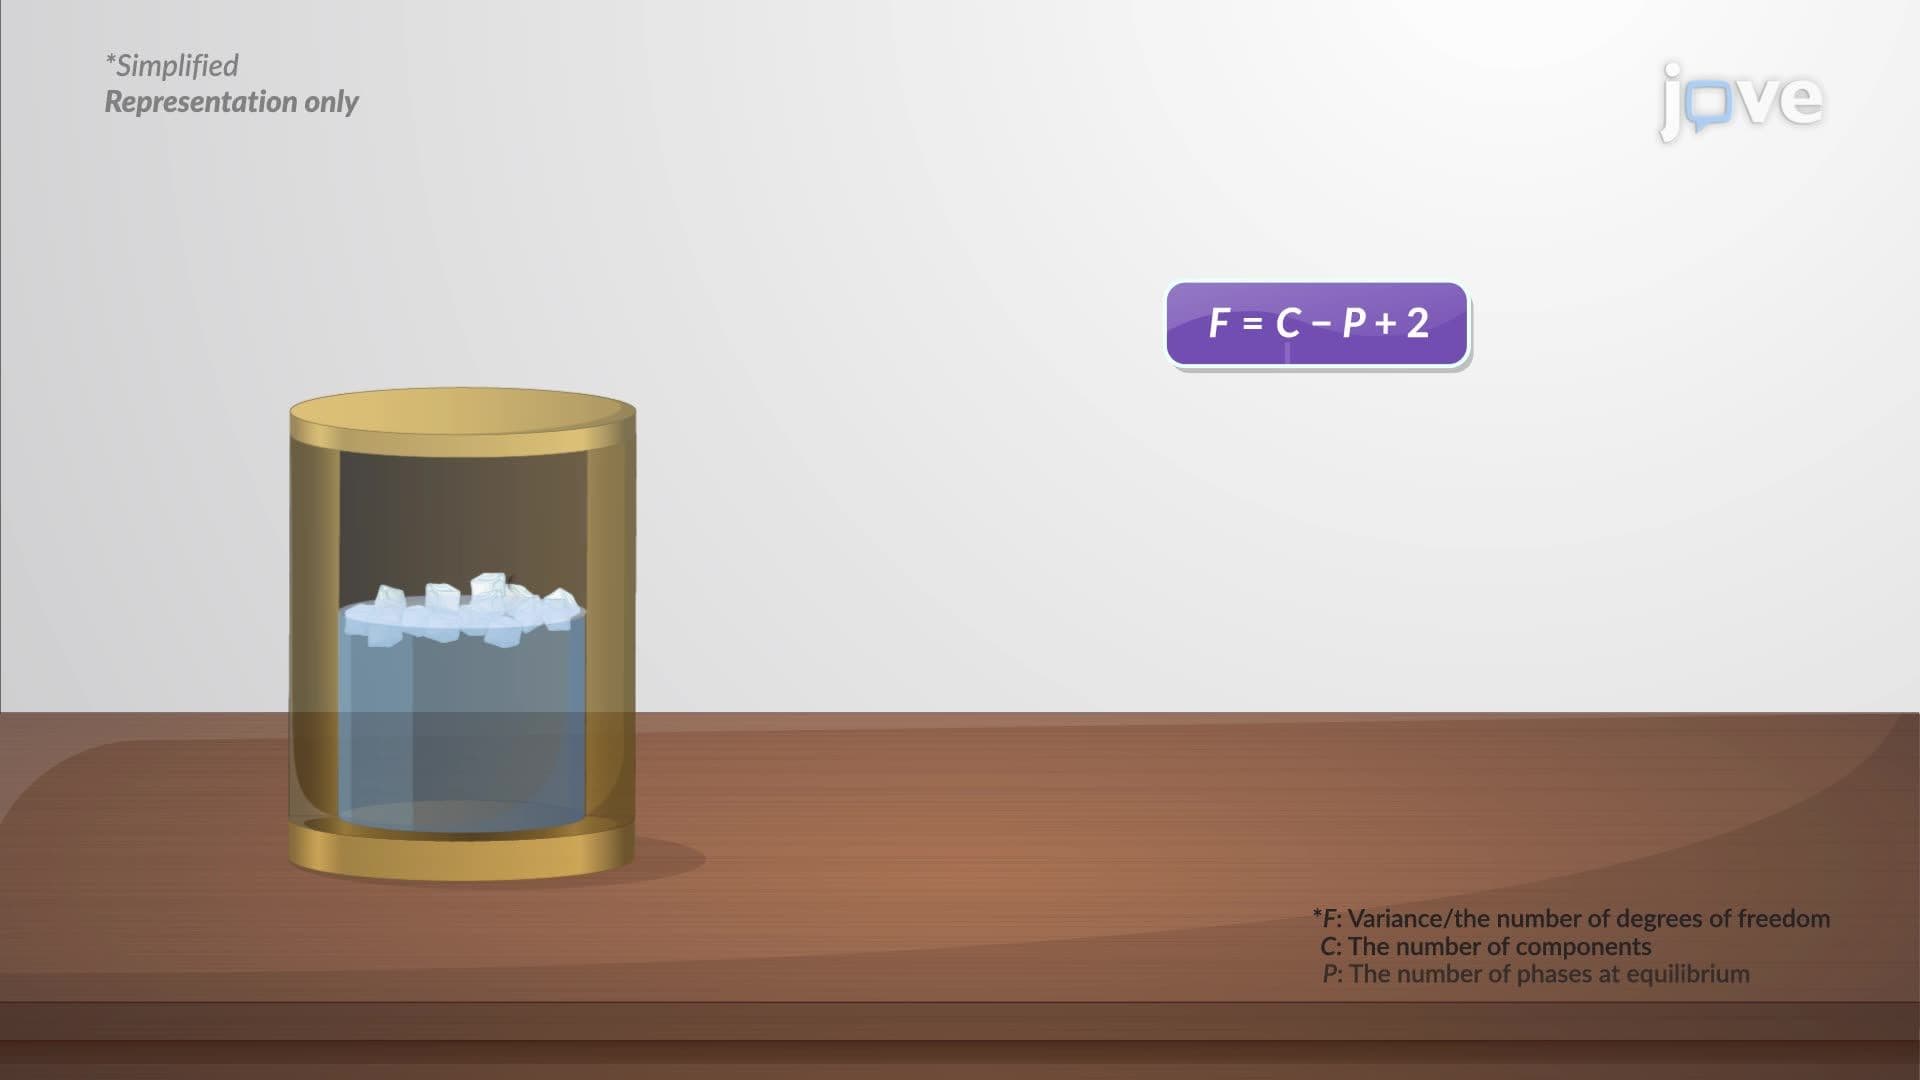
The lines on a phase diagram are not just dividers, they represent conditions where two phases exist in equilibrium at the same time. There are three critical curves:
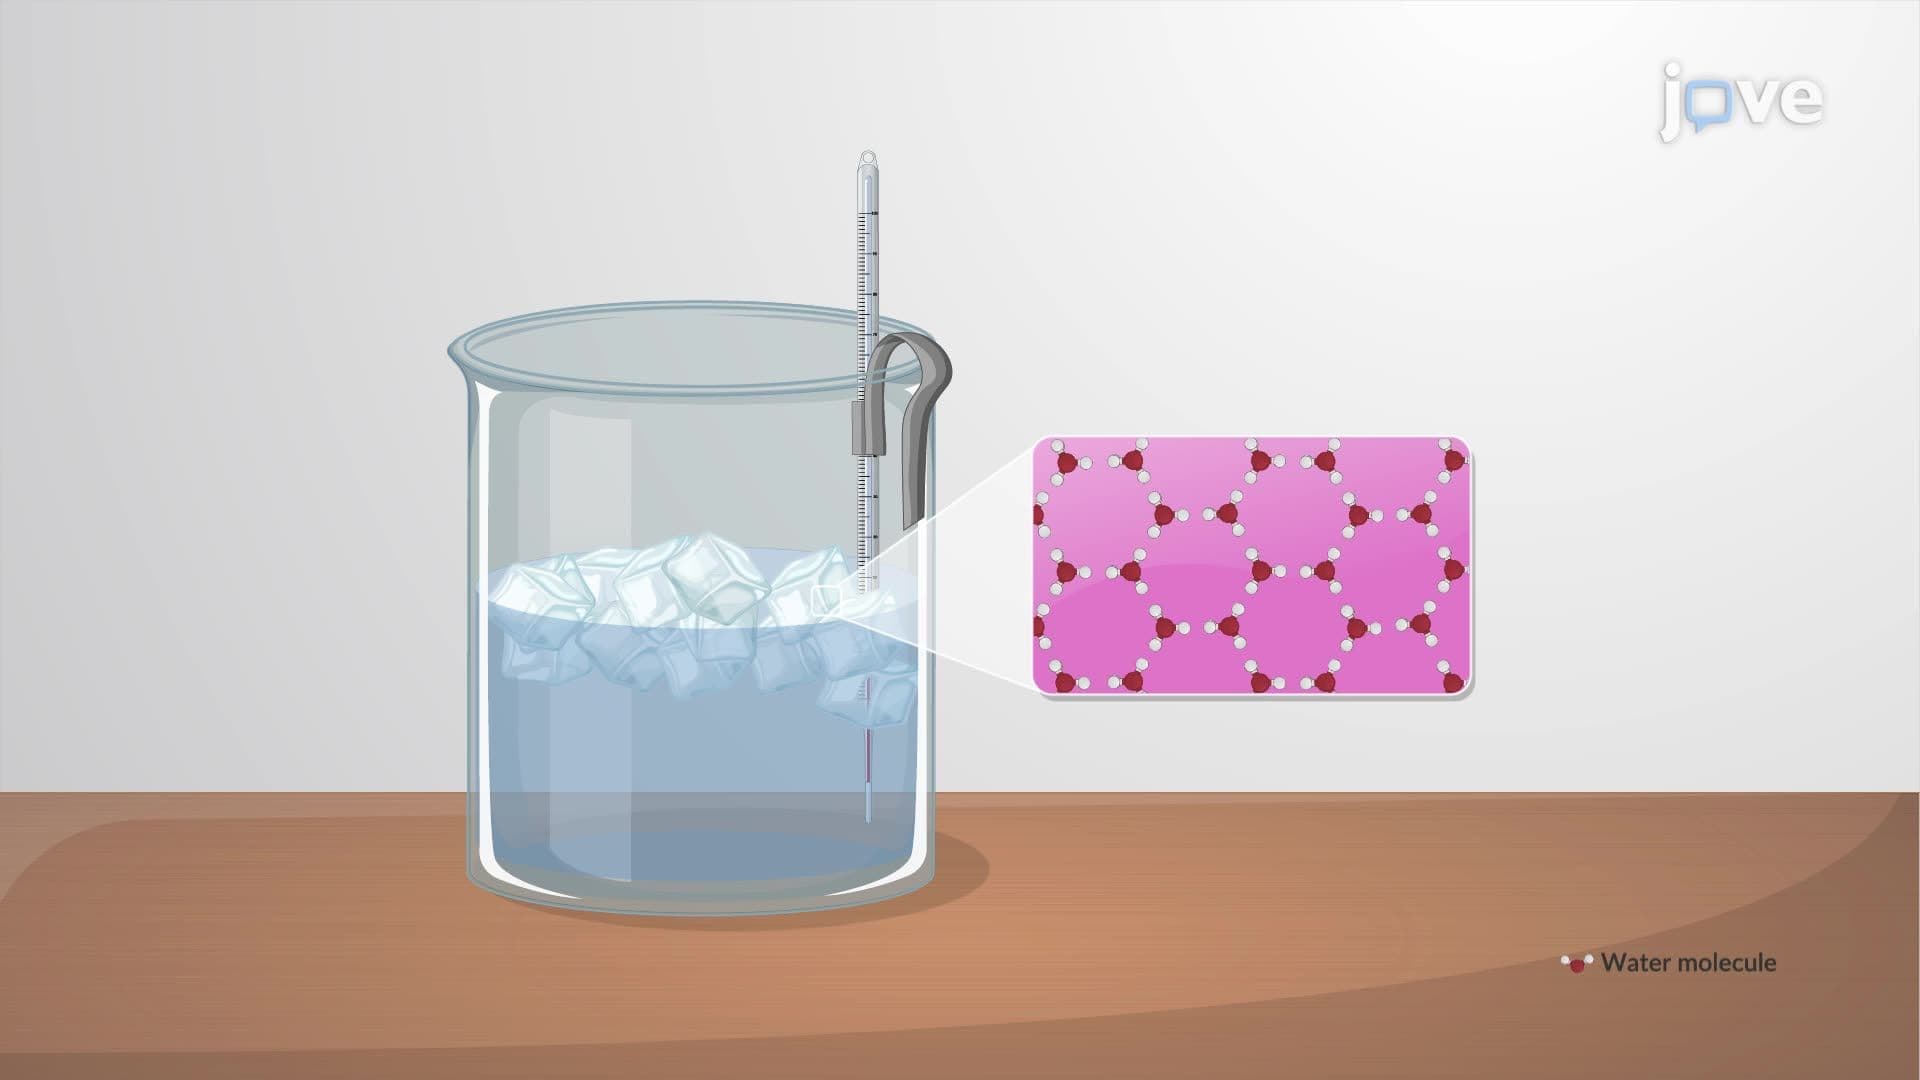
The triple point is the unique temperature and pressure at which all three phases coexist in equilibrium. For water, this occurs at 0.01°C and 0.006 atm, a very precise, reproducible condition. Scientists use the triple point of water as a calibration standard for thermometers.
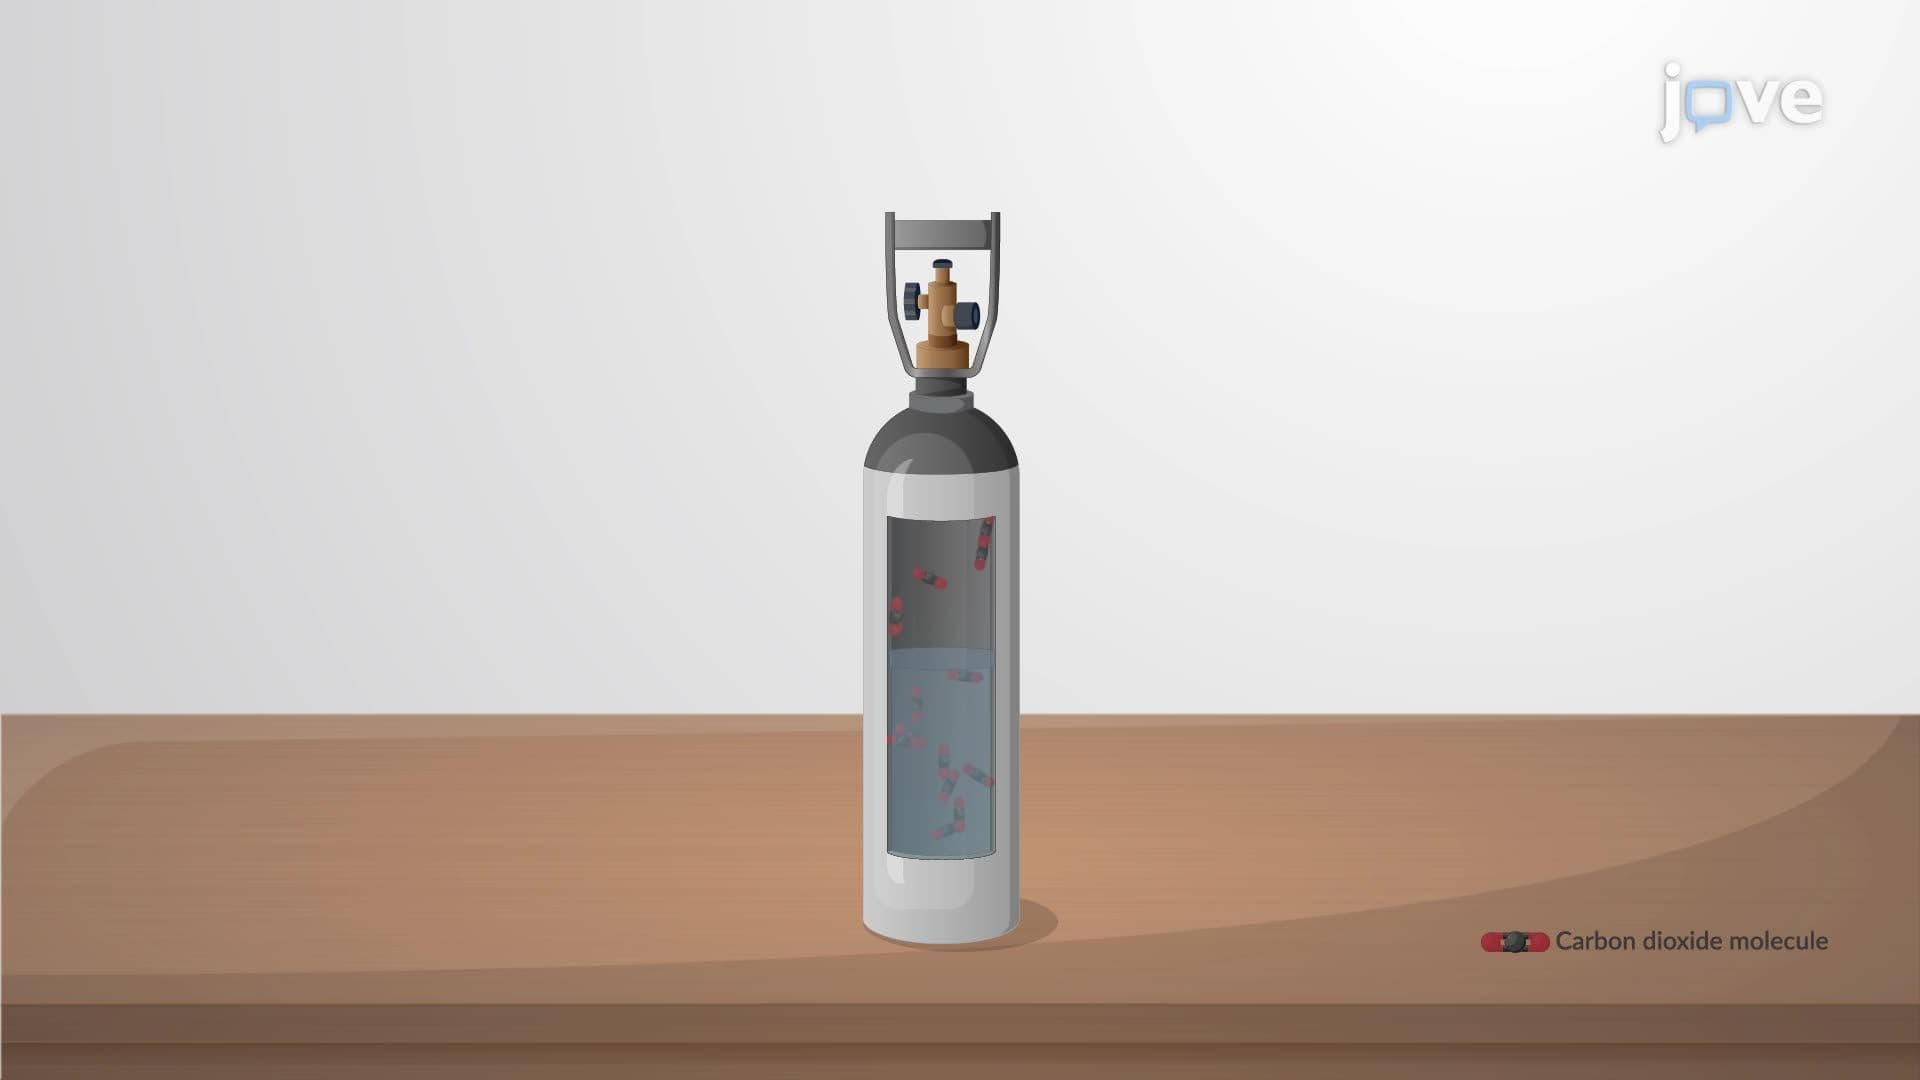
The critical point marks the end of the liquid-gas boundary. Beyond this point, the distinction between liquid and gas disappears entirely, producing a supercritical fluid. For water, the critical point is 374°C and 218 atm. Supercritical CO₂ is used commercially in the US for decaffeinating coffee and extracting compounds in pharmaceutical manufacturing.
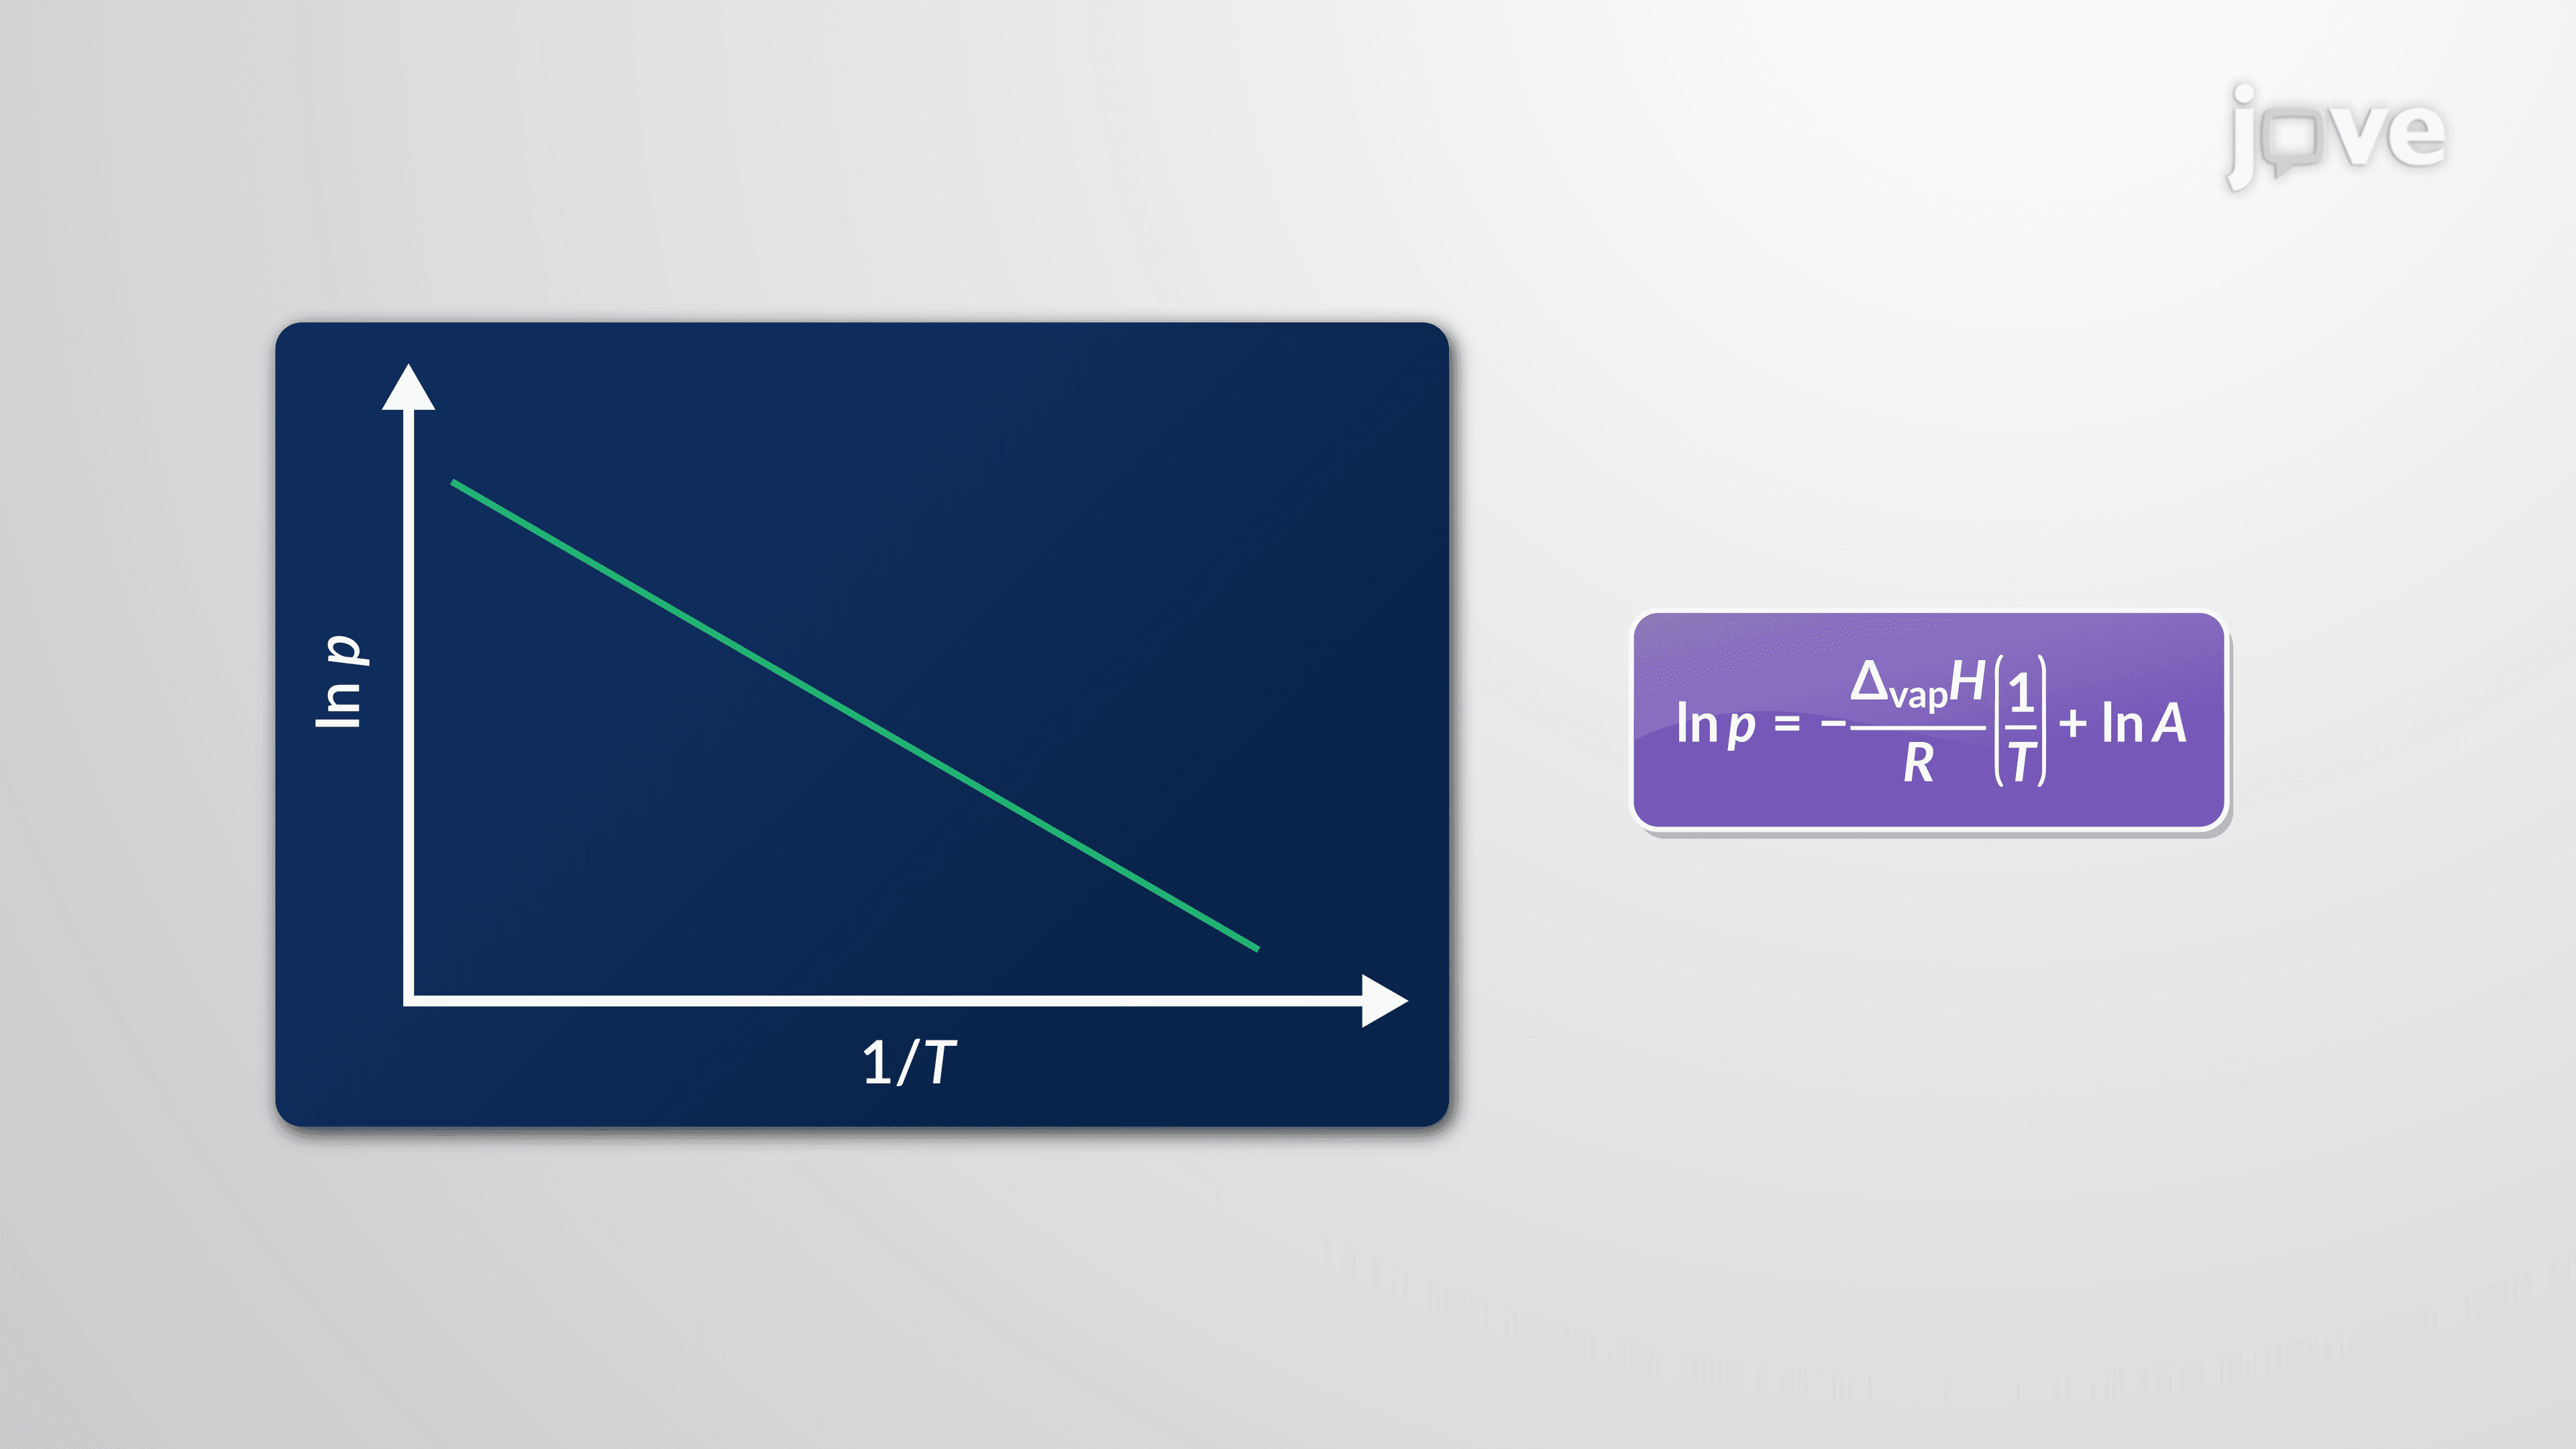
The Clausius-Clapeyron equation gives mathematical precision to the vapor pressure curve. In its simplified form:
ln(P2 / P1) = -(delta H vap / R) × (1/T2 - 1/T1)
Here, P1 and P2 are vapor pressures at temperatures T1 and T2, delta H vap is the enthalpy of vaporization, and R is the universal gas constant (8.314 J/mol·K). This equation appears frequently on the MCAT and in college physical chemistry courses. It explains why mountain climbers in Colorado find that water boils below 100°C, at higher altitudes, atmospheric pressure drops, shifting the equilibrium point on the vapor pressure curve to a lower temperature.
Related Micro-courses