Loading video…


 27 Concepts
 42.9K views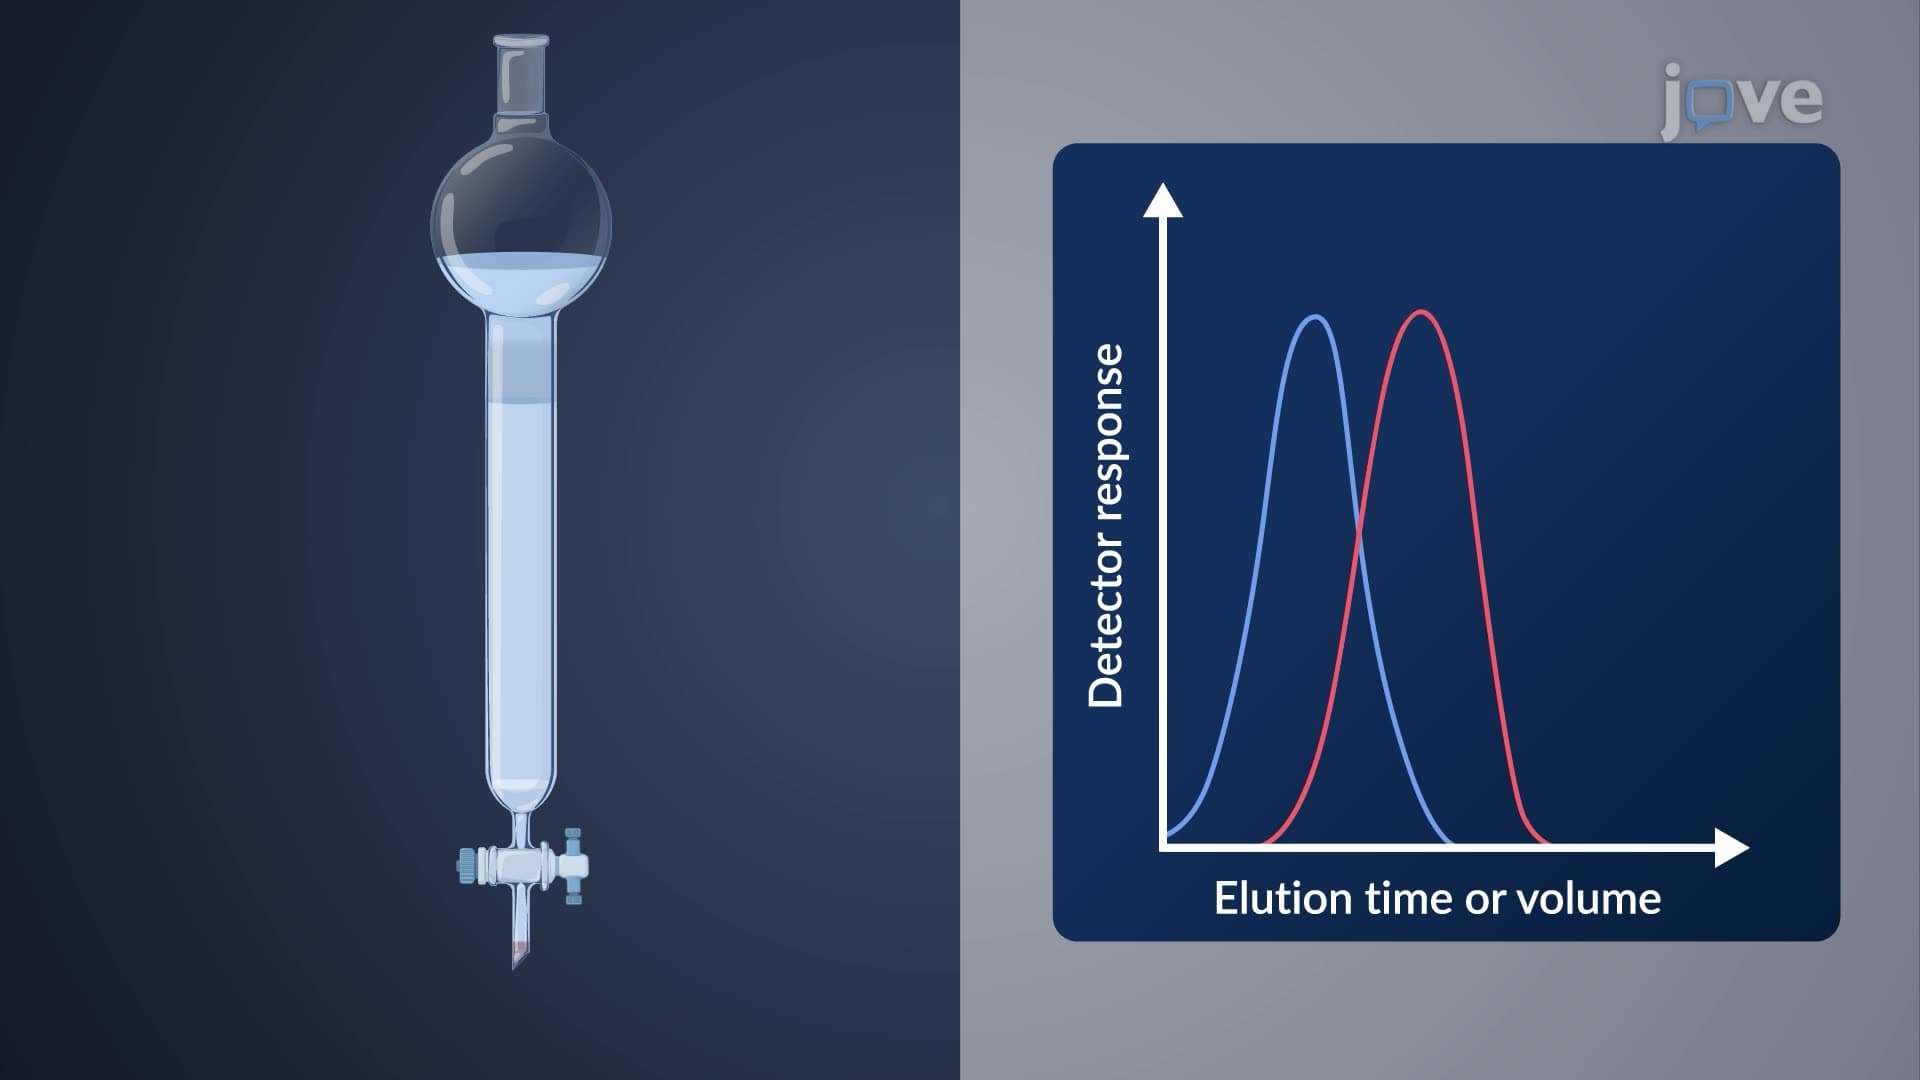

Video Summary: What Is Chromatographic Resolution
Ever wonder how forensic labs separate complex drug mixtures or how pharmaceutical companies ensure medication purity? Chromatographic resolution explained starts with understanding how well a column separates different compounds. The FDA relies on precise chromatographic techniques to verify that medications contain exactly what their labels claim, preventing dangerous drug contaminations that have historically caused patient harm. What is Chromatographic Resolution becomes critical when two similar compounds must be distinguished with mathematical precision. Watch the full video on JoVE Coach to master this concept with expert-led visuals and step-by-step explanations.
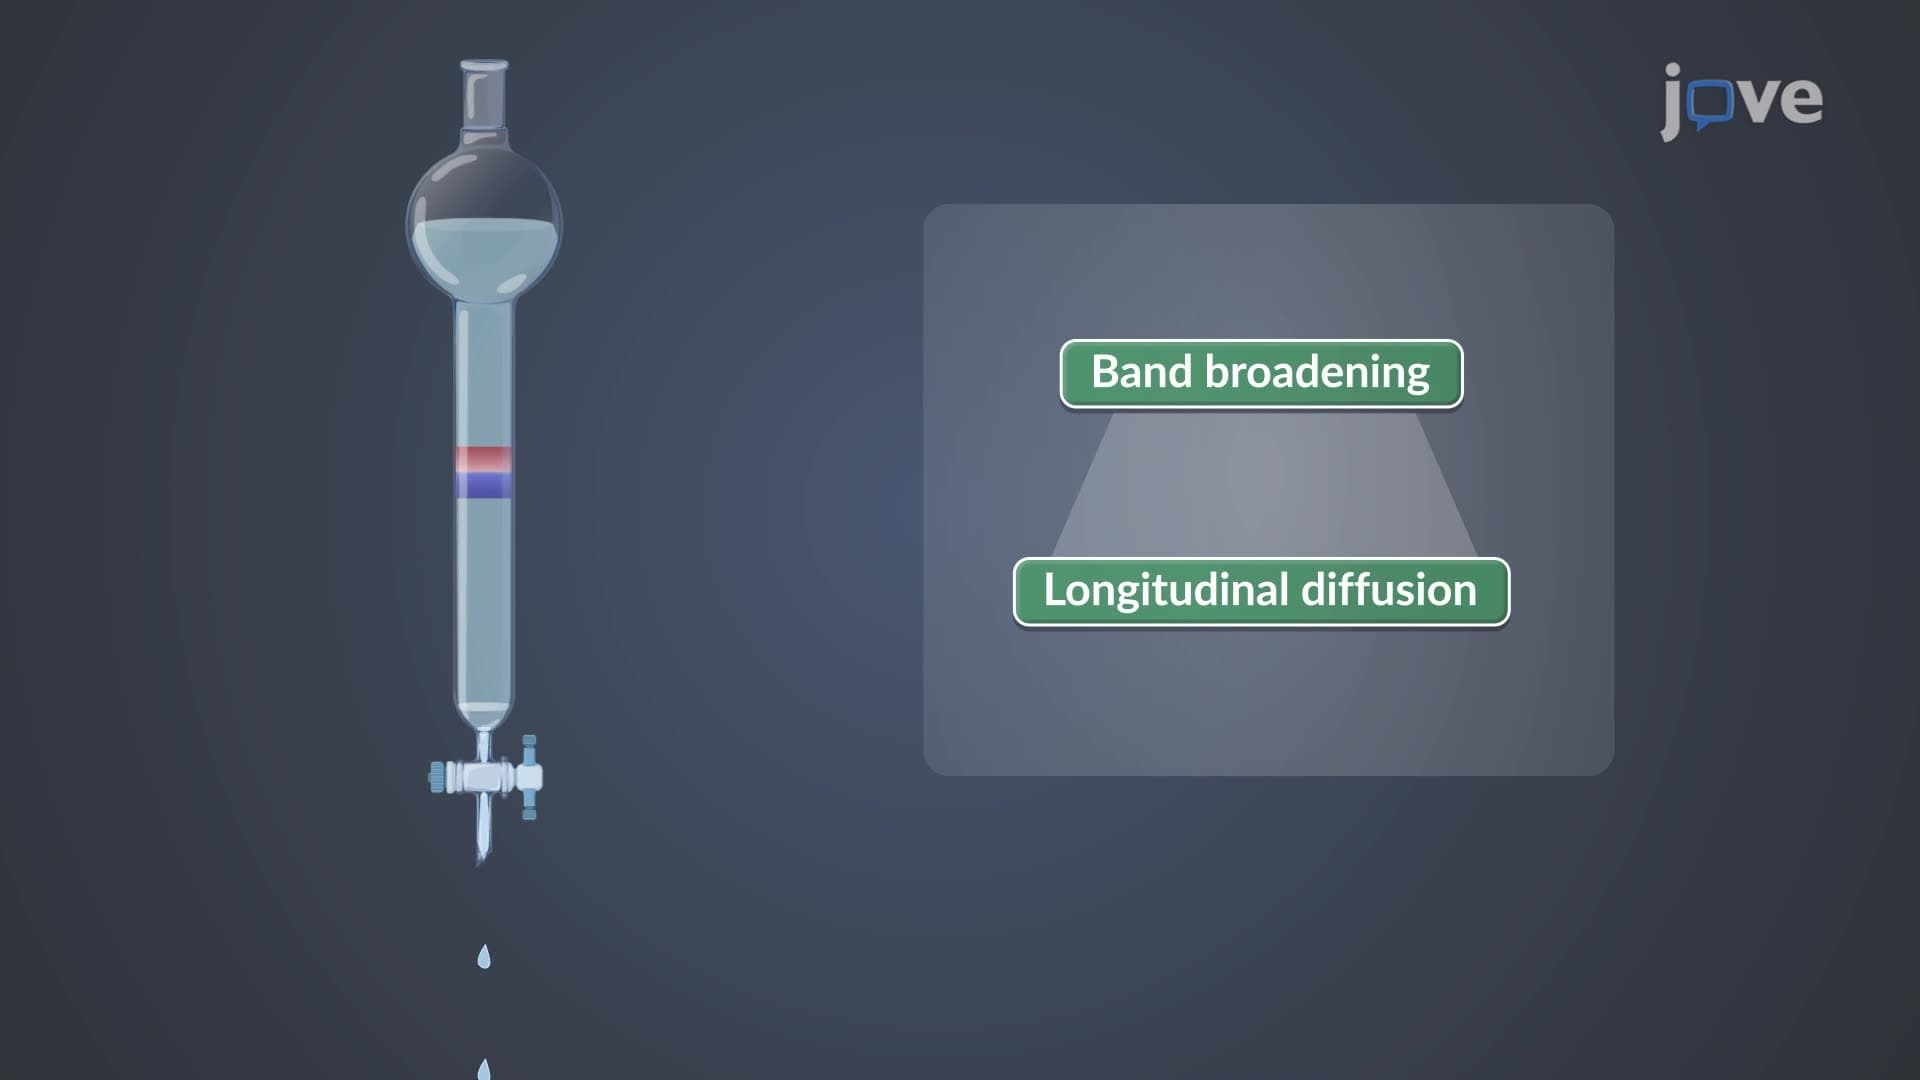
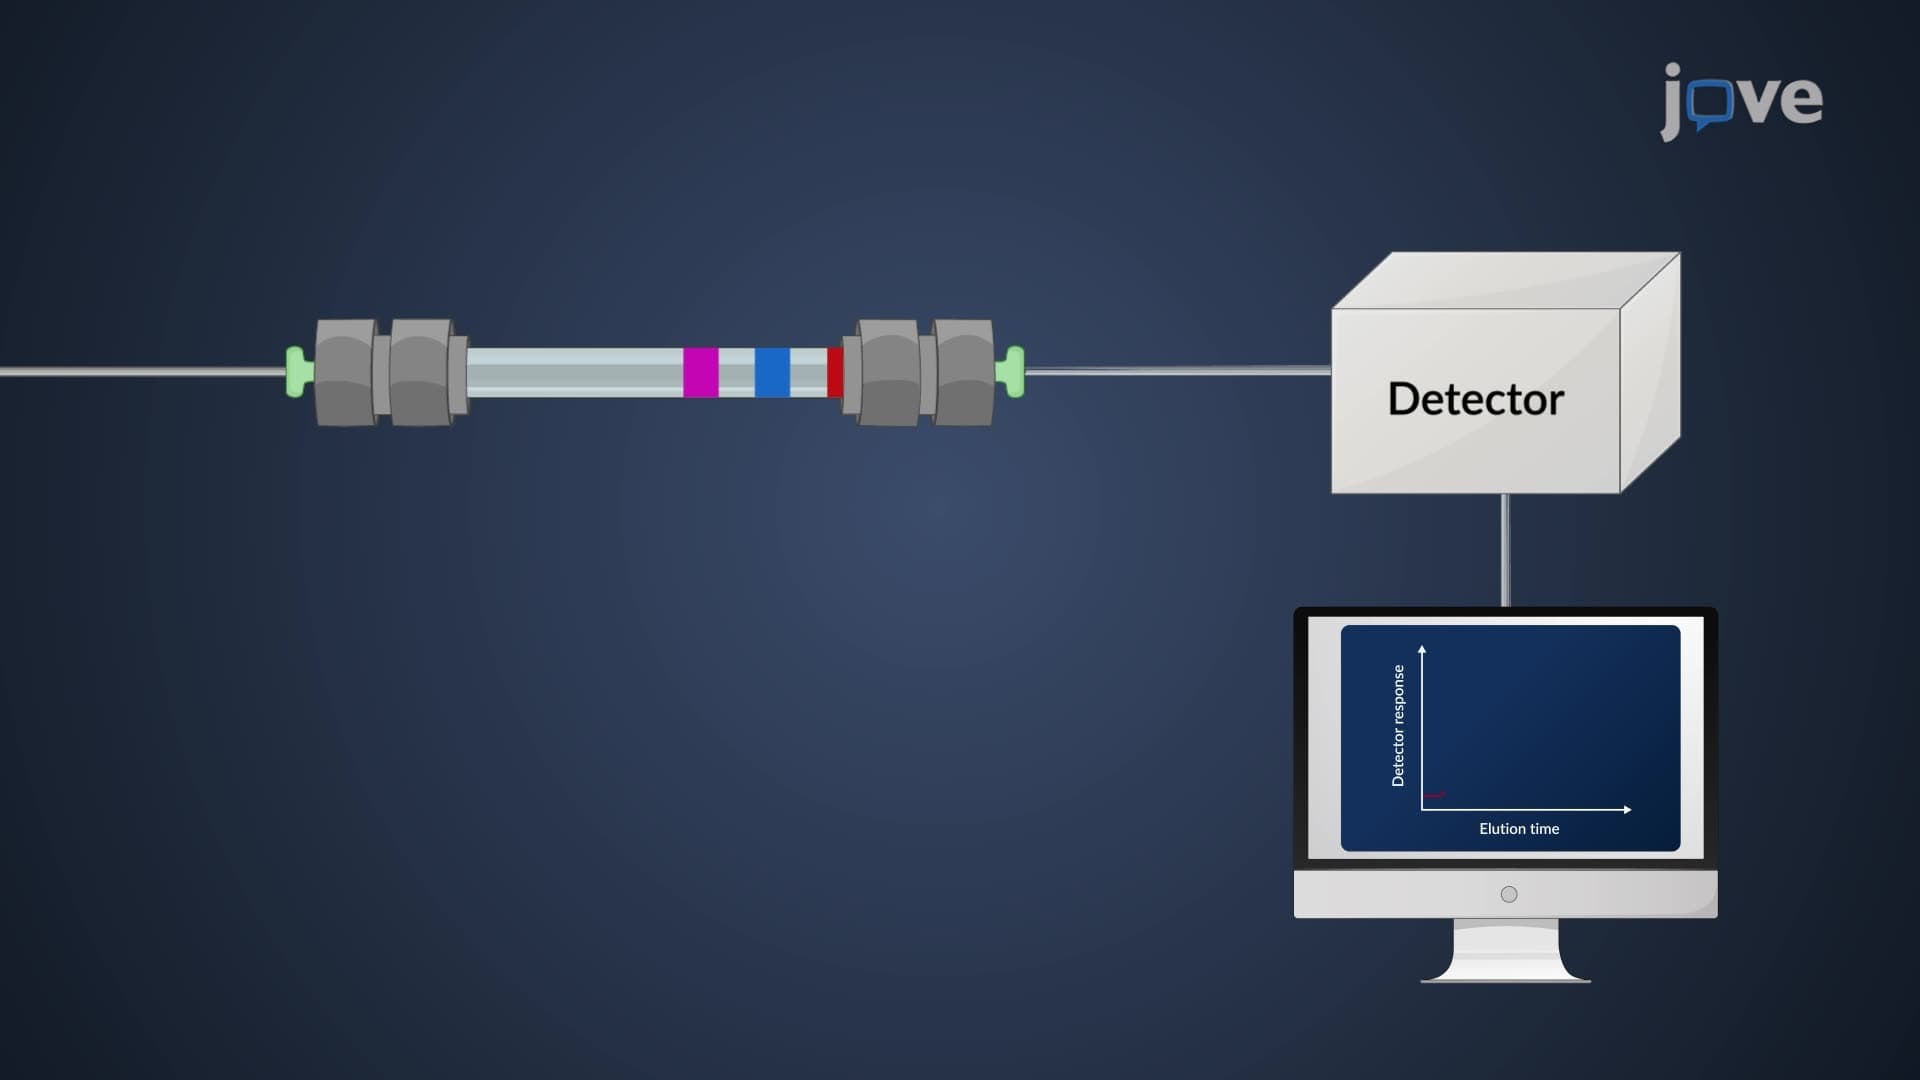
Resolution in chromatography chemistry represents the fundamental measure of separation quality between two adjacent peaks. When compounds travel through a chromatographic column, they naturally spread into bell-shaped (Gaussian) distributions. The challenge lies in achieving sufficient separation to distinguish between similar compounds-a critical requirement in pharmaceutical manufacturing, environmental analysis, and forensic investigations.
The resolution equation chromatography follows a straightforward mathematical relationship: Rs = 2(tR2 - tR1)/(W1 + W2), where tR represents retention times and W represents peak widths at the baseline. This formula quantifies separation quality, with Rs values above 1.5 typically indicating baseline resolution suitable for quantitative analysis.
Baseline resolution chromatography becomes essential when analyzing complex mixtures. Consider how the DEA analyzes seized drug samples-inadequate resolution could fail to distinguish between legal medications and controlled substances with similar chemical structures. The Rs value separation directly correlates with analytical reliability: Rs = 1.0 shows 98% separation, while Rs = 1.5 achieves 99.7% baseline resolution.
For students preparing for AP Chemistry or college analytical chemistry courses, understanding that peak width measurements can utilize either baseline width or width at half-maximum height proves crucial. When baseline measurements become difficult due to noise or tailing, the half-height method provides equivalent information with improved precision.
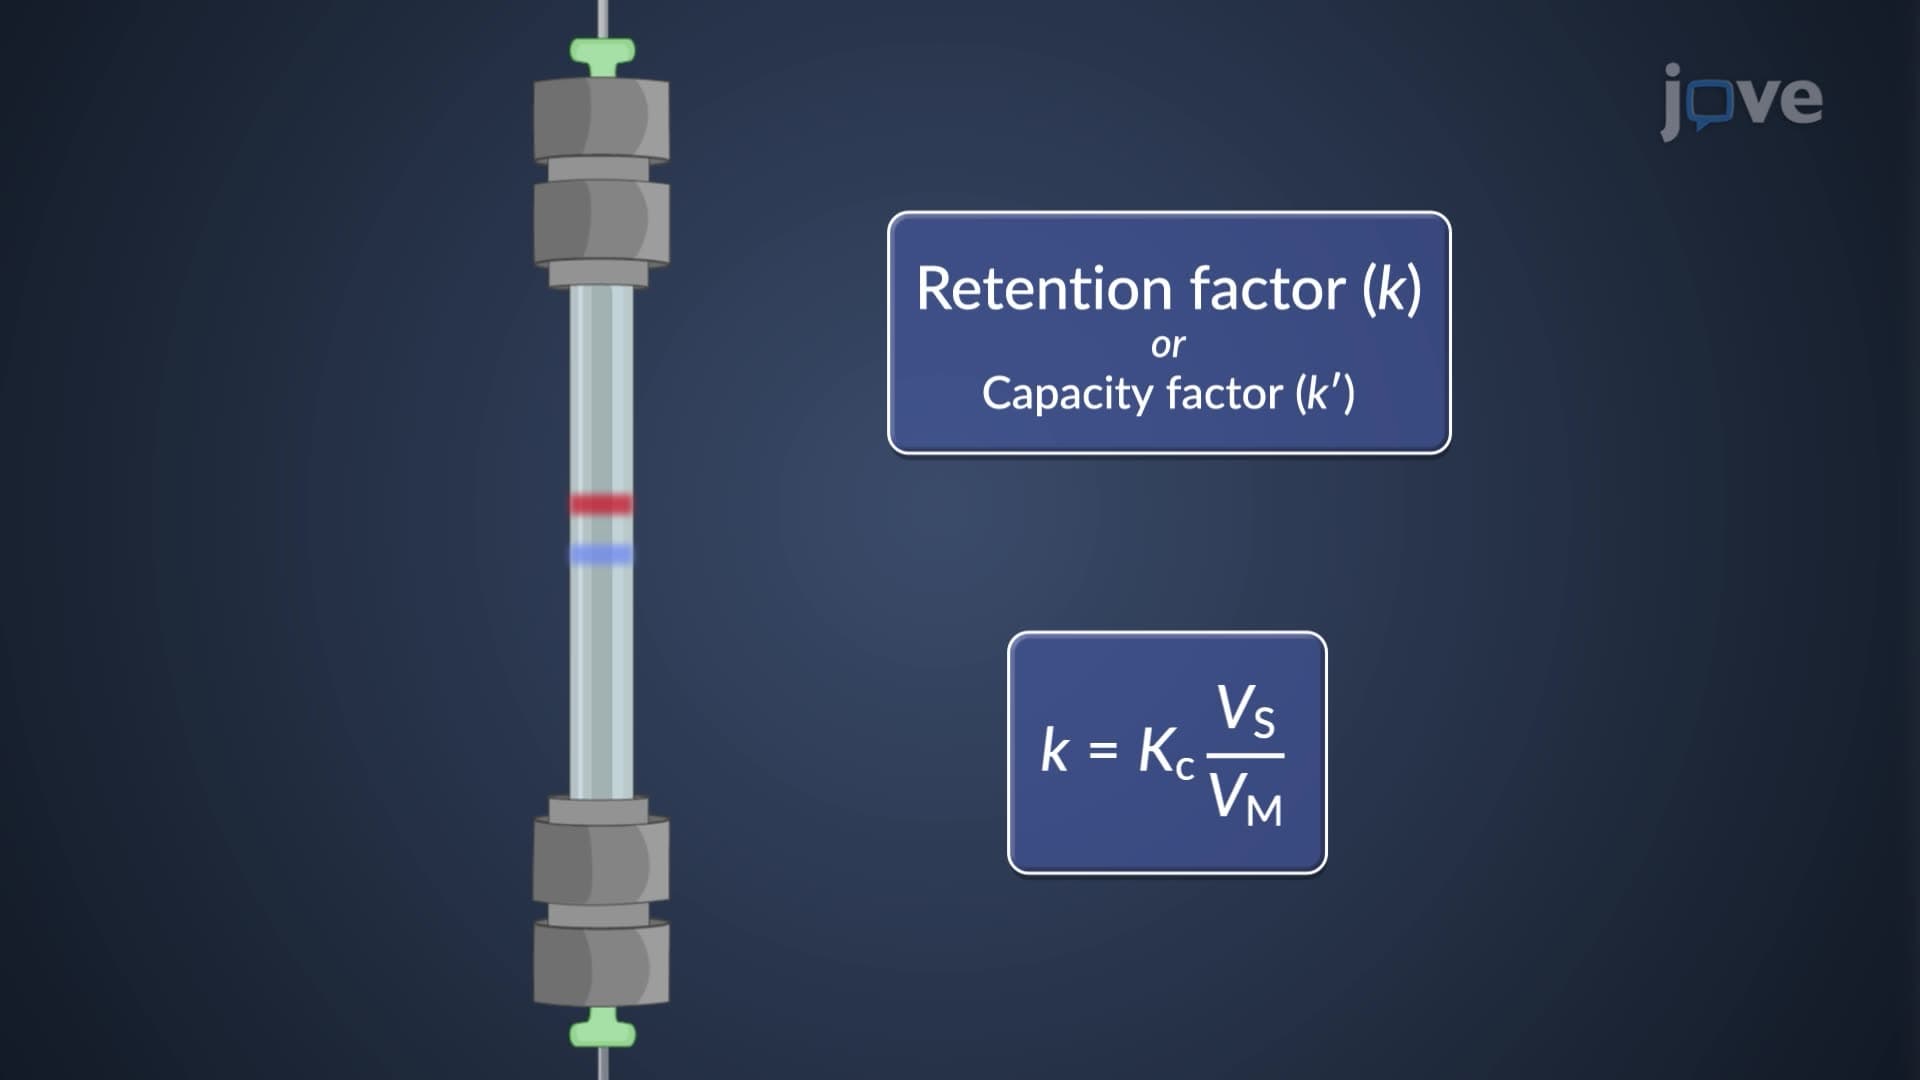
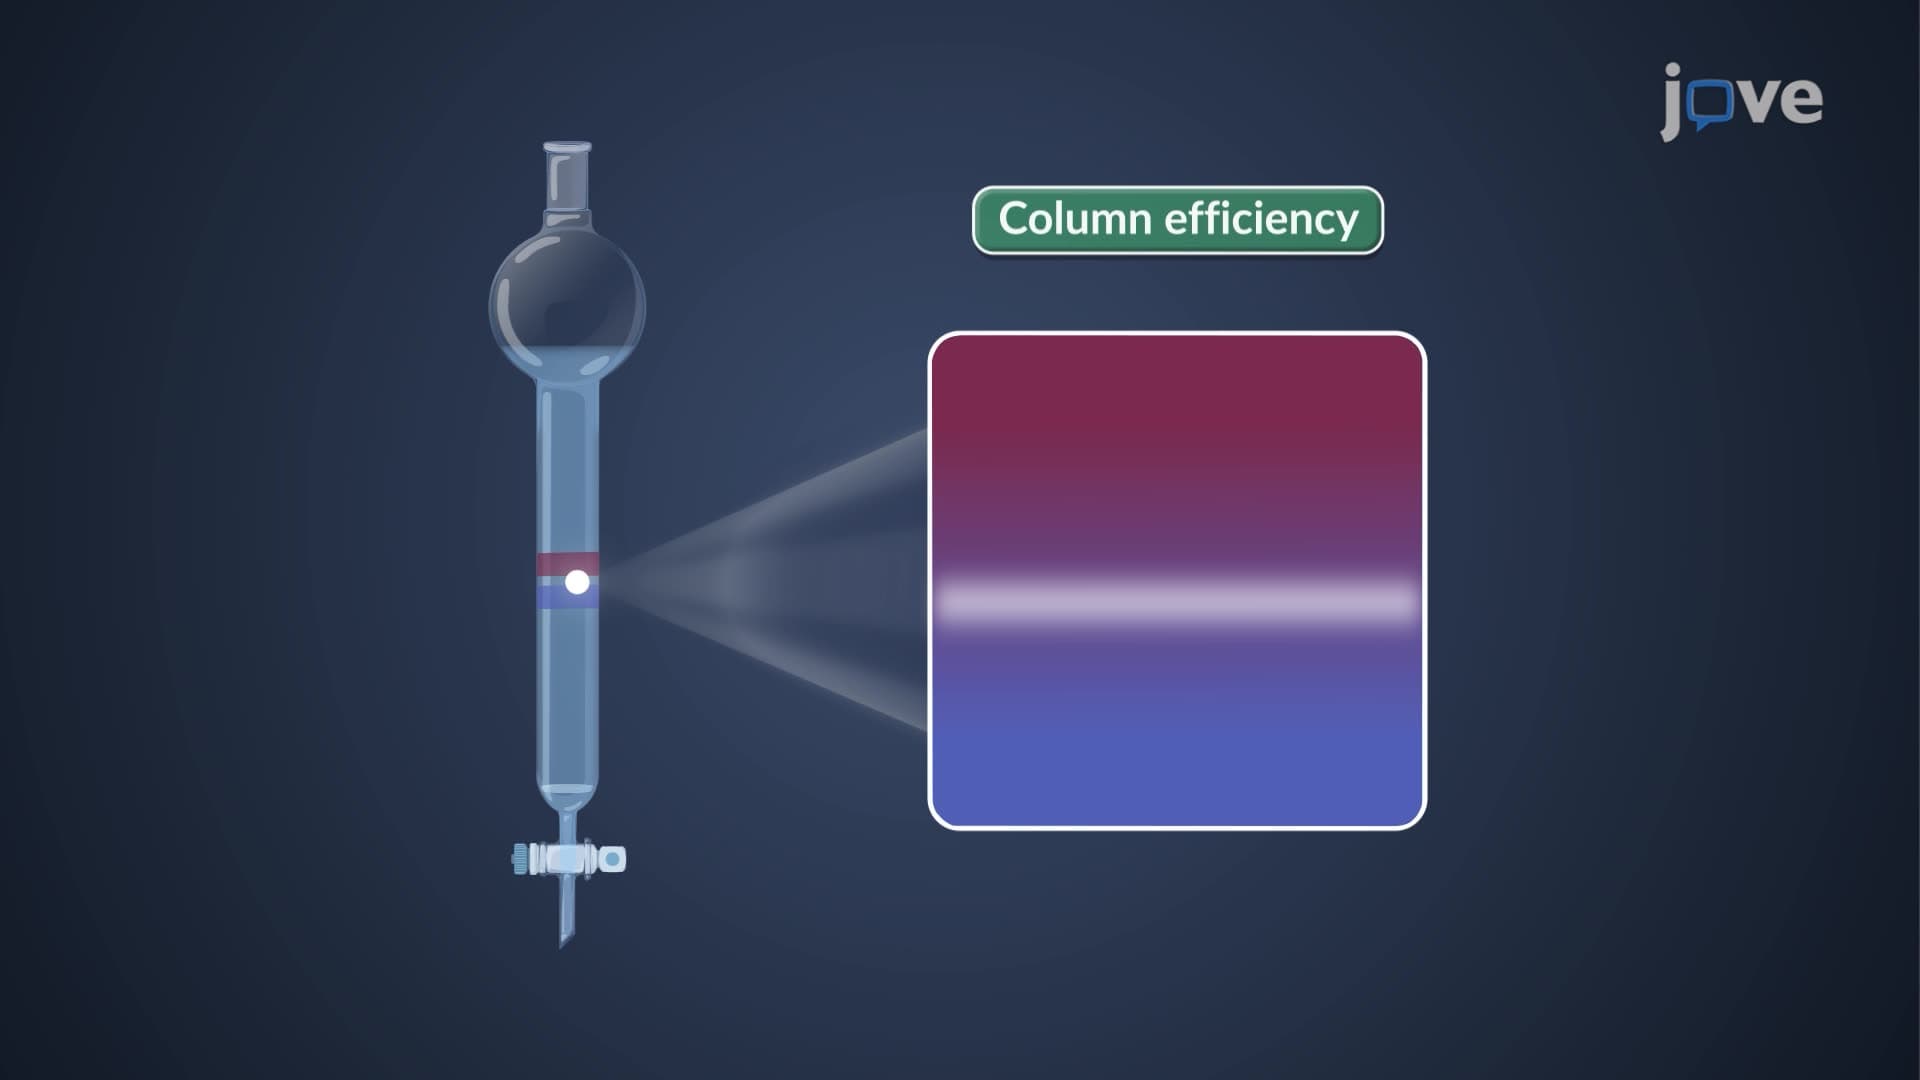
The resolution selectivity efficiency connection appears in the master resolution equation (Purnell equation): Rs = (1/4) × √N × (α-1)/α × k/(1+k). This relationship demonstrates how three factors control resolution: column efficiency (N), selectivity (α), and retention factor (k).
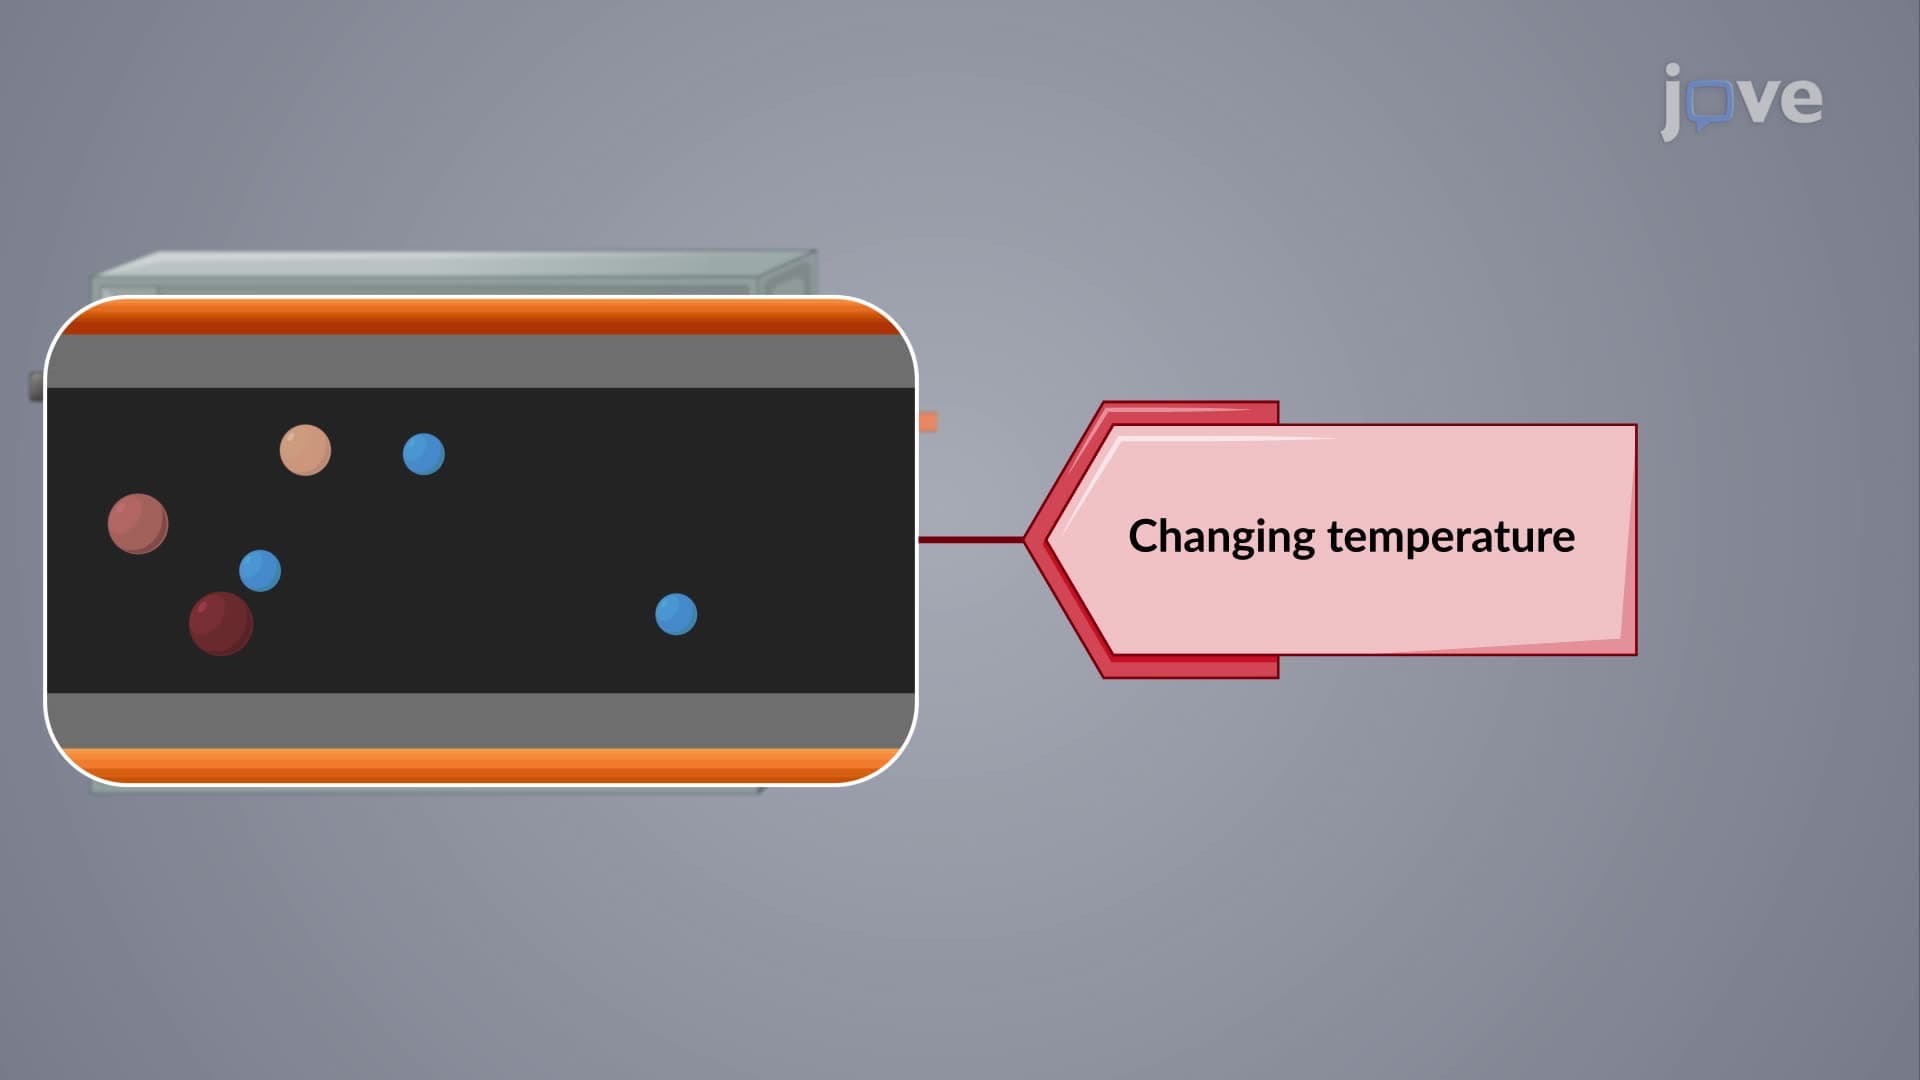
Pharmaceutical companies optimize these parameters when developing analytical methods for drug quality control. For instance, when Pfizer validates methods for COVID-19 treatments, they must achieve baseline resolution between the active pharmaceutical ingredient and potential impurities-a process requiring careful optimization of mobile phase composition, column selection, and temperature control.
Students encountering this concept in MCAT preparation should recognize that resolution optimization often involves trade-offs: increasing column length improves efficiency but lengthens analysis time, while adjusting mobile phase composition affects both selectivity and retention simultaneously.
Related Micro-courses