Loading video…


 17 Concepts
 11.7K views

Video Summary: What are Contaminants and Errors
Ever wonder why the EPA recalls millions of food products annually due to contamination? Understanding contaminants errors analytical chemistry is crucial when pharmaceutical companies like Pfizer analyze drug purity or when environmental labs test drinking water in California municipalities. Laboratory contamination can invalidate entire research studies, costing thousands of dollars and potentially endangering public health. What are Contaminants And Errors explores how sampling techniques introduce systematic biases and how statistical methods help quantify measurement reliability. Watch the full video on JoVE Coach to master this concept with expert-led visuals and step-by-step explanations.
Contaminants errors analytical chemistry represents a fundamental challenge in quantitative analysis that affects everything from pharmaceutical quality control to environmental monitoring. When the FDA tests drug batches or when university research labs analyze biological samples, understanding error sources becomes critical for valid conclusions. Contamination introduces false signals that can mask true analyte concentrations, while sampling errors create systematic biases that compromise data integrity.
Sources of contamination in laboratory environments are surprisingly diverse and often overlooked by beginning analysts. Cross-contamination occurs when residual analytes from previous samples interfere with current measurements-imagine testing blood glucose levels with equipment previously used for high-concentration standards. Airborne particulates from heating systems, cleaning chemicals from improperly rinsed glassware, and even skin oils from bare hands can introduce significant analytical errors.
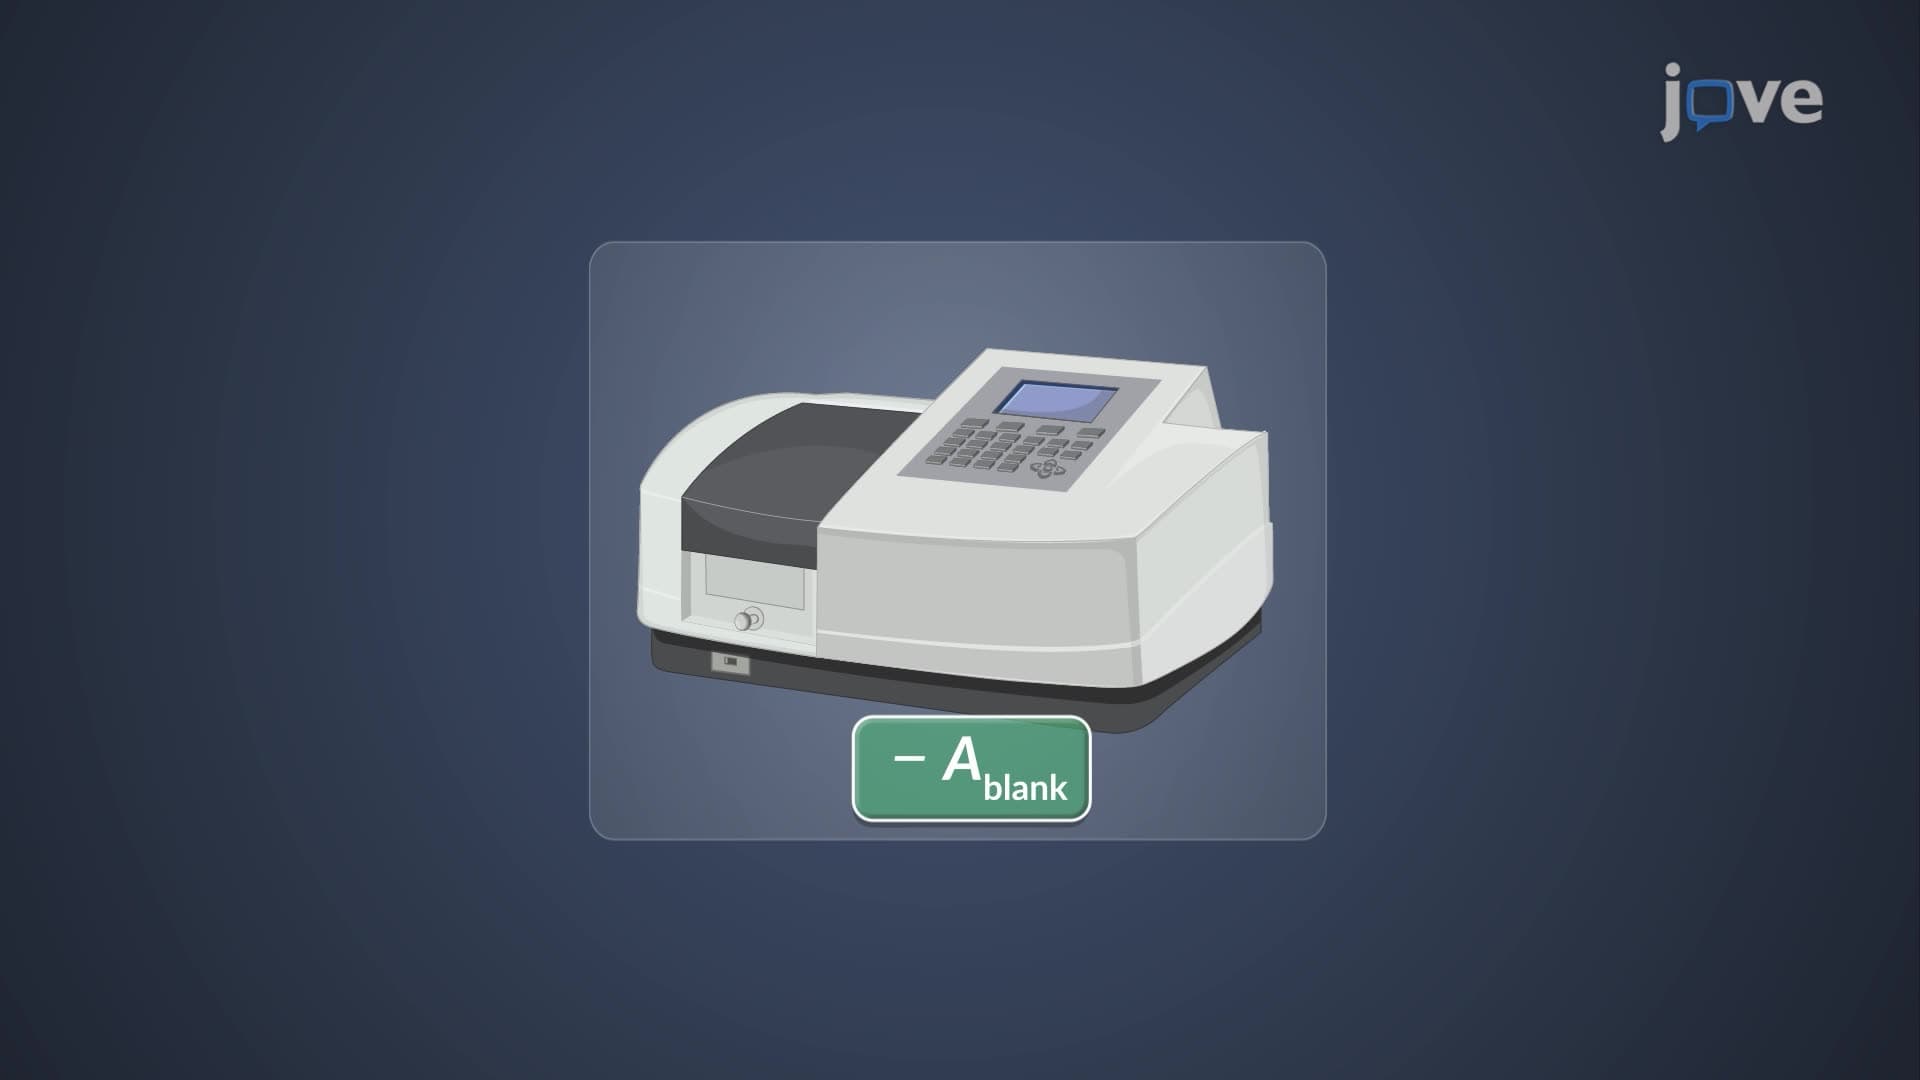
Blank contamination chemistry serves as a quality control measure where "blank" samples containing no target analyte are analyzed alongside real samples. If blanks show measurable signals, contamination is present. For example, when EPA labs test groundwater for heavy metals, blank samples help identify background contamination levels that must be subtracted from actual readings.
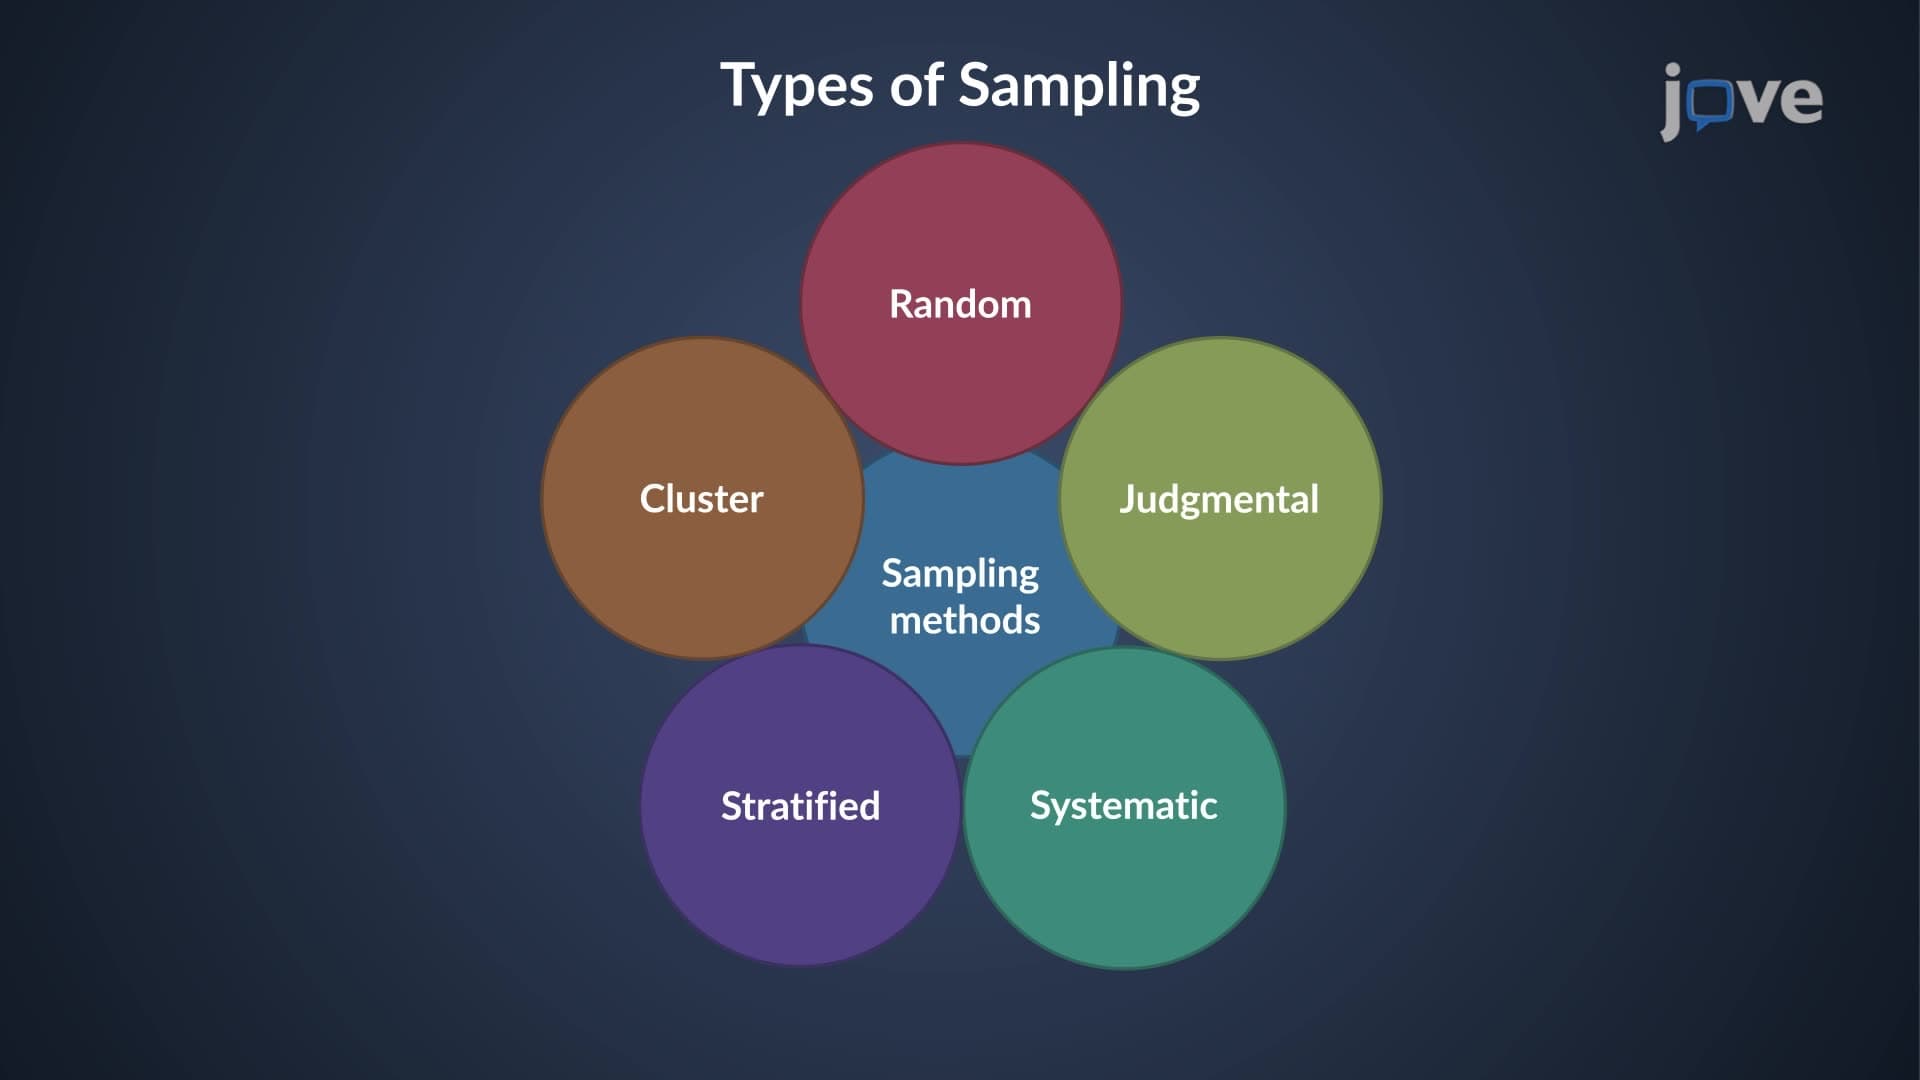
The confidence interval equation mentioned utilizes sample count (n) and sampling standard deviation (s) to establish measurement reliability boundaries. In practical terms, if a pharmaceutical company needs to verify that aspirin tablets contain 325 mg ± 5% active ingredient, they calculate the minimum number of tablets to test for statistical confidence. Students encountering this concept in AP Chemistry or college analytical chemistry courses should recognize that larger sample sizes reduce uncertainty but increase analysis costs-a real trade-off in industrial settings.
Total analytical variance combines two independent sources: method variance (instrumental precision, analyst technique) and sampling variance (how well samples represent the bulk material). Environmental consulting firms testing soil contamination must balance these factors-taking more soil samples improves sampling variance, while running multiple analyses per sample improves method variance. Understanding this distinction helps students tackle MCAT passages involving experimental design and data interpretation.
Related Micro-courses