Loading subject page…
- Statistics
- Distributions
- Degrees of Freedom
Micro-course: Distributions
70,000 views
Learn key concepts and earn your certificate.











Degrees of Freedom

00:00
01:02
Video Summary: What Is Degrees of Freedom
Ever wonder why your calculator asks for "n-1" when computing standard deviation? Degrees of freedom statistics reveals this mystery-it's the number of independent values that can vary freely in a calculation. Picture analyzing test scores from 30 students at Boston High School: once you know 29 scores and the class average, the final score is mathematically determined. This constraint creates 29 degrees of freedom, not 30. Understanding degrees of freedom in data analysis is crucial for accurate statistical testing and research validity. Watch the full video on JoVE Coach to master this concept with expert-led visuals and step-by-step explanations.
- Understand what is degrees of freedom and why it represents independent pieces of information in statistical calculations
- Identify how sample constraints reduce the number of freely varying values in data analysis
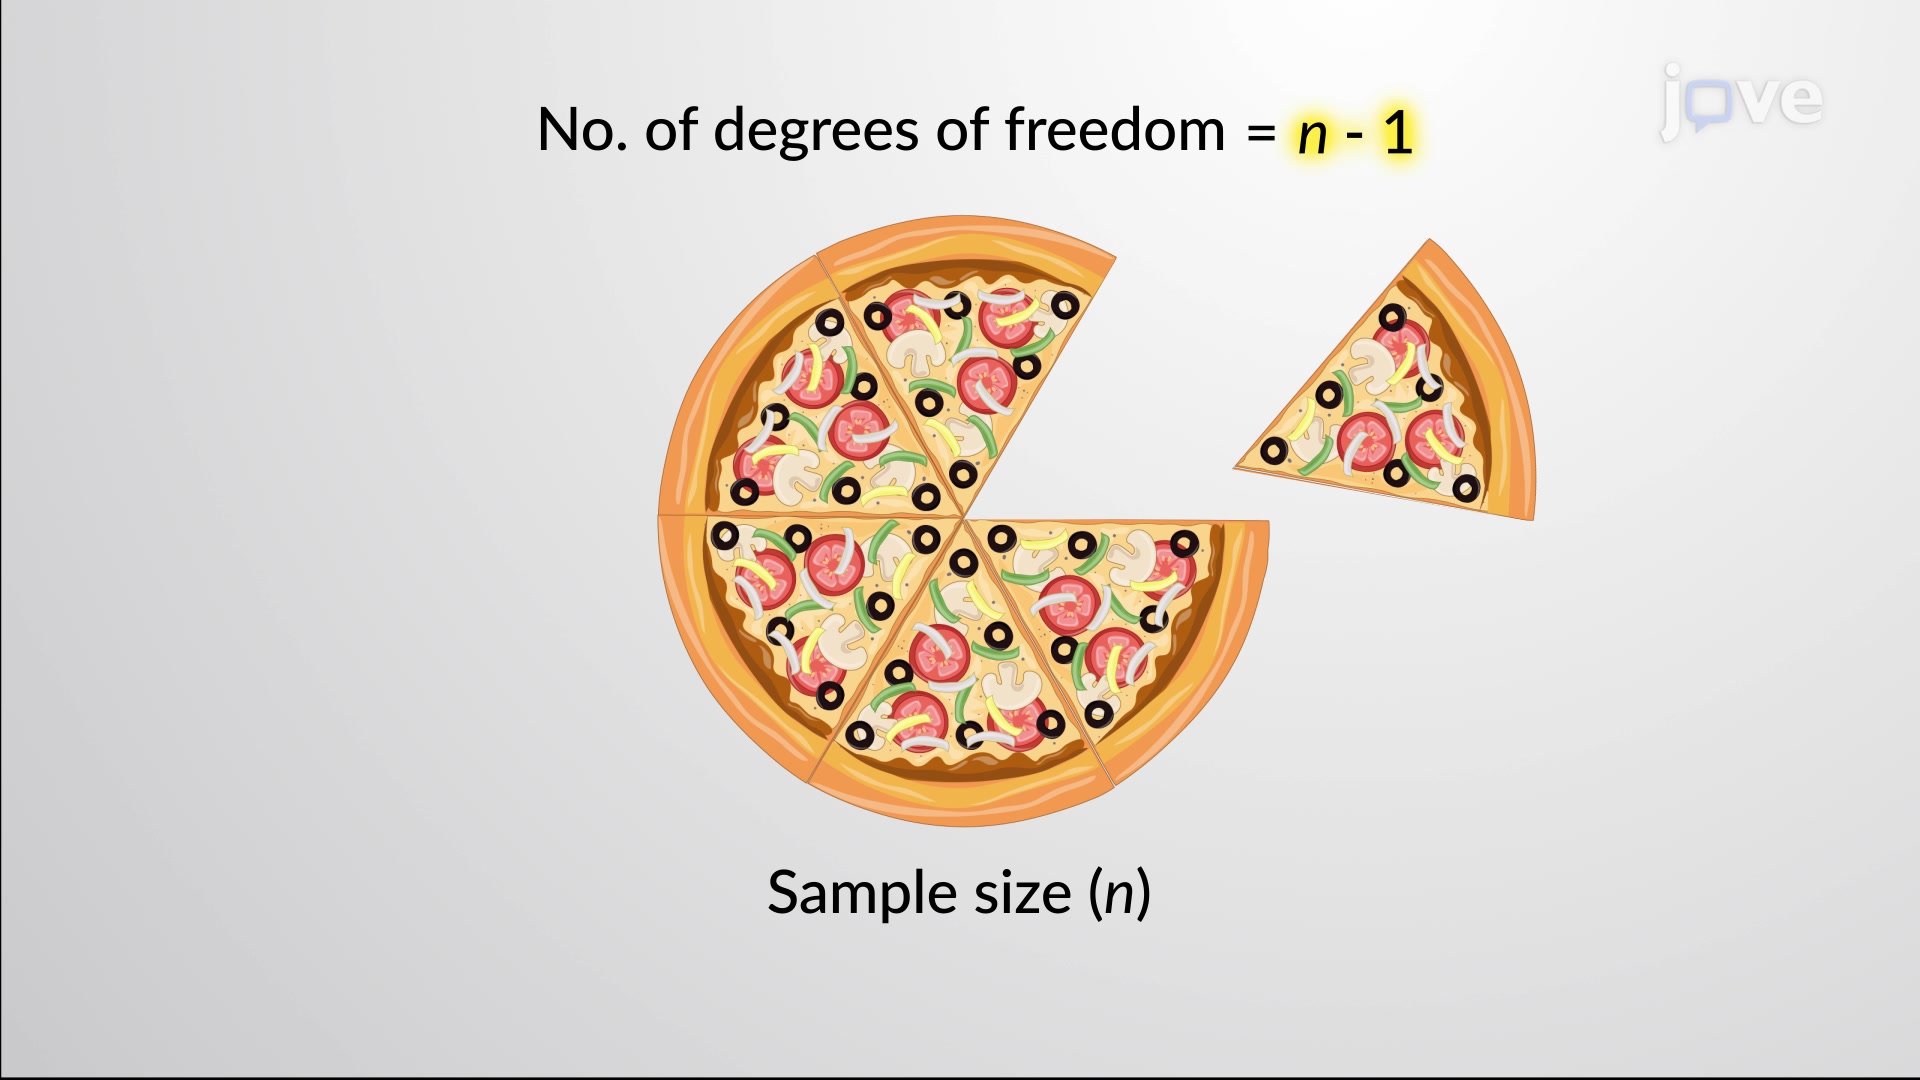
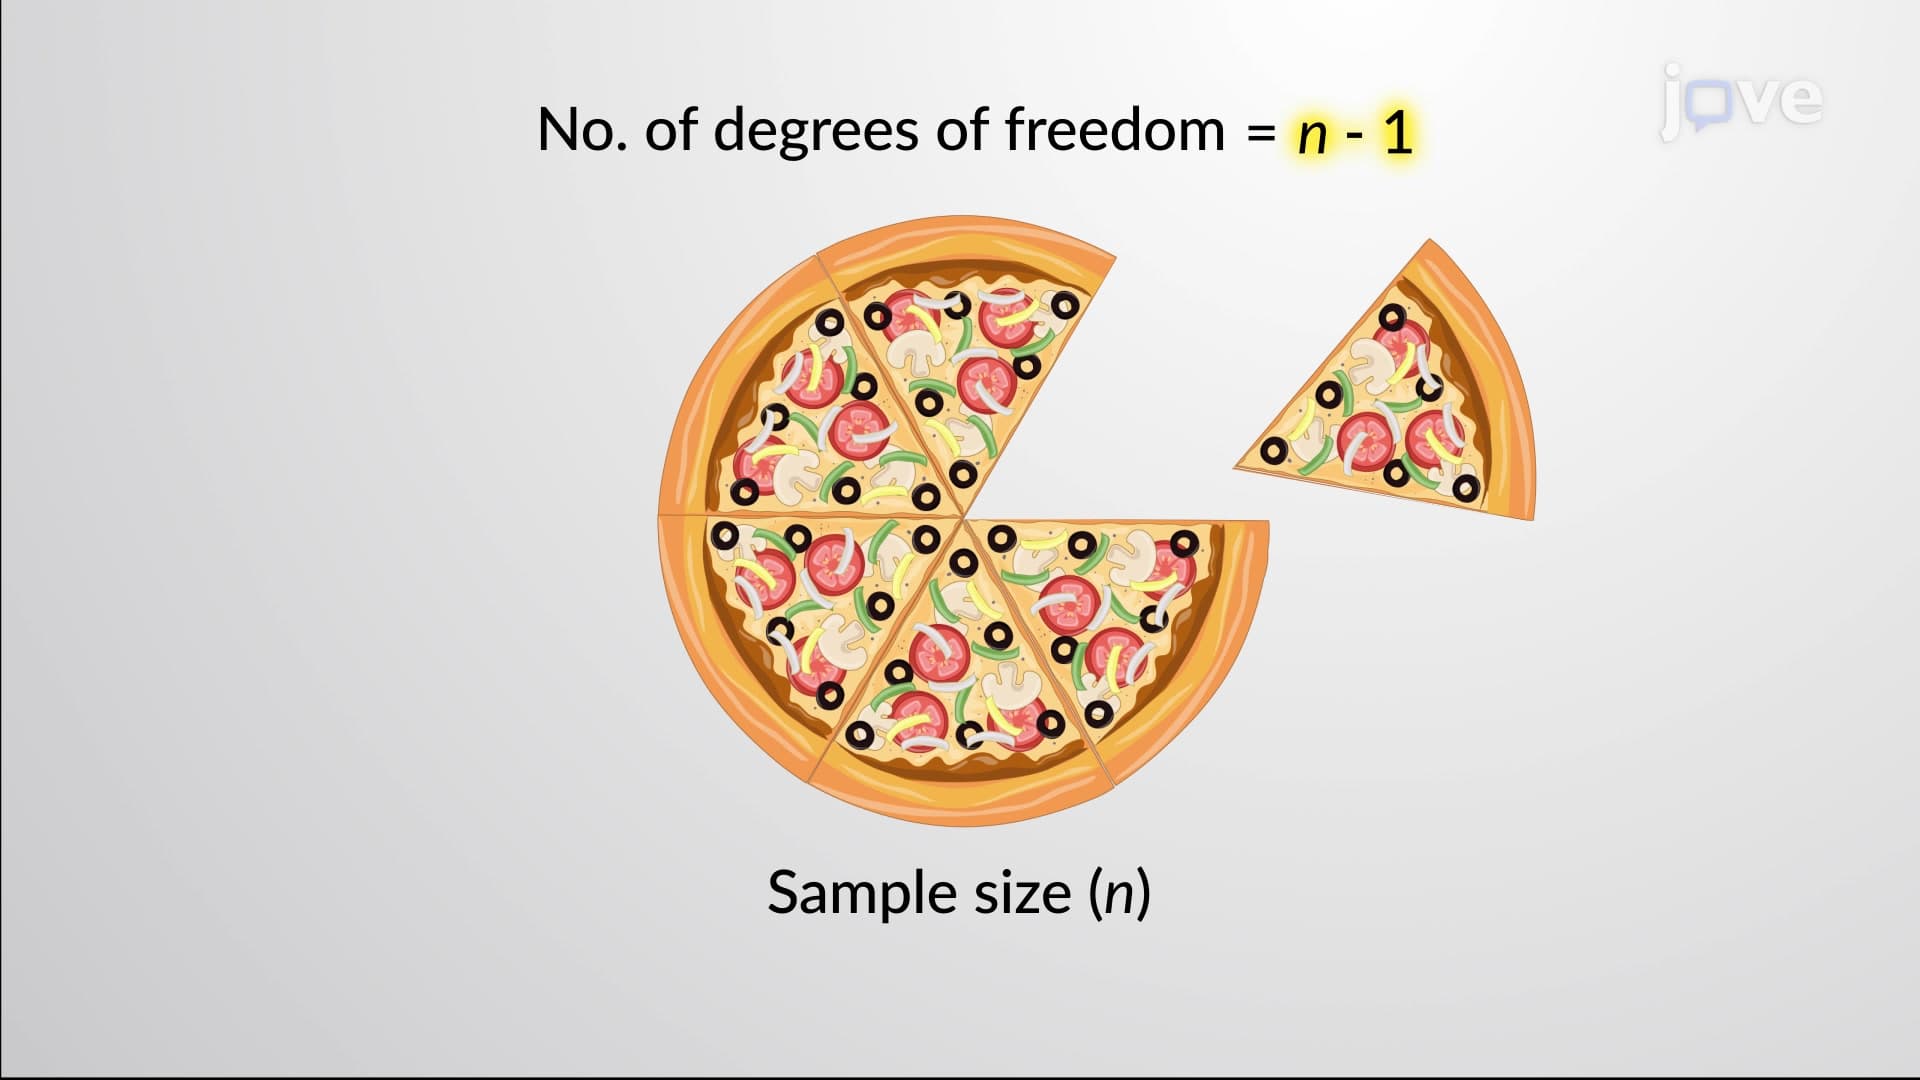
- Apply the fundamental formula: degrees of freedom equals sample size minus one (n-1) for basic statistical tests
- Analyze real-world scenarios where degrees of freedom impact statistical conclusions and hypothesis testing
- Recognize the critical role of degrees of freedom in t-tests, chi-square tests, and ANOVA calculations
- Evaluate how degrees of freedom affects the shape and critical values of statistical distributions
- Compare degrees of freedom requirements across different statistical tests and research designs
- Explore the connection between sample size, statistical power, and degrees of freedom in research planning
Understanding What is Degrees of Freedom in Statistical Context
Degrees of freedom statistics forms the mathematical backbone of inferential statistics, determining how much information is truly "free" to vary in your data. Think of it as the number of independent choices you can make before mathematical constraints lock in the remaining values. This concept directly impacts every statistical test you'll encounter in AP Statistics, college research methods, or standardized exams like the MCAT.
The Mathematical Foundation: Why n-1 Matters
The classic degrees of freedom formula emerges from a simple constraint: when you calculate a sample mean, you lose one degree of freedom. Consider SAT math scores from 25 students at UCLA. Once you know 24 scores and the sample mean (say, 650), the 25th score is completely determined-it must be whatever value makes the mean equal 650. This constraint means you have 24 degrees of freedom, not 25.
This principle extends beyond means to other statistics. When calculating sample variance or standard deviation, you're measuring how far each data point deviates from the sample mean. Since the sample mean itself was calculated from your data, those deviations aren't completely independent-they must sum to zero. This dependency costs you one degree of freedom, explaining why sample variance divides by (n-1) instead of n.
Degrees of Freedom in Hypothesis Testing Applications
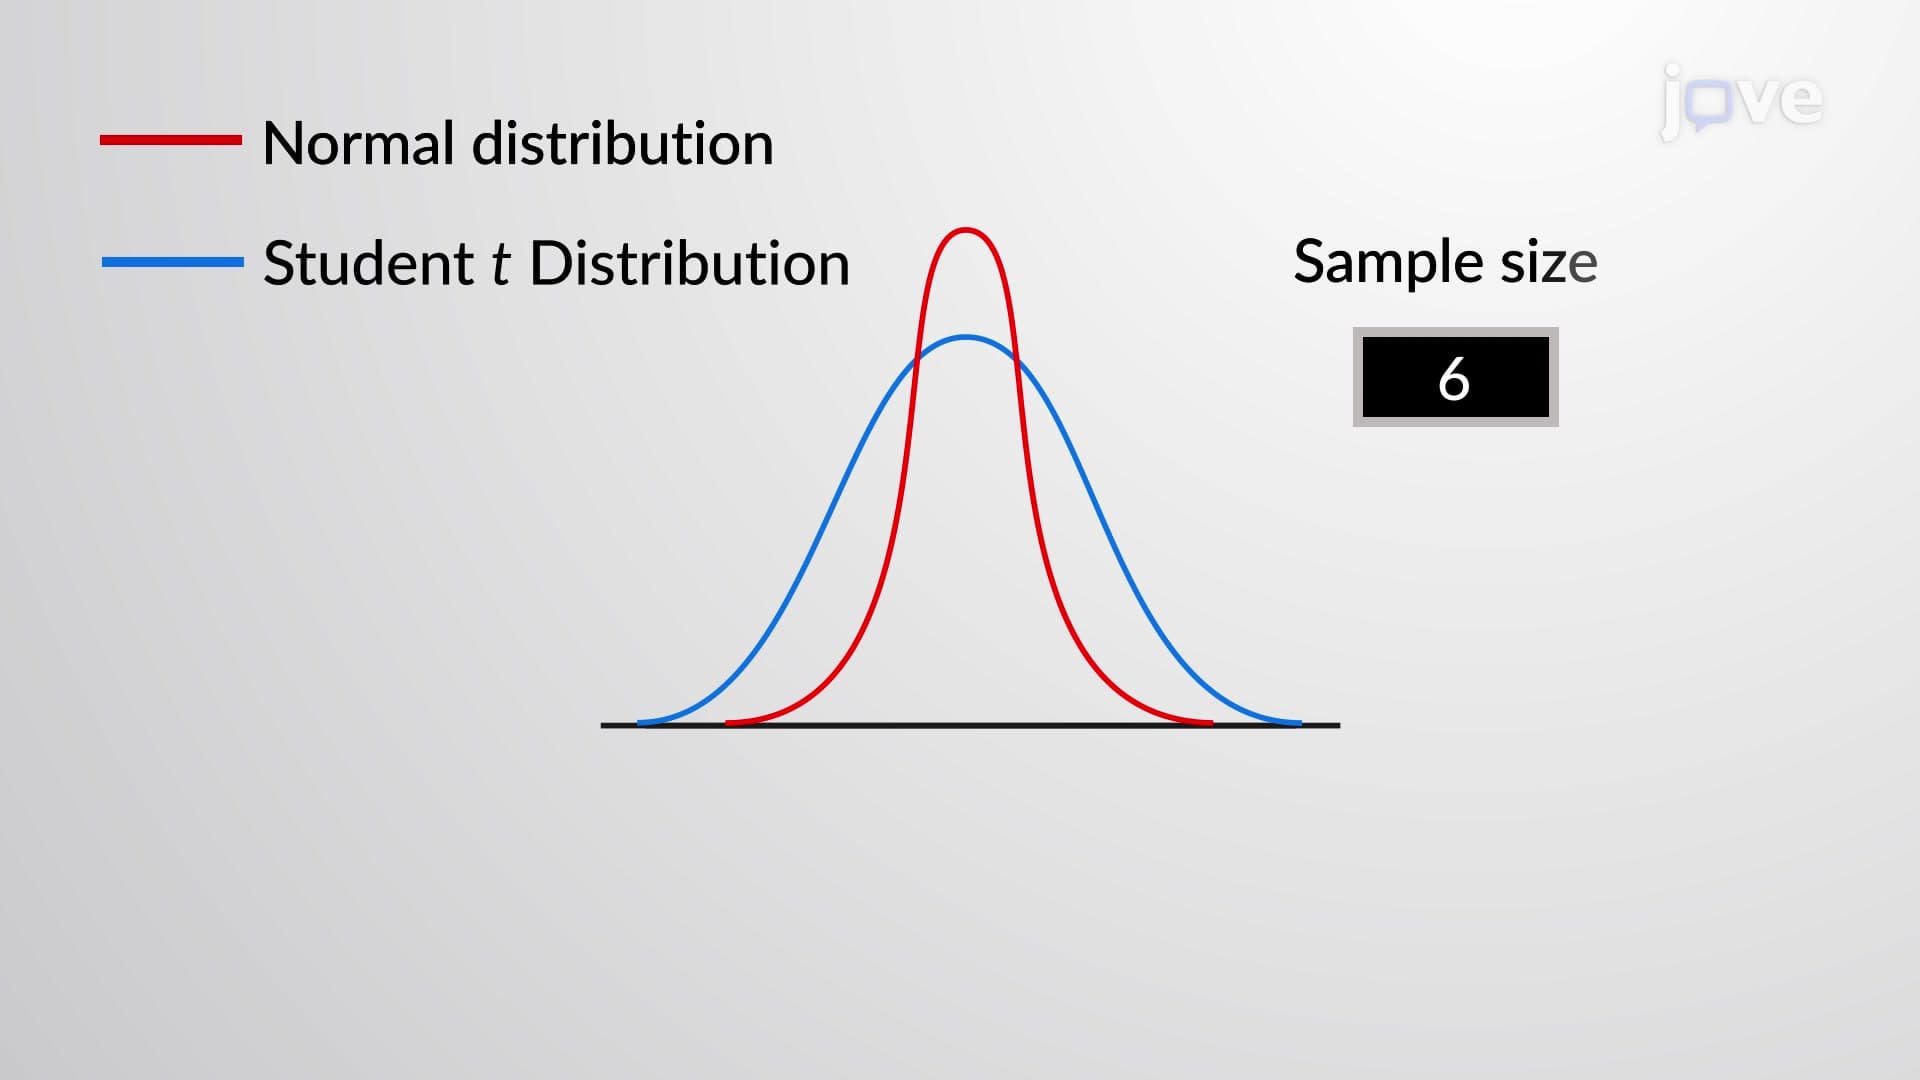
Degrees of freedom in data analysis becomes critical when selecting appropriate test statistics and critical values. In a one-sample t-test examining whether Stanford medical students score differently than the national average on the MCAT, your degrees of freedom equal your sample size minus one. This df value determines which t-distribution curve to use-fewer degrees of freedom create wider, more conservative distributions that require larger test statistics to reach significance.
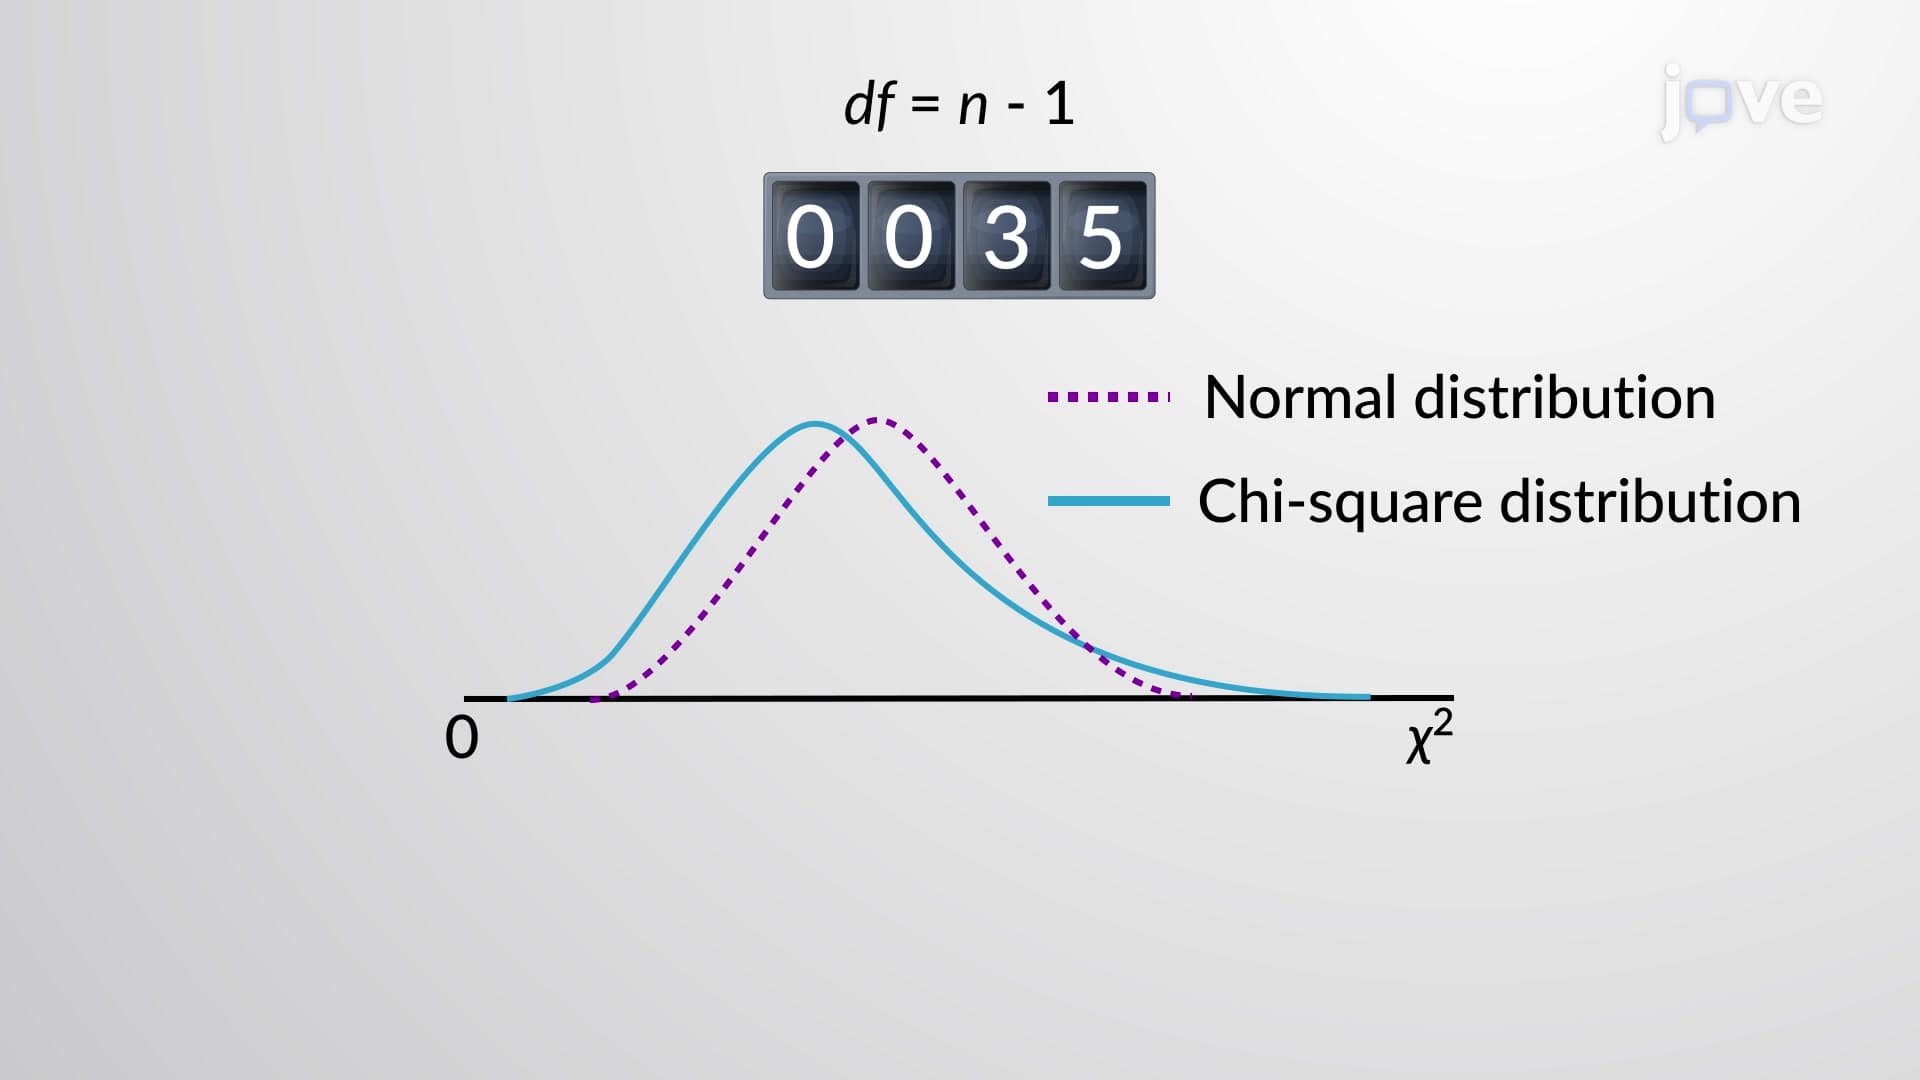
Chi-square degrees of freedom follow different rules depending on your analysis. For a goodness-of-fit test examining whether college major preferences at Harvard match national trends across 5 categories, you'd have 4 degrees of freedom (categories minus 1). For independence tests in contingency tables, multiply (rows-1) × (columns-1) to find your degrees of freedom.
Practical Applications in Academic and Professional Settings
Understanding how to calculate degrees of freedom proves essential for interpreting research in psychology, biology, economics, and medicine. When reading peer-reviewed studies or conducting your own research for AP courses, degrees of freedom appear in every statistical test result. They determine whether findings are statistically significant and influence confidence interval widths-more degrees of freedom generally produce more precise estimates and narrower confidence intervals, assuming adequate sample sizes and proper experimental design.
Frequently Asked Questions
Degrees of freedom represents the number of independent values that can vary freely in a statistical calculation before mathematical constraints determine the remaining values. It's typically calculated as sample size minus the number of parameters estimated from that sample. This concept ensures accurate statistical testing and proper interpretation of results.
AP Statistics frequently tests degrees of freedom in t-tests, chi-square tests, and confidence intervals. You'll need to identify the correct df for given scenarios, use df to find critical values from tables, and interpret computer output showing degrees of freedom. Practice calculating df for one-sample t-tests (n-1), two-sample t-tests, and chi-square tests.
The MCAT tests your ability to interpret medical research and understand statistical validity in clinical studies. Degrees of freedom directly impacts p-values, confidence intervals, and effect sizes in medical research. Knowing how to identify correct degrees of freedom helps you evaluate whether study conclusions are statistically sound and clinically meaningful.
For one-sample t-tests: df = n-1. For two-sample t-tests: df depends on whether variances are equal (pooled or unpooled formulas). For chi-square goodness-of-fit: df = categories-1. For chi-square independence tests: df = (rows-1)(columns-1). For ANOVA: df varies by source (between groups, within groups, total).
Consider a clinical trial testing a new diabetes medication at Johns Hopkins with 150 patients. When analyzing blood glucose changes using a t-test, researchers use 149 degrees of freedom (150-1). This df value determines the critical t-value needed for statistical significance and affects the width of confidence intervals around the treatment effect.
No, degrees of freedom builds on basic algebra and requires no calculus knowledge. If you understand means, standard deviation, and basic statistical concepts from Algebra II or Statistics, you can master degrees of freedom. The key is recognizing how mathematical constraints reduce the number of freely varying values in calculations.
Focus on understanding the logic rather than pure memorization. Remember that degrees of freedom equals the number of independent pieces of information available for estimation. Practice with varied scenarios, create concept maps linking df to specific tests, and use mnemonics like "subtract what you estimate" (sample mean costs 1 df, so n-1).
Advance to sampling distributions, Central Limit Theorem, and hypothesis testing procedures. Explore how degrees of freedom connects to statistical power, effect sizes, and confidence interval interpretation. These concepts form the foundation for advanced statistics courses and research methodology in your major field of study.
Related Micro-courses