Loading subject page…

- Statistics
- Distributions
- Goodness-of-Fit Test
Micro-course: Distributions
70,000 views
Learn key concepts and earn your certificate.









Goodness-of-Fit Test


00:00
01:16
Video Summary: What Is Goodness of Fit Test
Ever wonder if the number of customers visiting your local Starbucks each weekday actually matches what the store expects? A goodness of fit test determines whether observed data patterns align with theoretical expectations by comparing frequencies across categories. For instance, McDonald's might use this statistical method to verify if actual customer traffic on weekdays matches their predicted distribution for staffing decisions. This fundamental concept in statistics helps researchers and businesses validate their assumptions about data patterns. Watch the full video on JoVE Coach to master this concept with expert-led visuals and step-by-step explanations.
- Understand what a goodness of fit test measures and when to apply this statistical method in research scenarios
- Identify the essential requirements for conducting a valid goodness of fit test, including sample size and data collection methods
- Analyze the chi-square test statistic formula and interpret its components for hypothesis testing
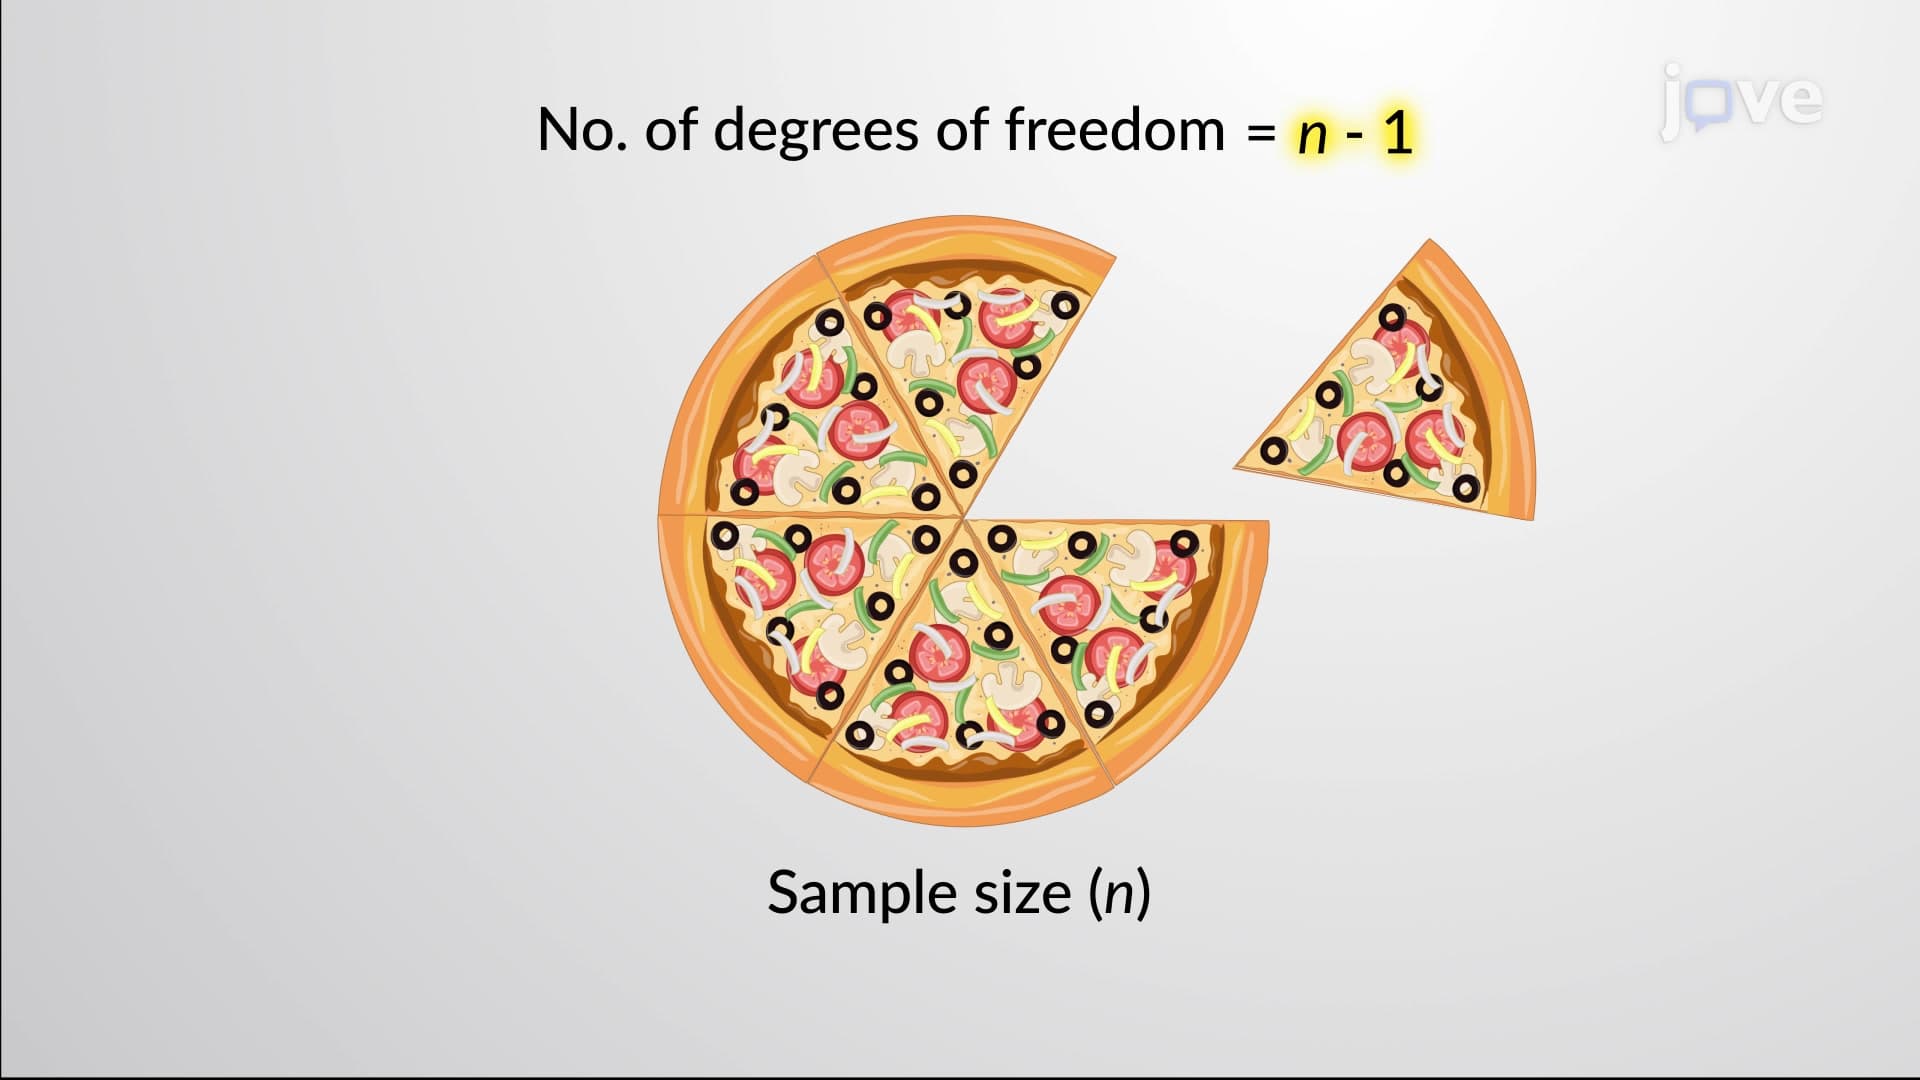
- Apply the concept of degrees of freedom in goodness of fit calculations and understand why it equals k-1
- Recognize that goodness of fit hypothesis tests are always right-tailed and explain the statistical reasoning behind this characteristic
- Evaluate critical values and P-values to determine whether observed data fits expected distributions
- Compare observed versus expected frequencies using real-world examples from business and scientific research
- Explore practical applications of goodness of fit testing in quality control, market research, and experimental validation
Understanding the Goodness of Fit Test Foundation
The goodness of fit test serves as a fundamental statistical tool that answers a crucial question: does our observed data actually match what we theoretically expect? This hypothesis test becomes invaluable when researchers need to validate assumptions about population distributions or verify whether sample data supports theoretical models.
In practical terms, imagine Netflix analyzing viewing patterns across different days of the week. They might hypothesize that streaming activity follows a specific pattern, with higher usage on weekends. A goodness of fit test would statistically confirm whether actual viewing data aligns with this expected distribution.
Chi-Square Test Statistic and Mathematical Framework
The mathematical foundation relies on the chi-square test statistic: χ² = Σ[(O - E)²/E], where O represents observed frequencies and E represents expected frequencies. This formula essentially measures how far observed values deviate from expected values, with larger deviations producing higher chi-square statistics.
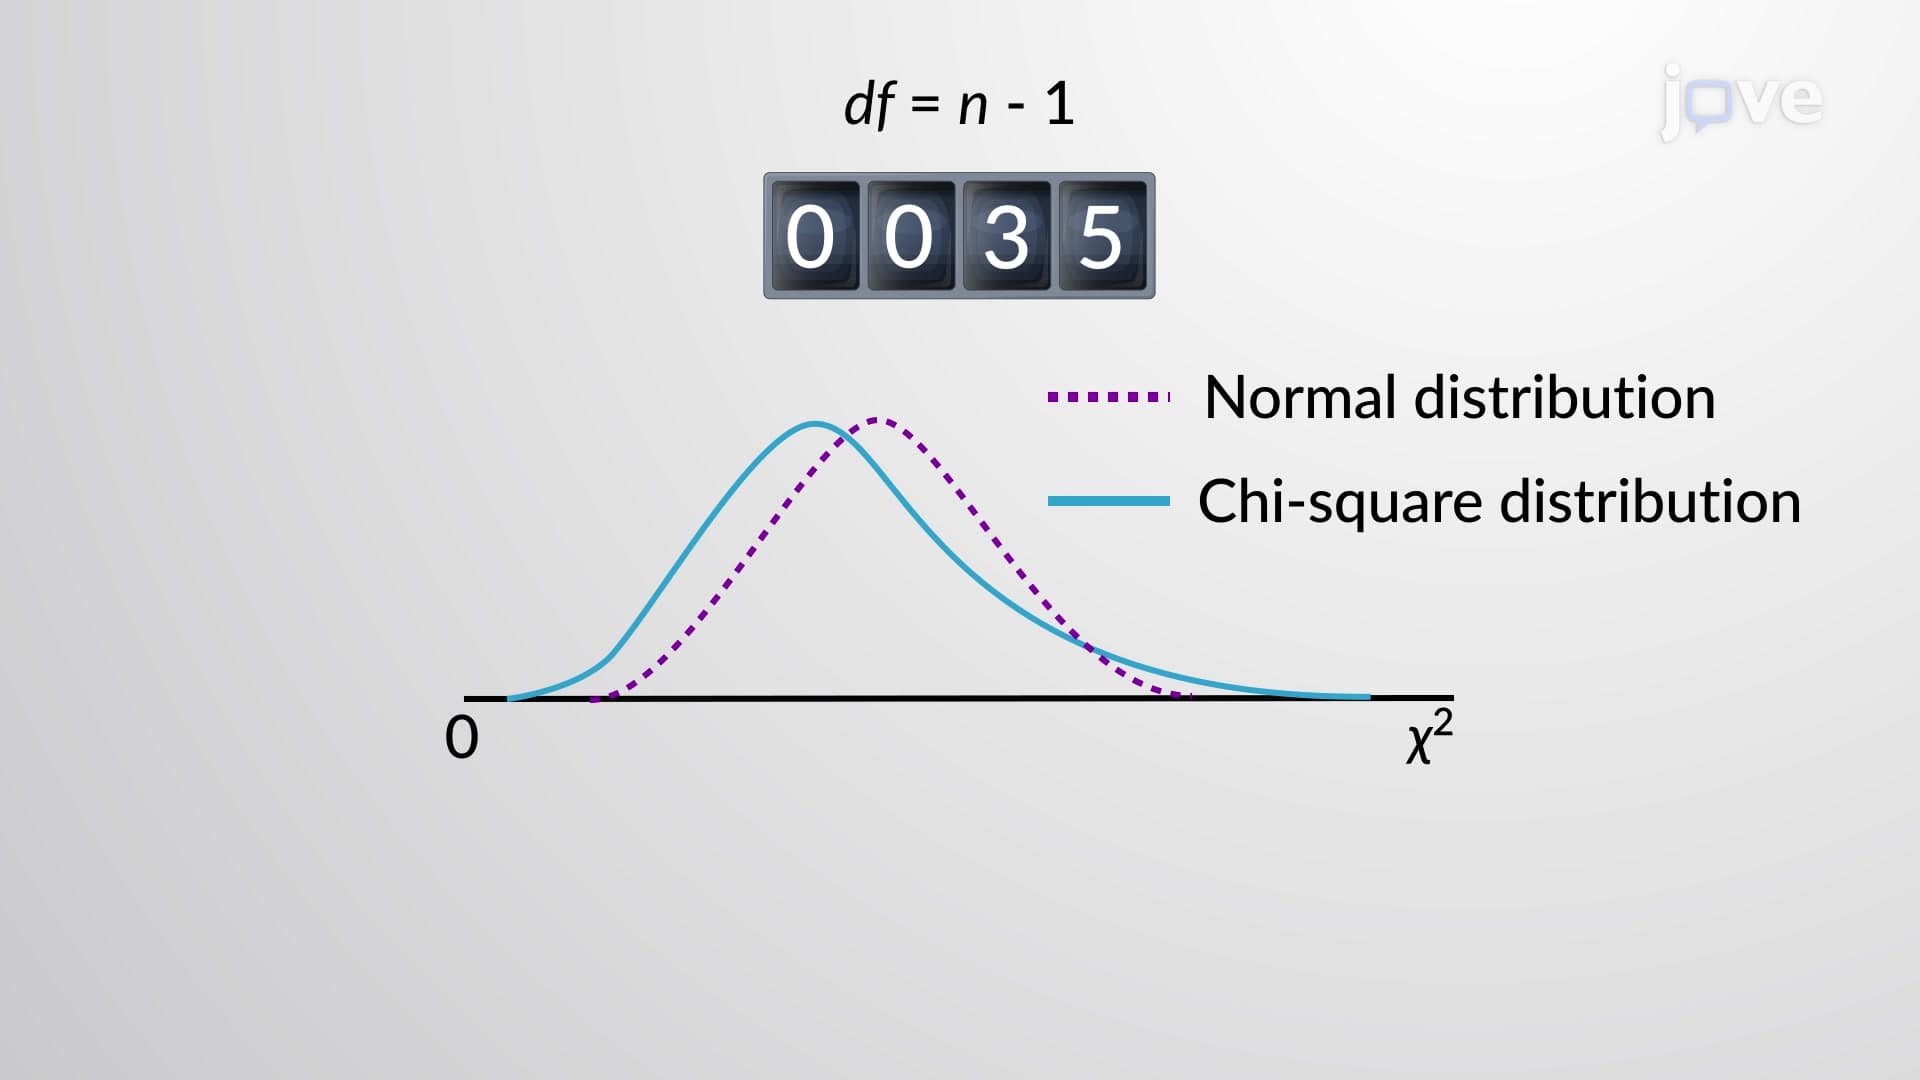
The degrees of freedom calculation (k-1, where k equals the number of categories) determines the appropriate chi-square distribution for comparison. For example, if analyzing customer traffic across five weekdays, the degrees of freedom would be 4. This concept frequently appears on AP Statistics exams and college-level statistics courses, making it essential for academic success.
Data Requirements and Test Assumptions
Valid goodness of fit testing requires specific conditions: random sampling, categorical data with frequency counts, and expected frequencies of at least 5 per category. These requirements ensure the chi-square approximation remains accurate and test results stay reliable.
Consider a hospital emergency department analyzing patient arrivals across different shifts. Before conducting the test, administrators must verify that arrival data was collected randomly and that each shift category expects at least 5 patients on average.
Right-Tailed Nature and Critical Value Interpretation
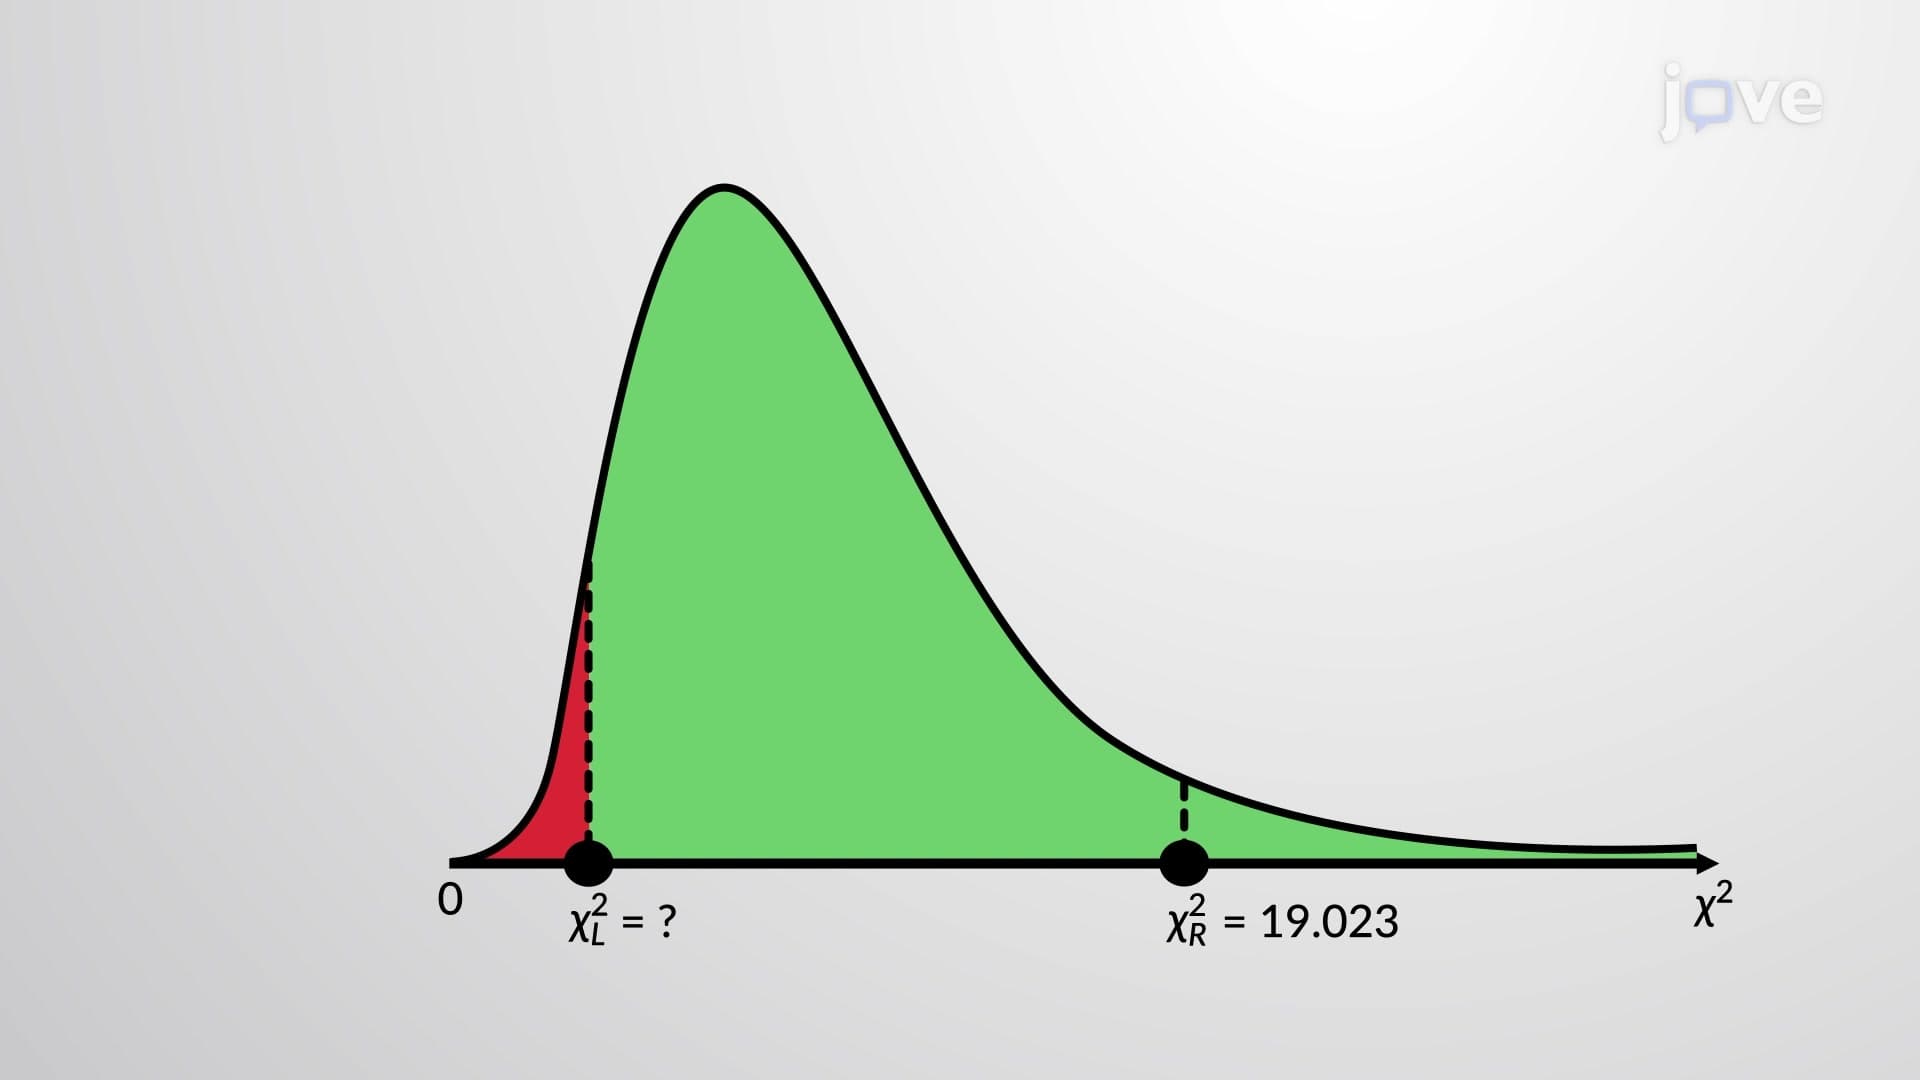
Goodness of fit tests are inherently right-tailed because the chi-square statistic only takes positive values, with larger values indicating worse fit between observed and expected data. The critical region always falls in the right tail of the chi-square distribution, making interpretation straightforward for students preparing for standardized tests like the MCAT or college statistics exams.
When P-values fall below the significance level (typically 0.05), we reject the null hypothesis and conclude that observed data doesn't fit the expected distribution. This interpretation skill proves crucial for success in undergraduate statistics courses and graduate school entrance exams.
Frequently Asked Questions
A goodness of fit test determines whether observed sample data matches a theoretical or expected distribution. Use it when you need to verify if your data follows a specific pattern, such as testing whether die rolls are truly random or if customer arrivals match expected scheduling patterns. This test appears frequently on AP Statistics exams and college statistics courses.
Exam questions typically provide observed and expected frequency tables, asking you to calculate the chi-square statistic and interpret P-values. You might encounter scenarios involving quality control testing, survey response patterns, or experimental outcome validation. Practice identifying when conditions are met and interpreting right-tailed test results.
Students often forget to check that expected frequencies equal at least 5 per category before proceeding with calculations. MCAT questions frequently include this requirement verification as part of the testing process. Always verify assumptions before applying the chi-square formula to avoid losing points on test day.
Amazon uses goodness of fit testing to verify whether actual package delivery times across different regions match their predicted delivery schedules. By comparing observed delivery frequencies with expected distributions, they can identify regions where service improvements are needed and adjust logistics accordingly.
No advanced math background is required beyond basic algebra and understanding of percentages. The chi-square formula involves simple arithmetic operations: subtraction, squaring, division, and addition. Most high school students can master this concept with practice, making it accessible for college-bound students.
Focus on practicing the step-by-step process: verify conditions, state hypotheses, calculate the test statistic, find degrees of freedom, and interpret P-values. Create formula sheets and work through multiple practice problems involving different scenarios. Understanding the right-tailed nature helps with critical value interpretation.
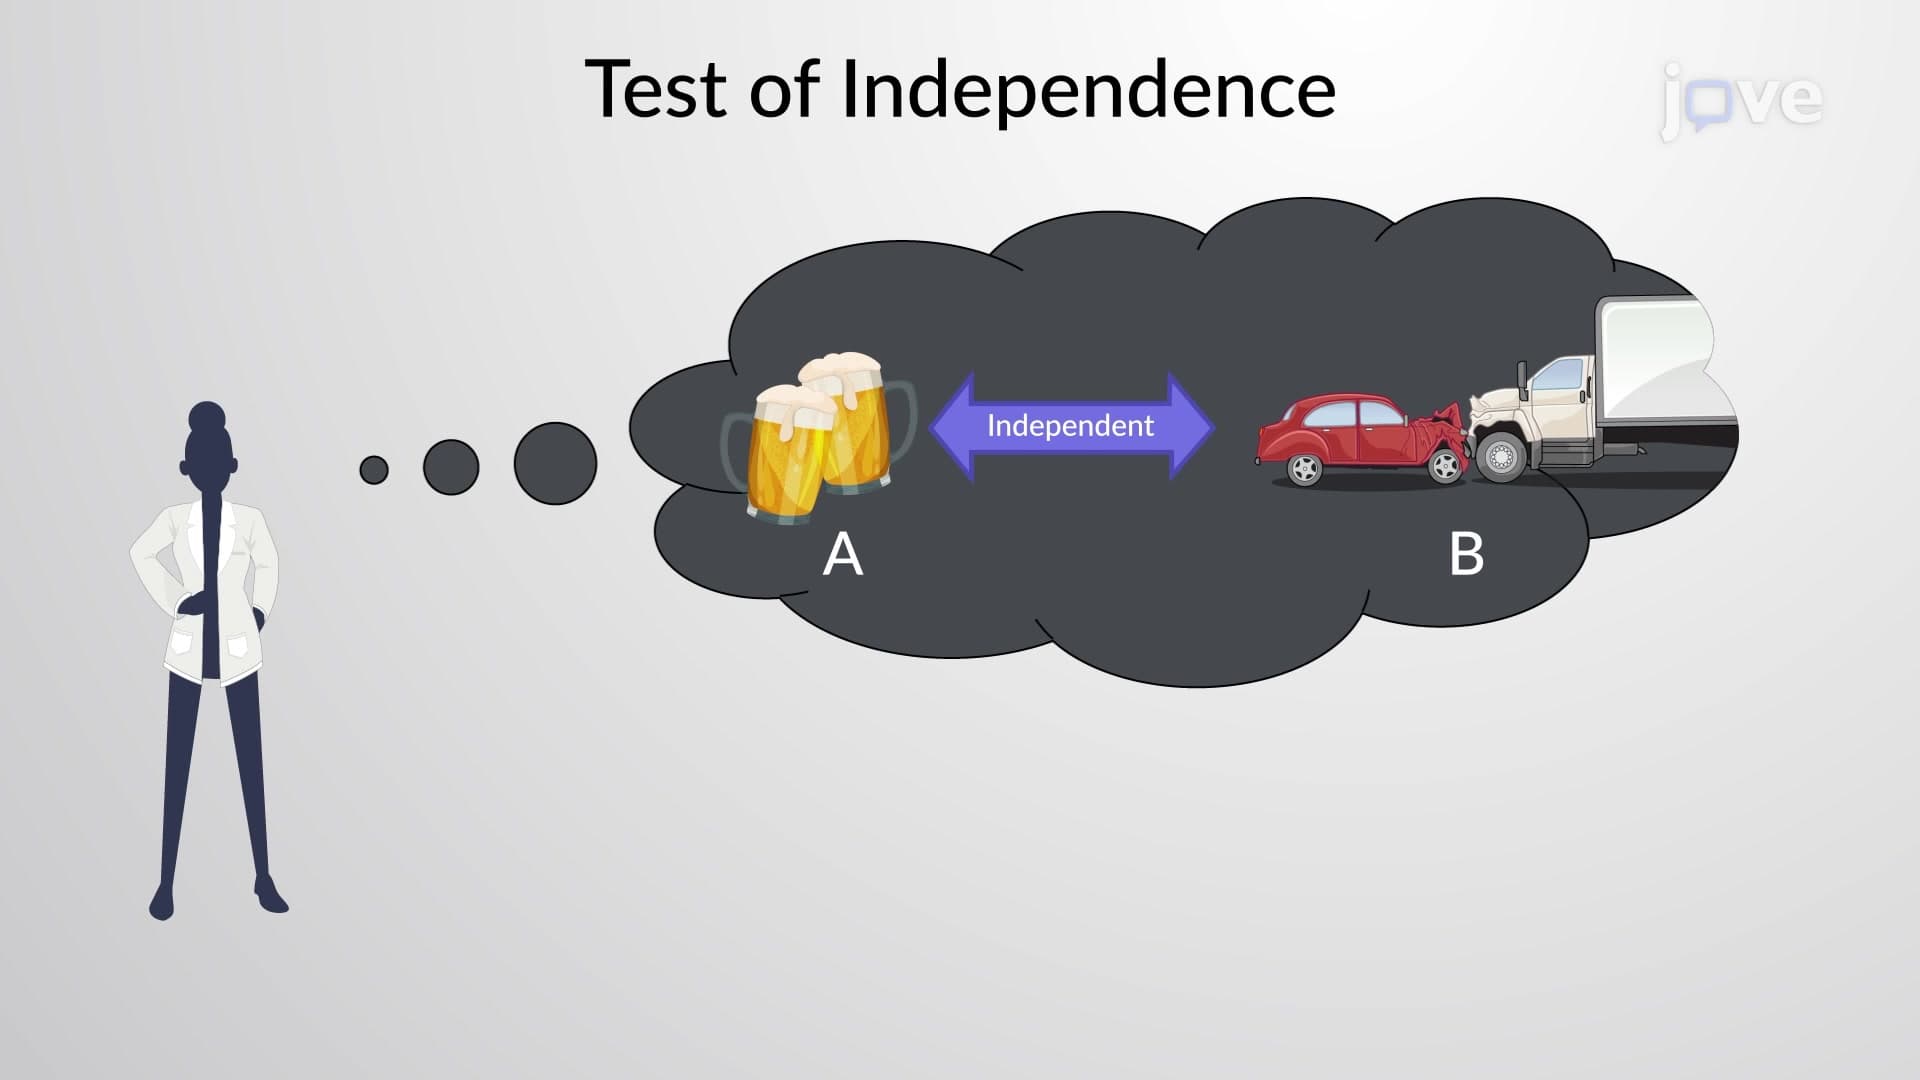
Goodness of fit testing provides the foundation for chi-square tests of independence and ANOVA procedures commonly covered in advanced statistics courses. Mastering this concept prepares you for graduate-level research methods and helps build confidence with hypothesis testing frameworks used throughout statistical analysis.
The chi-square test statistic can only be positive or zero, never negative, because it involves squared differences. Large positive values indicate poor fit between observed and expected data, while values near zero suggest good fit. This mathematical constraint naturally creates a right-tailed test where rejection occurs only for large chi-square values.
Related Micro-courses