Loading video…


 16 Concepts
 15.9K views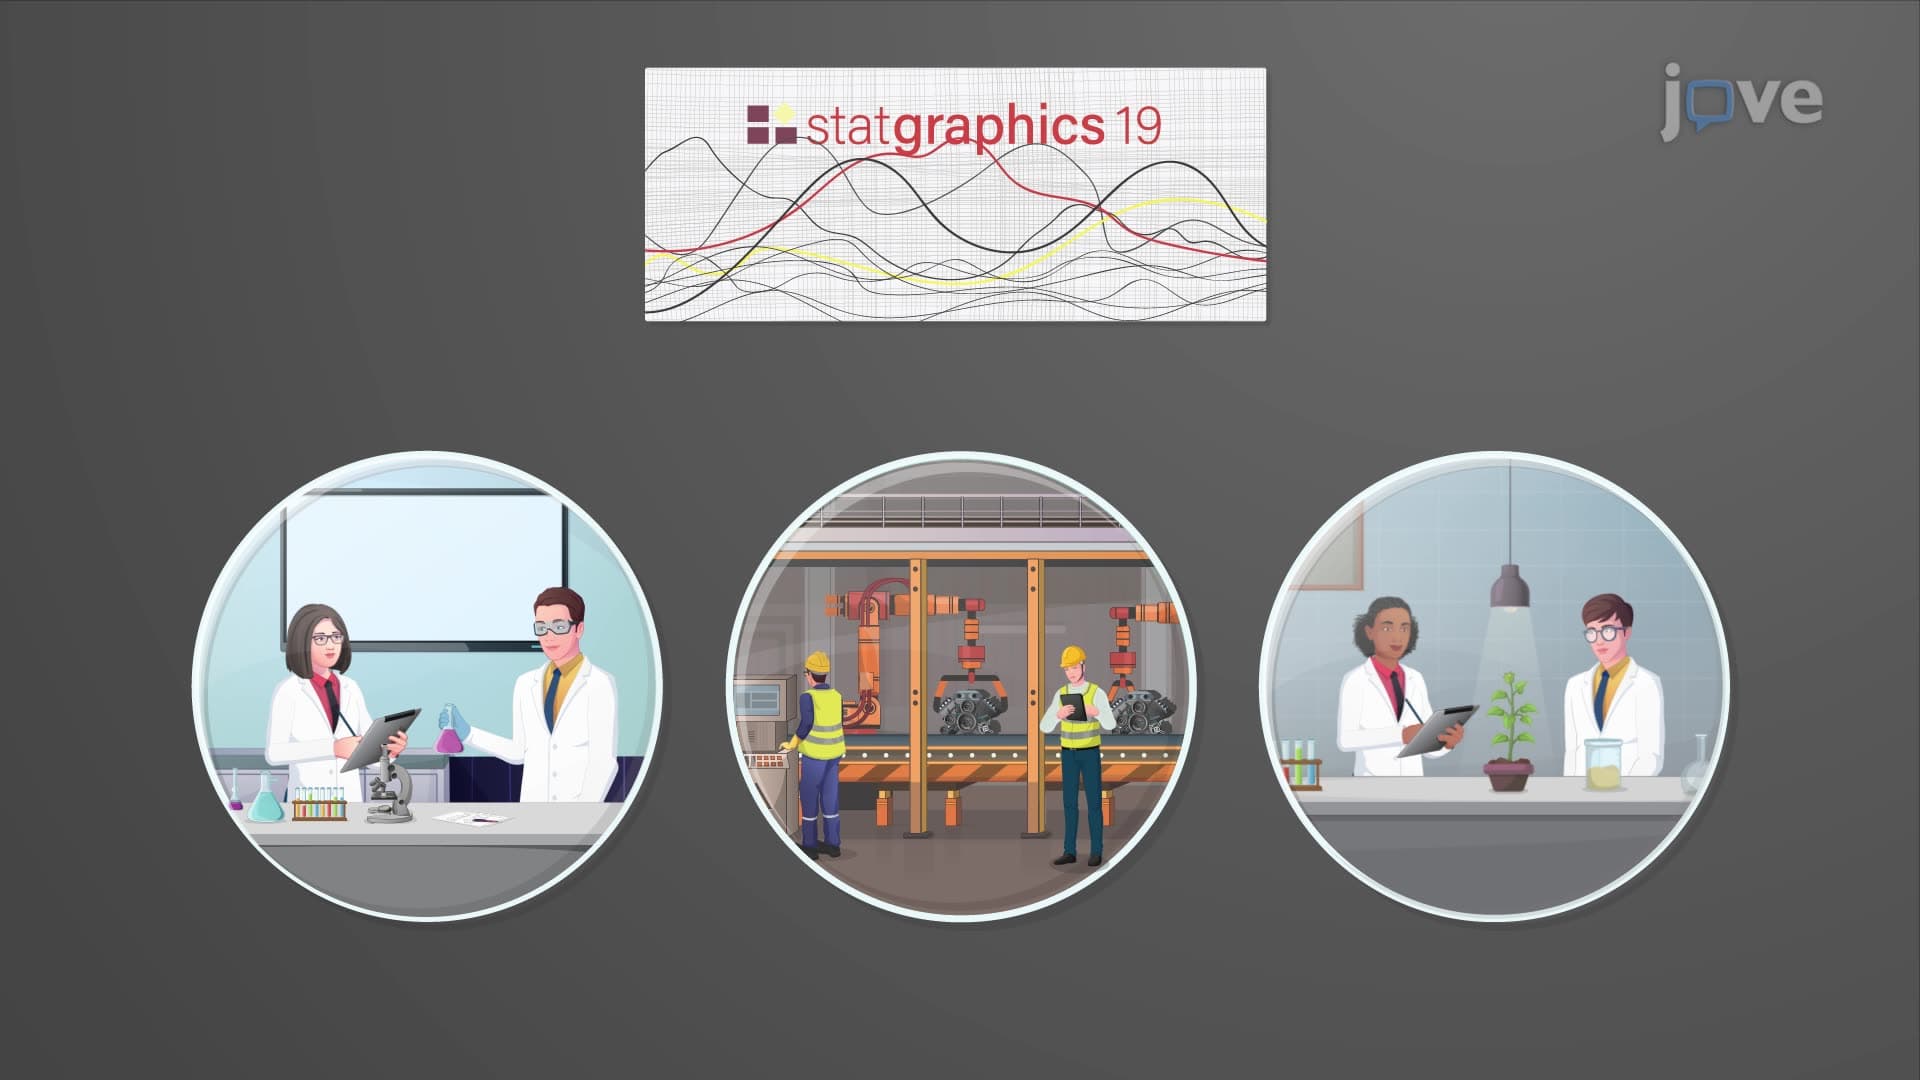

Video Summary: What Is Statgraphics
Did you know that a statistical software developed at Princeton University now powers quality control at major US automotive manufacturers like Ford and General Motors? Statgraphics is a comprehensive statistical software suite that transforms complex data analysis into accessible insights through advanced visualization tools and machine learning capabilities. From pharmaceutical research at companies like Pfizer to environmental studies conducted by the EPA, this powerful platform handles everything from basic statistics to sophisticated Six Sigma quality improvement initiatives. Watch the full video on JoVE Coach to master this concept with expert-led visuals and step-by-step explanations.
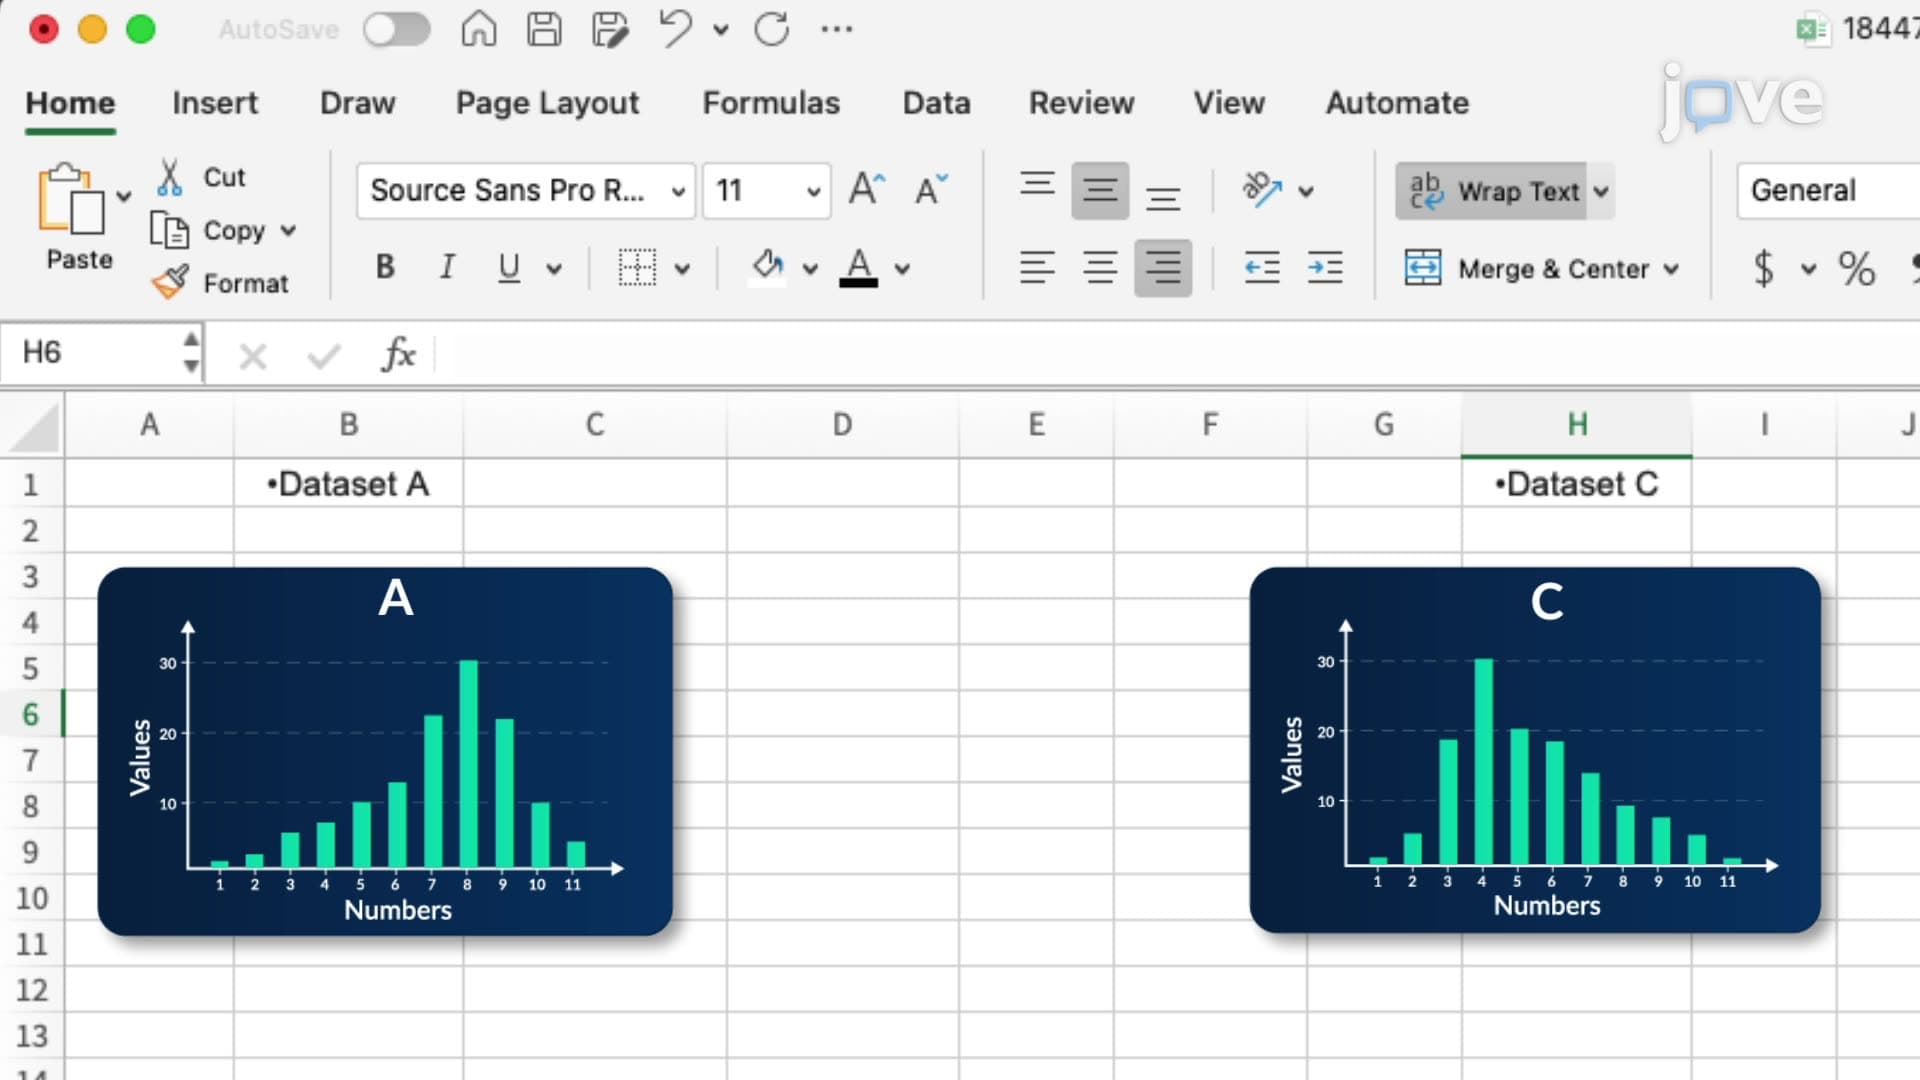
Statgraphics represents a sophisticated statistical software suite that emerged from Princeton University's academic environment in 1980, evolving into a powerful tool that bridges the gap between theoretical statistics and practical data analysis. Unlike basic spreadsheet programs, Statgraphics provides specialized statistical functions designed specifically for researchers, quality control professionals, and data analysts who need reliable, accurate results for critical decision-making processes.
The software's development reflected the growing need for accessible yet powerful statistical analysis tools in academic and industrial settings. Today, it serves as an essential platform for students preparing for advanced placement statistics exams, college statistics courses, and professionals working in data-intensive fields across the United States.
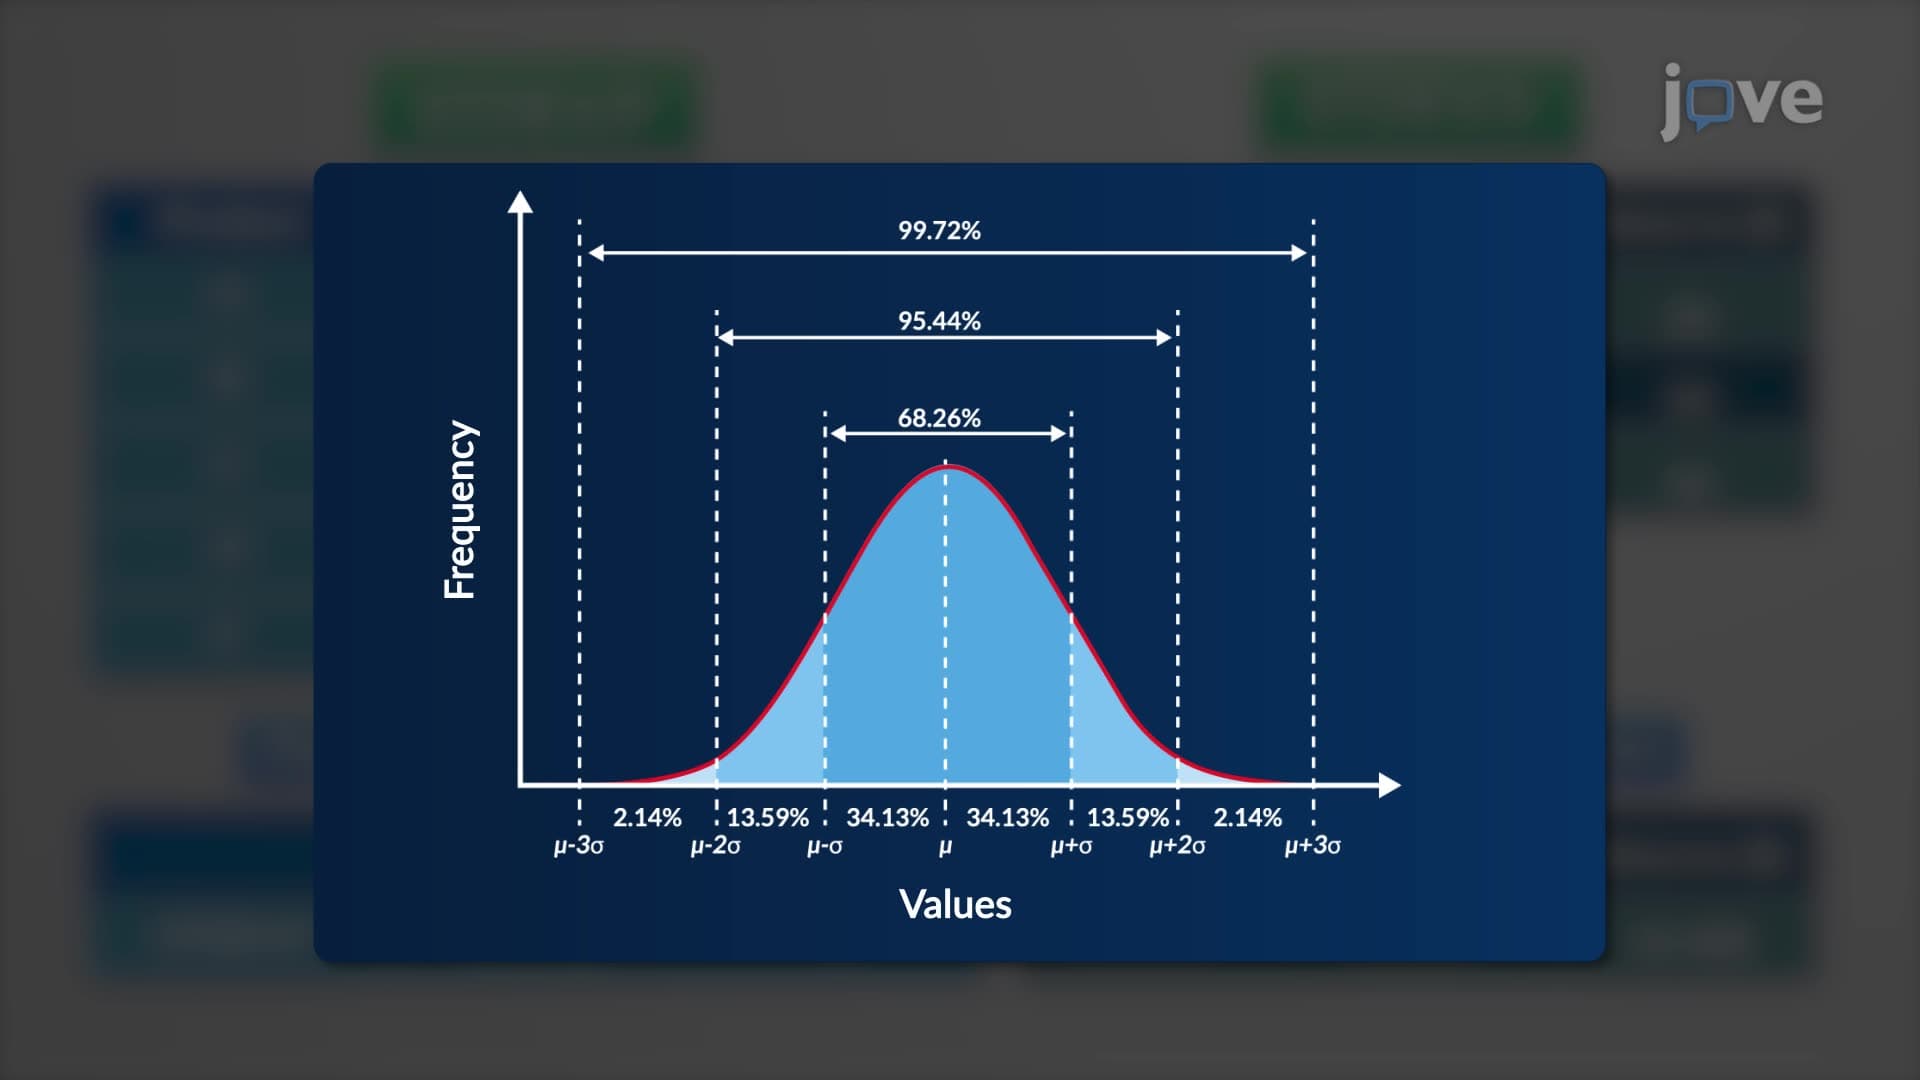
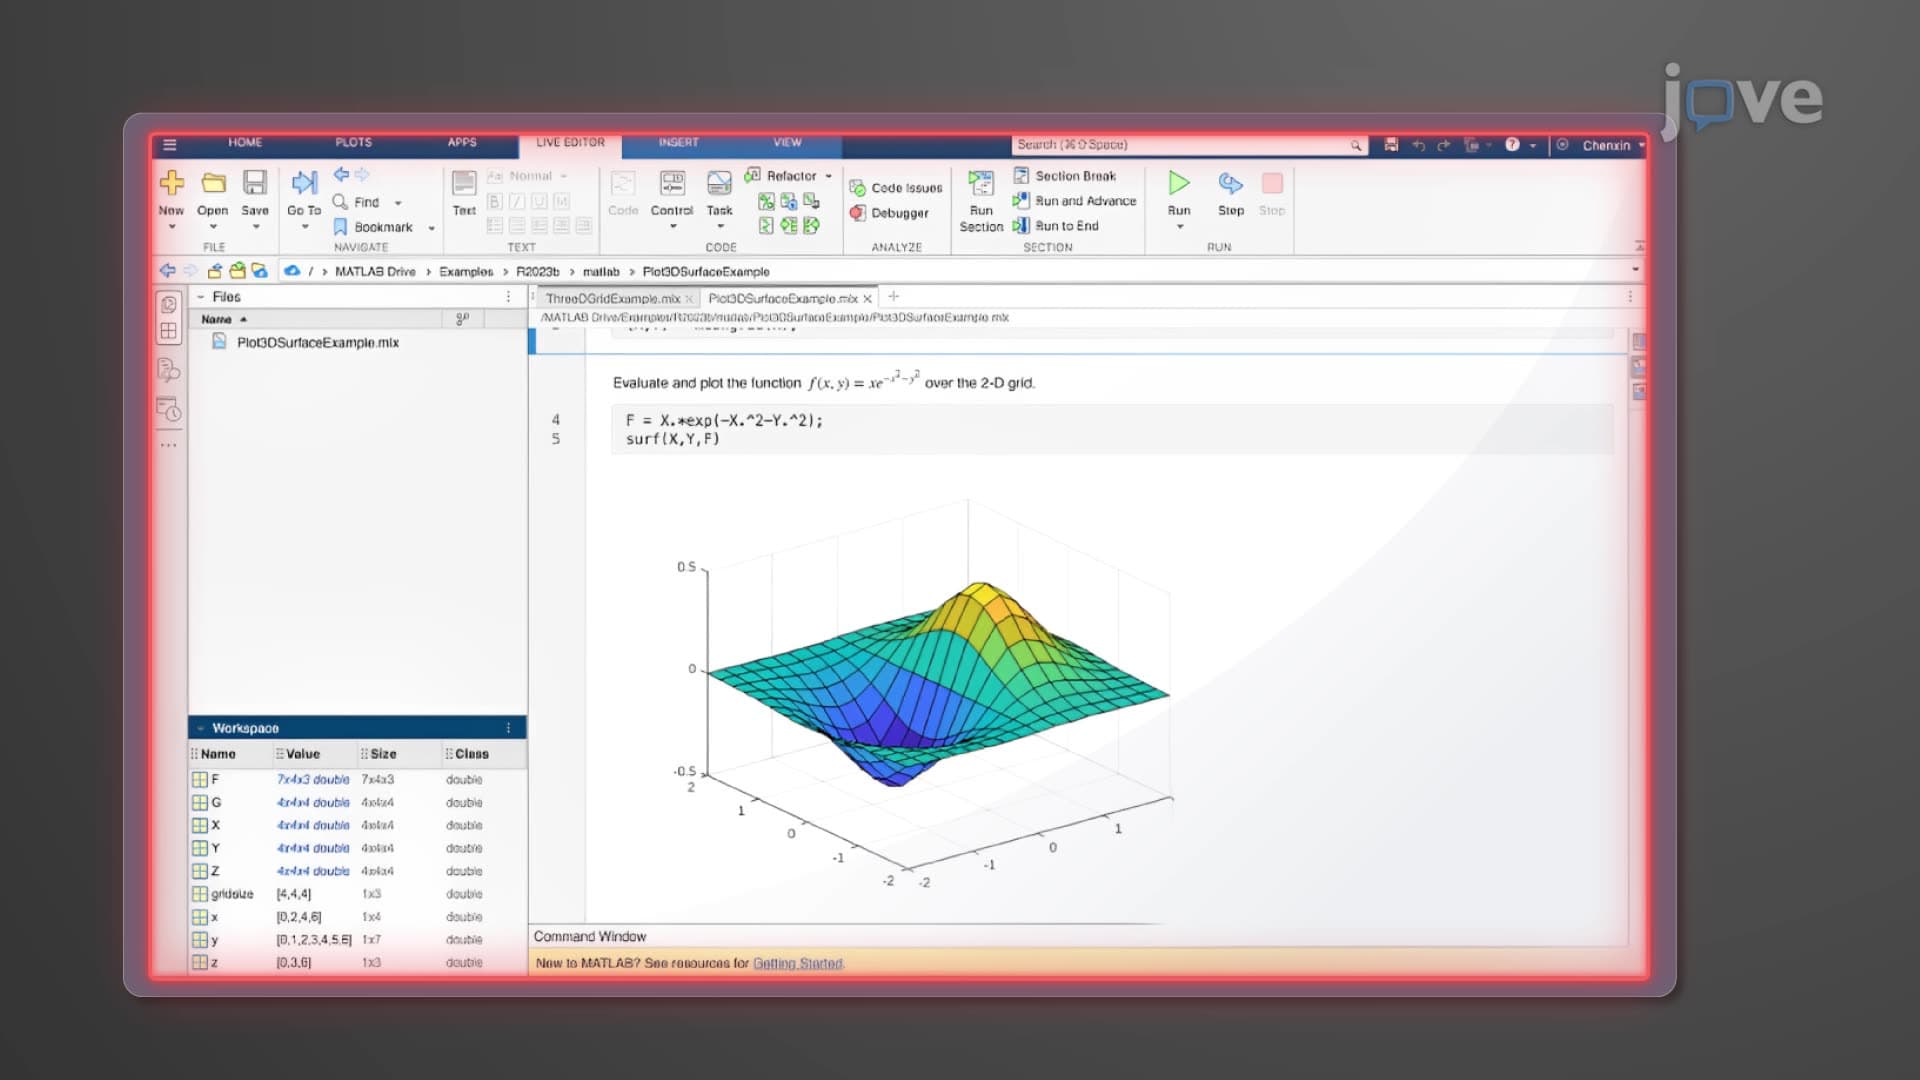
Statgraphics excels in handling both fundamental statistical operations and advanced analytical procedures. The software manages substantial datasets efficiently, making it particularly valuable for big data analytics projects common in modern research environments. Students studying for AP Statistics exams will find its basic functions invaluable for understanding descriptive statistics, probability distributions, and hypothesis testing procedures.
The platform's machine learning integration sets it apart from traditional statistical software, enabling predictive modeling and pattern recognition that's increasingly important in fields like biostatistics and market research. College undergraduates taking research methods courses often use Statgraphics to conduct regression analysis, ANOVA procedures, and multivariate statistics required for their coursework and thesis projects.
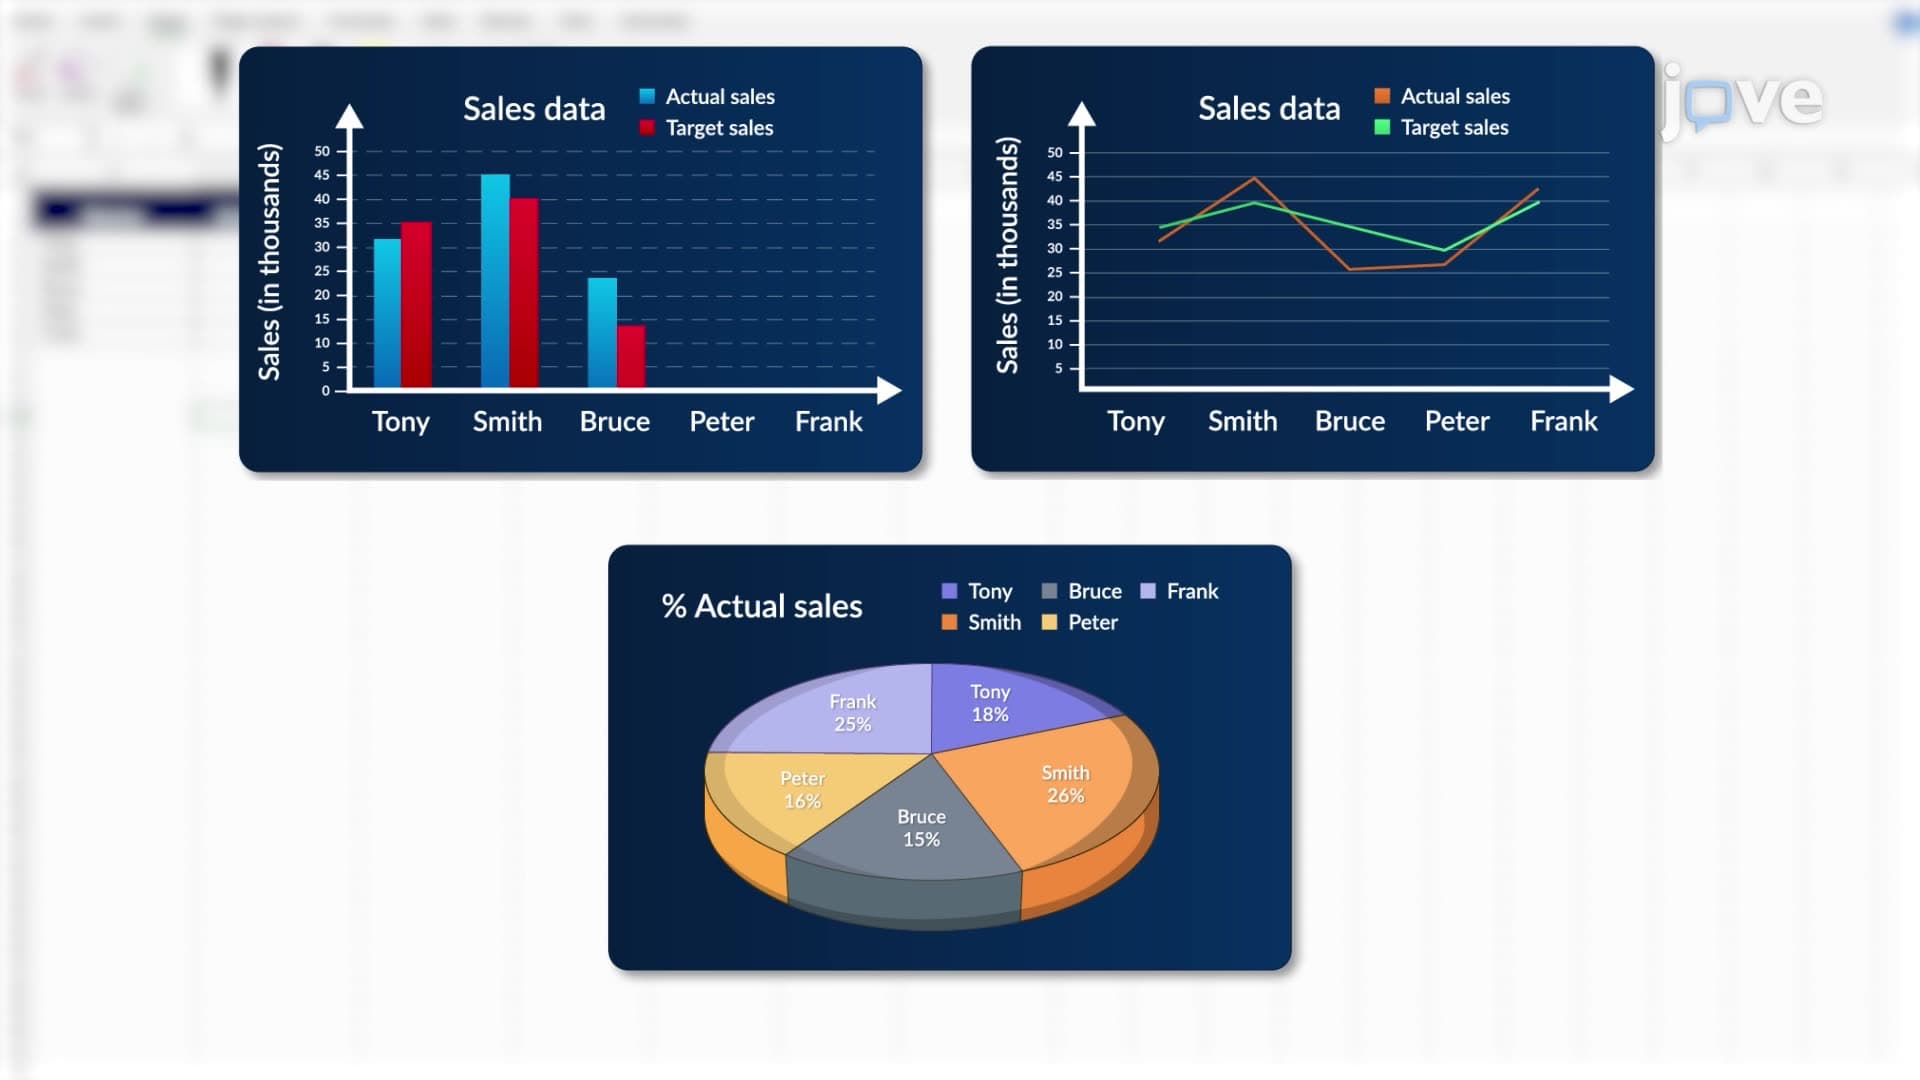
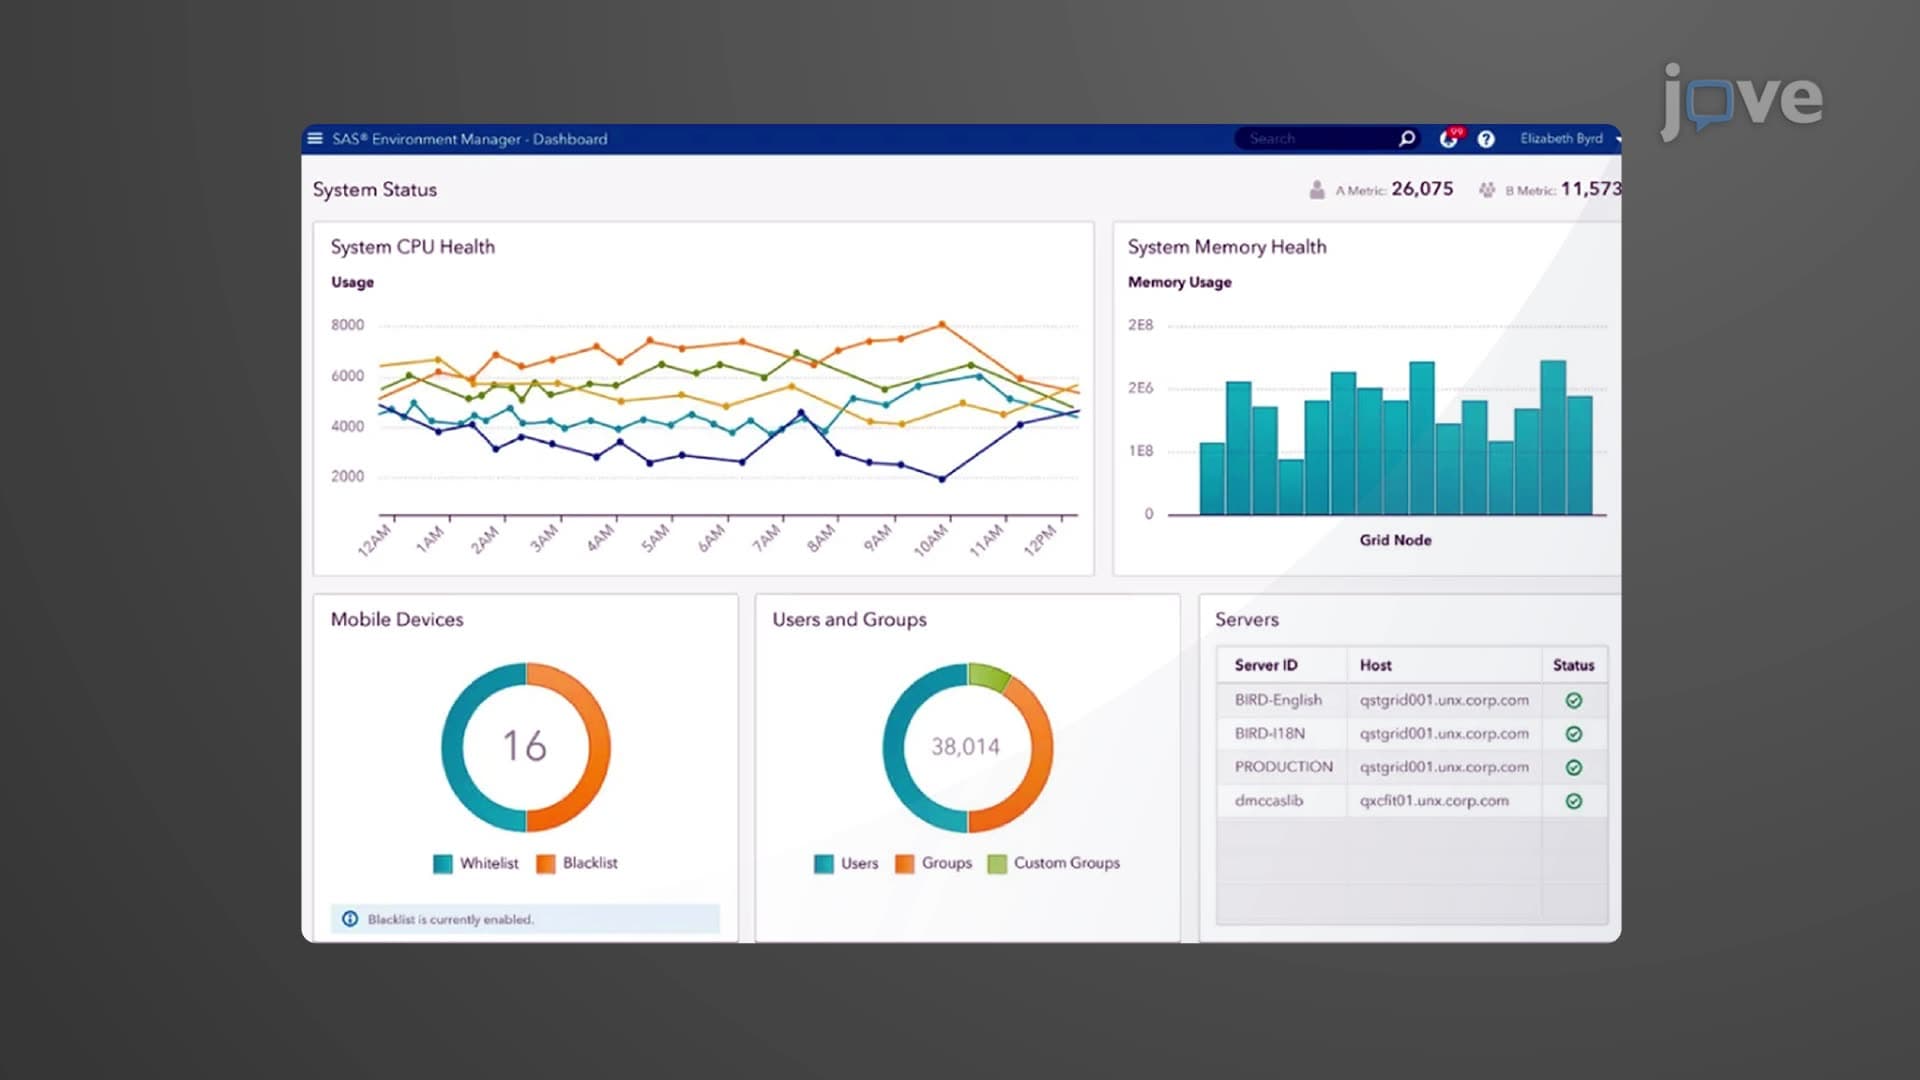
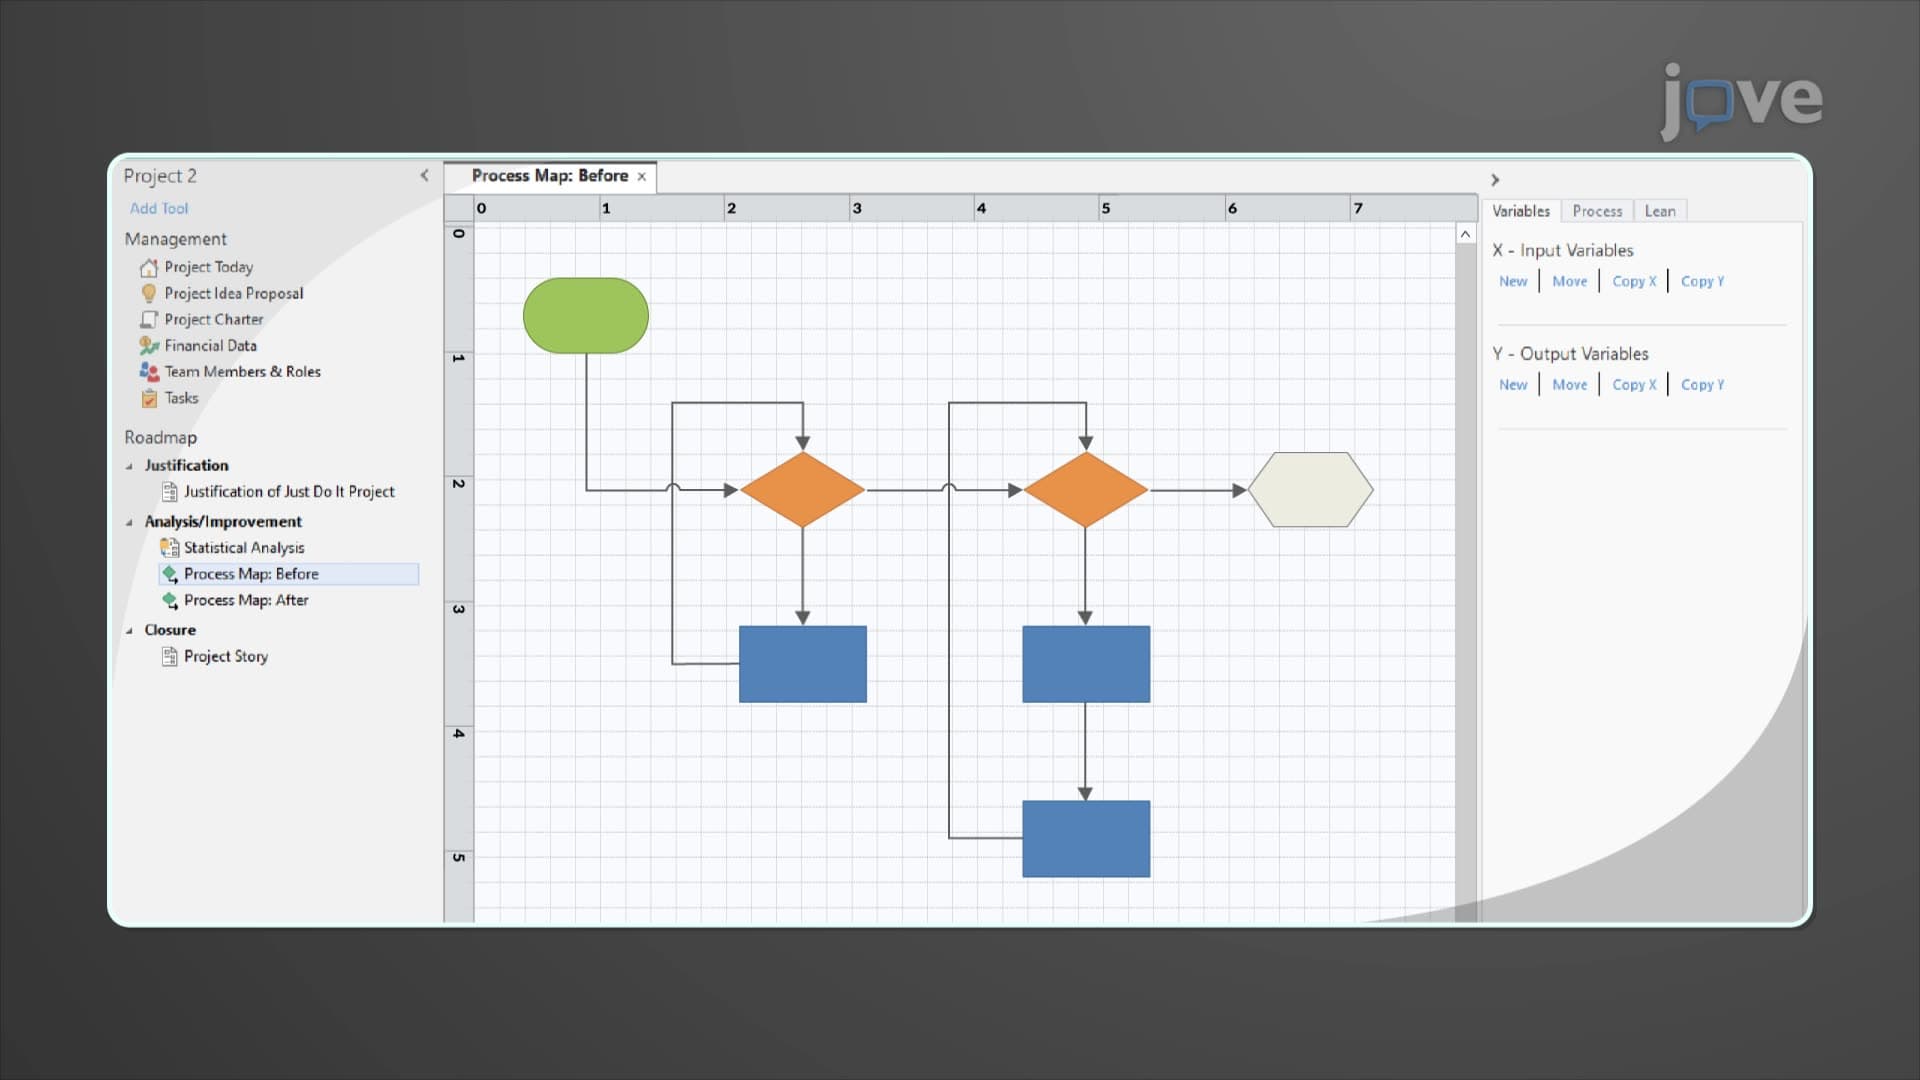
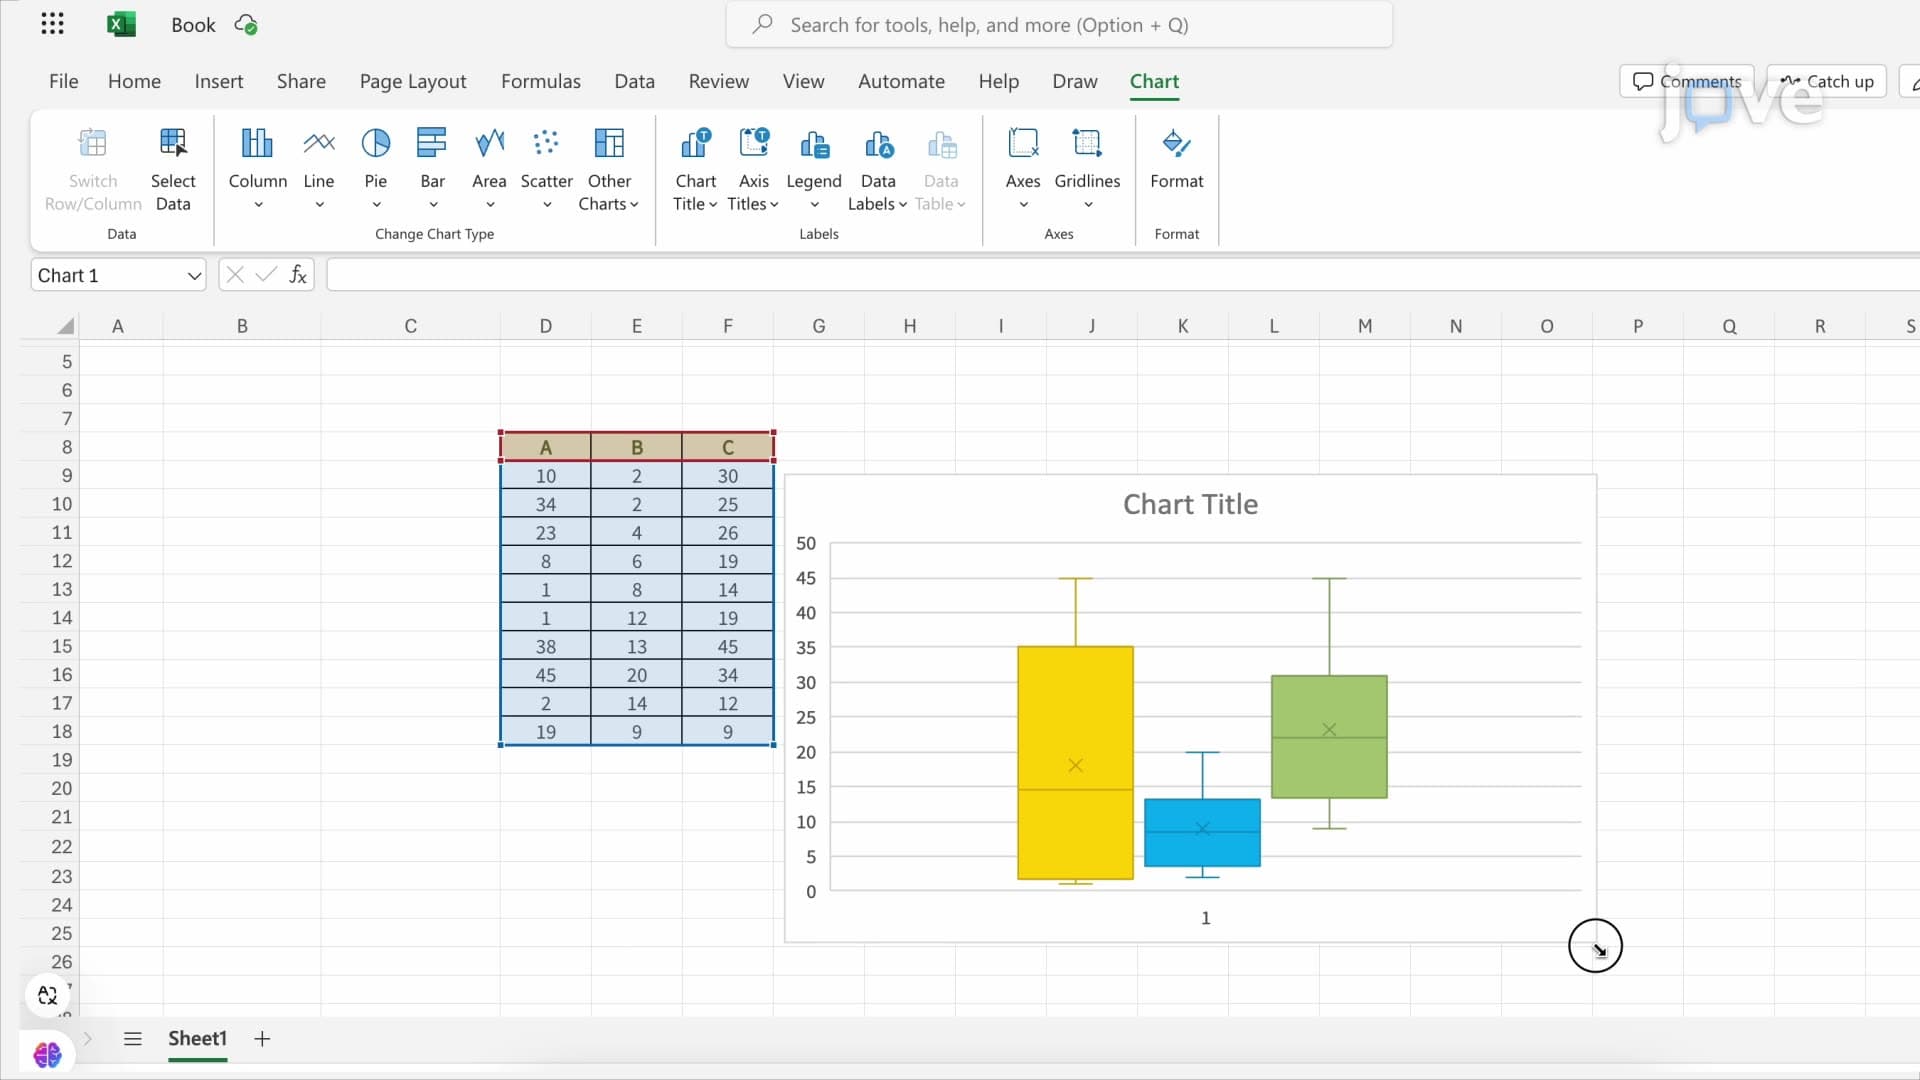
One of Statgraphics' most distinctive features lies in its sophisticated visualization capabilities, including enhanced contour plots and comprehensive control charts. These tools prove essential for Six Sigma initiatives, where visual representation of process variation helps identify improvement opportunities. Manufacturing companies like Boeing and Caterpillar rely on these visualization features for statistical process control and quality assurance programs.
The Centurion version, specifically designed for Windows environments, combines powerful analytical capabilities with an intuitive interface that makes complex statistical procedures accessible to users with varying levels of statistical expertise. This accessibility proves particularly valuable for high school students beginning their statistics education and college students transitioning from basic math courses to advanced statistical analysis.
Statgraphics demonstrates remarkable versatility across diverse sectors of the US economy. In pharmaceutical research, companies like Johnson & Johnson use the software for clinical trial analysis and drug development quality control. The automotive industry leverages Statgraphics for reliability testing and manufacturing process optimization, while environmental researchers at institutions like the National Institute of Environmental Health Sciences employ it for analyzing complex ecological datasets and pollution monitoring studies.
Related Micro-courses