Loading video…


 16 Concepts
 15.9K views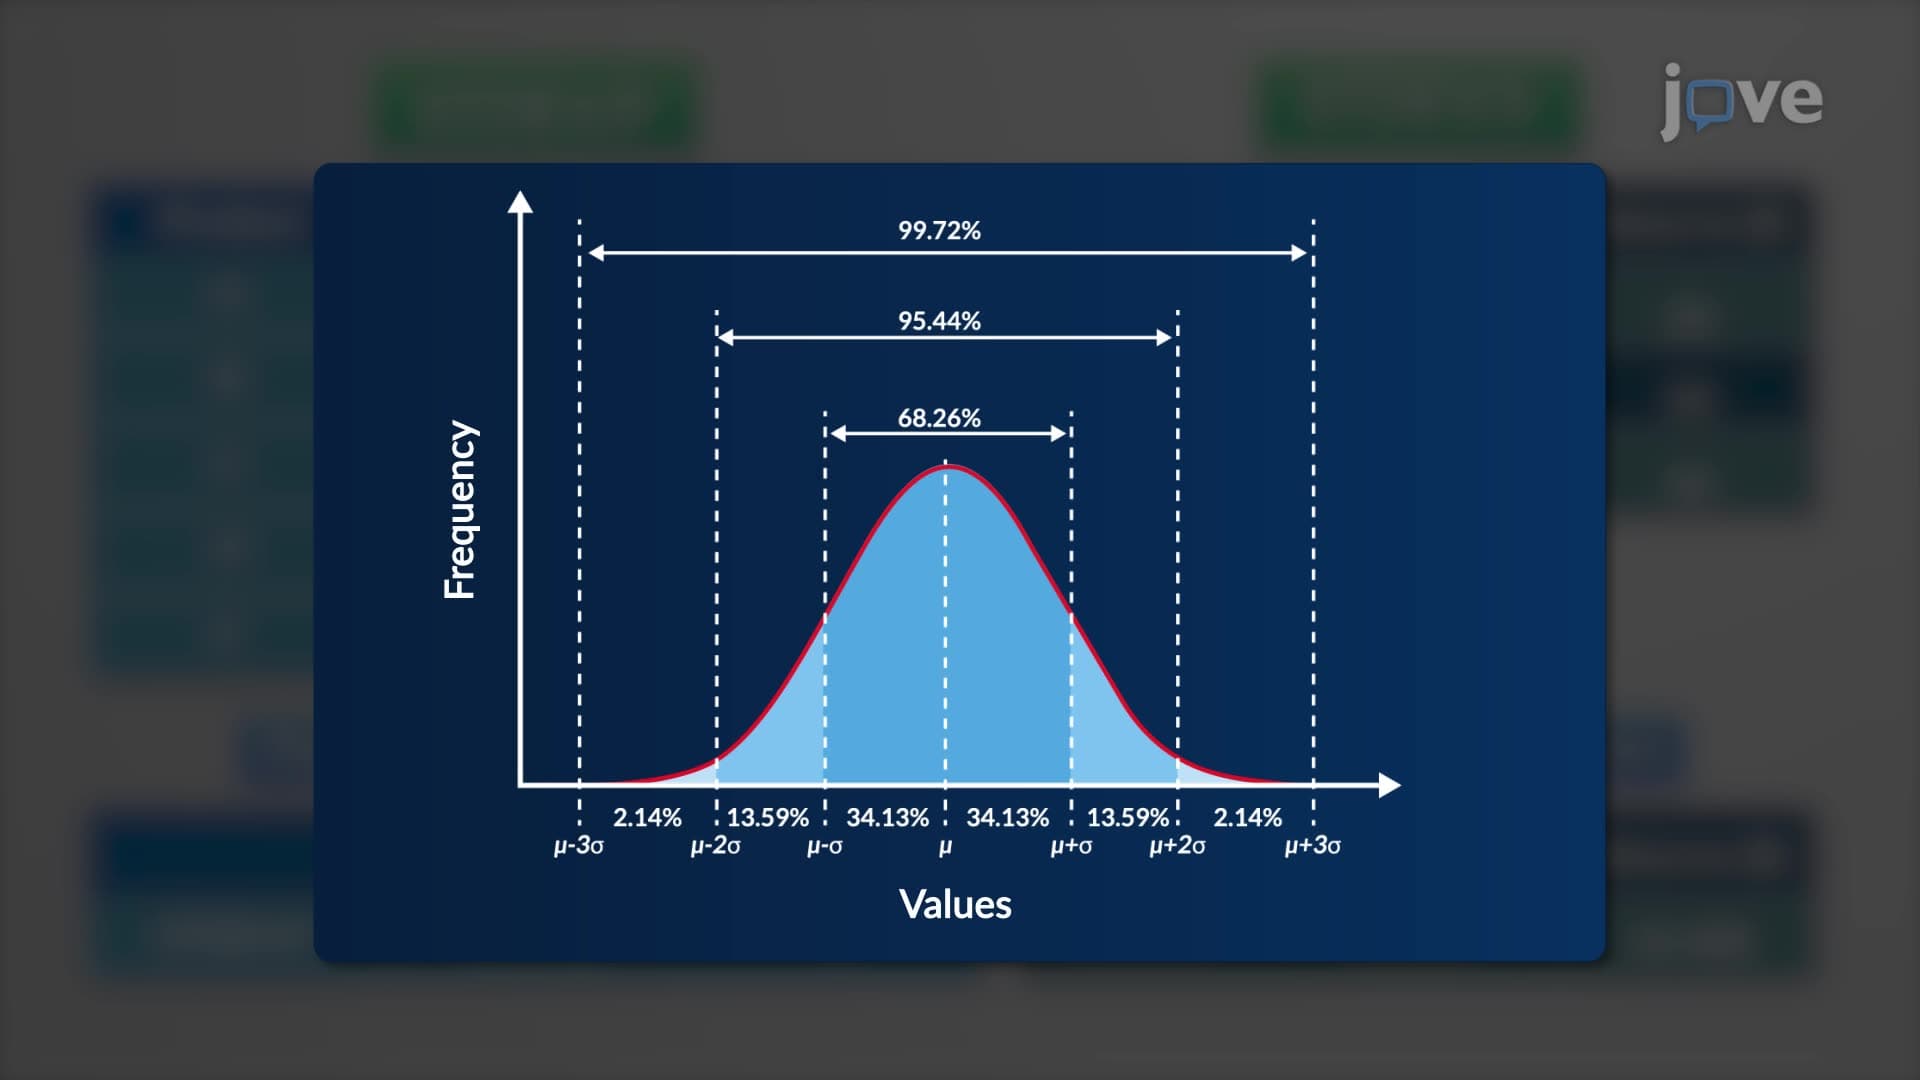

Video Summary: Performing a Simple Data Analysis Explained
Did you know that Netflix analyzes over 1 billion hours of viewing data weekly to recommend your next binge-watch? Performing a simple data analysis starts with basic statistical functions that reveal patterns hidden in raw numbers. Microsoft Excel provides powerful tools like AVERAGE, MEDIAN, and standard deviation functions that help students analyze everything from SAT score distributions to climate data trends. These fundamental techniques form the backbone of data-driven decision making in fields from sports analytics to medical research. Watch the full video on JoVE Coach to master this concept with expert-led visuals and step-by-step explanations.
Performing a simple data analysis involves systematically examining datasets to extract meaningful insights through statistical methods. This process begins with descriptive statistics-numerical summaries that describe the basic features of your data. Students encounter this concept in AP Statistics courses and college-level research methods classes, where understanding data patterns becomes crucial for academic success.
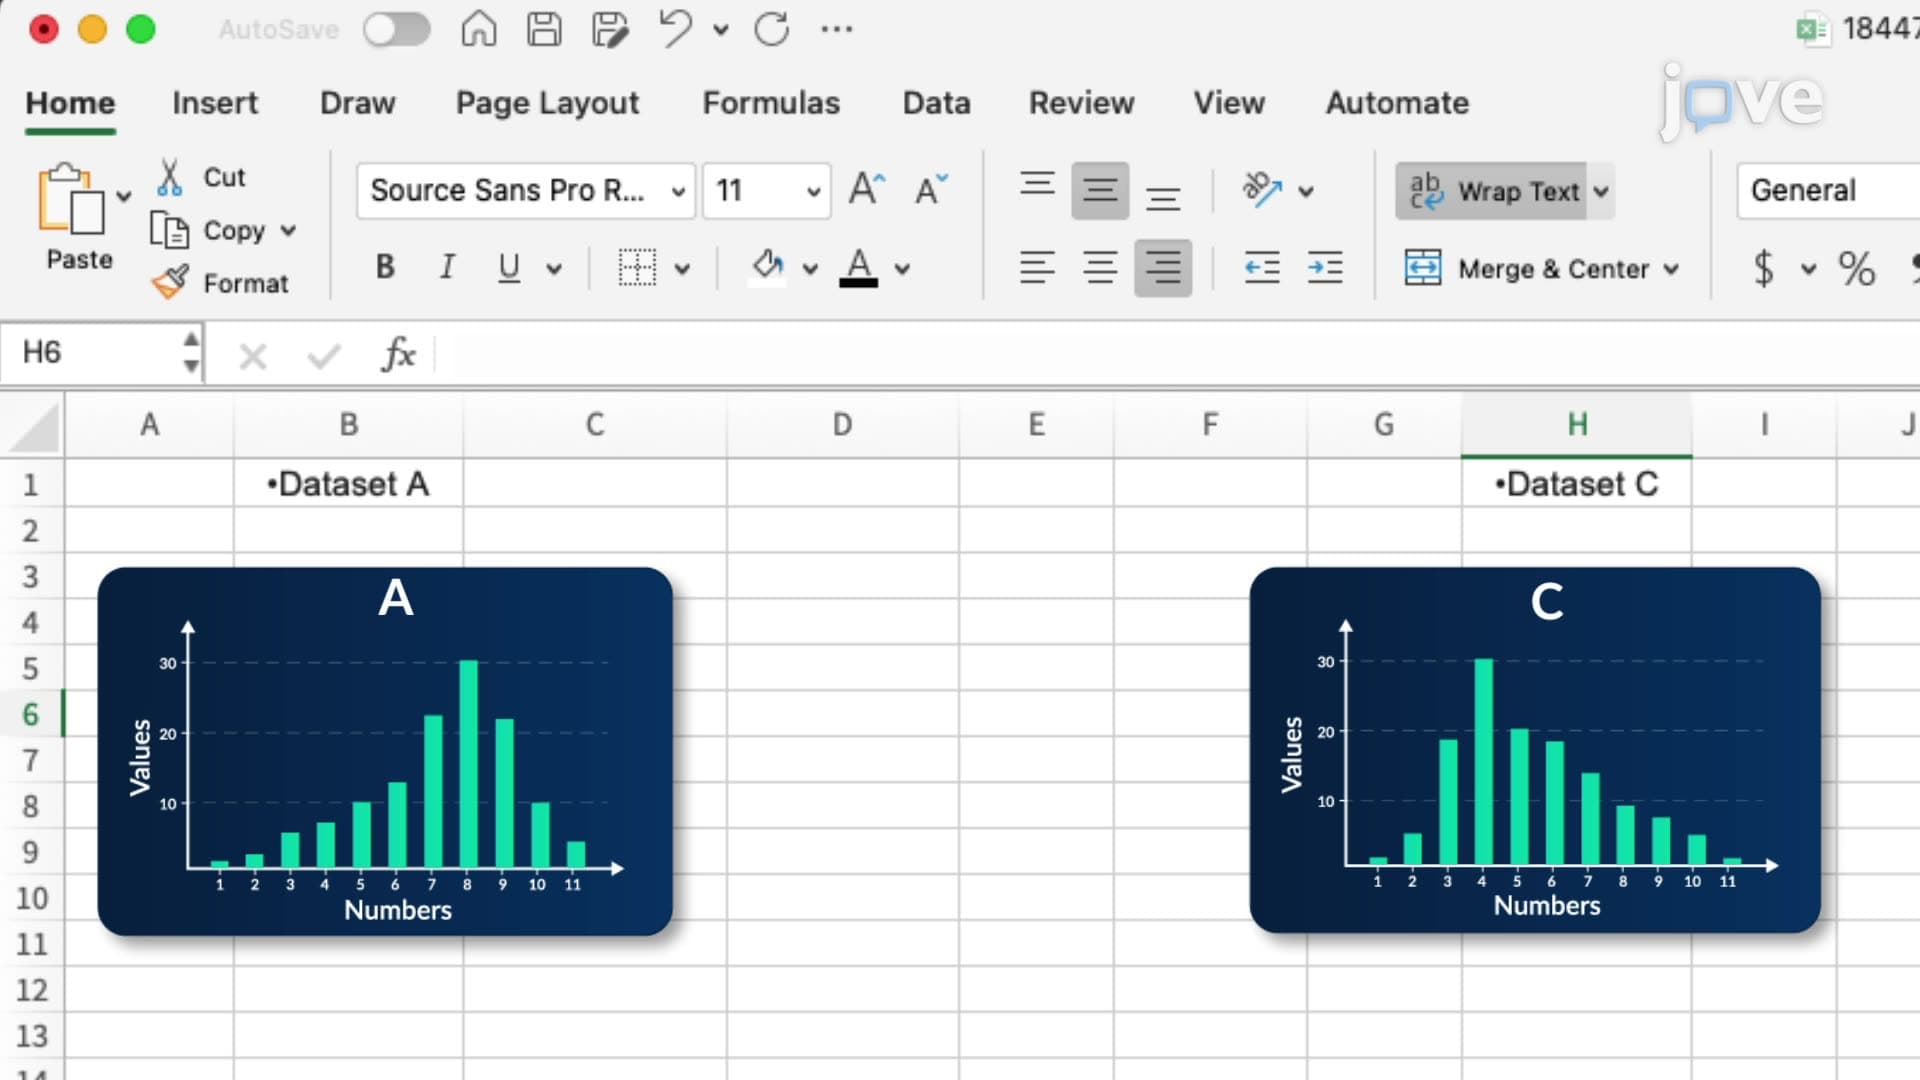
The foundation of any analysis lies in understanding where your data clusters and how much it varies. Excel's AVERAGE function calculates the arithmetic mean, perfect for analyzing test scores or survey responses. However, the MEDIAN function often provides better insights when dealing with skewed data-like analyzing household incomes across different US states, where extreme values can distort the mean.
The MODE function identifies the most frequently occurring value, particularly useful in quality control scenarios or consumer preference studies. For example, a high school analyzing student lunch preferences would use MODE to identify the most popular meal option.
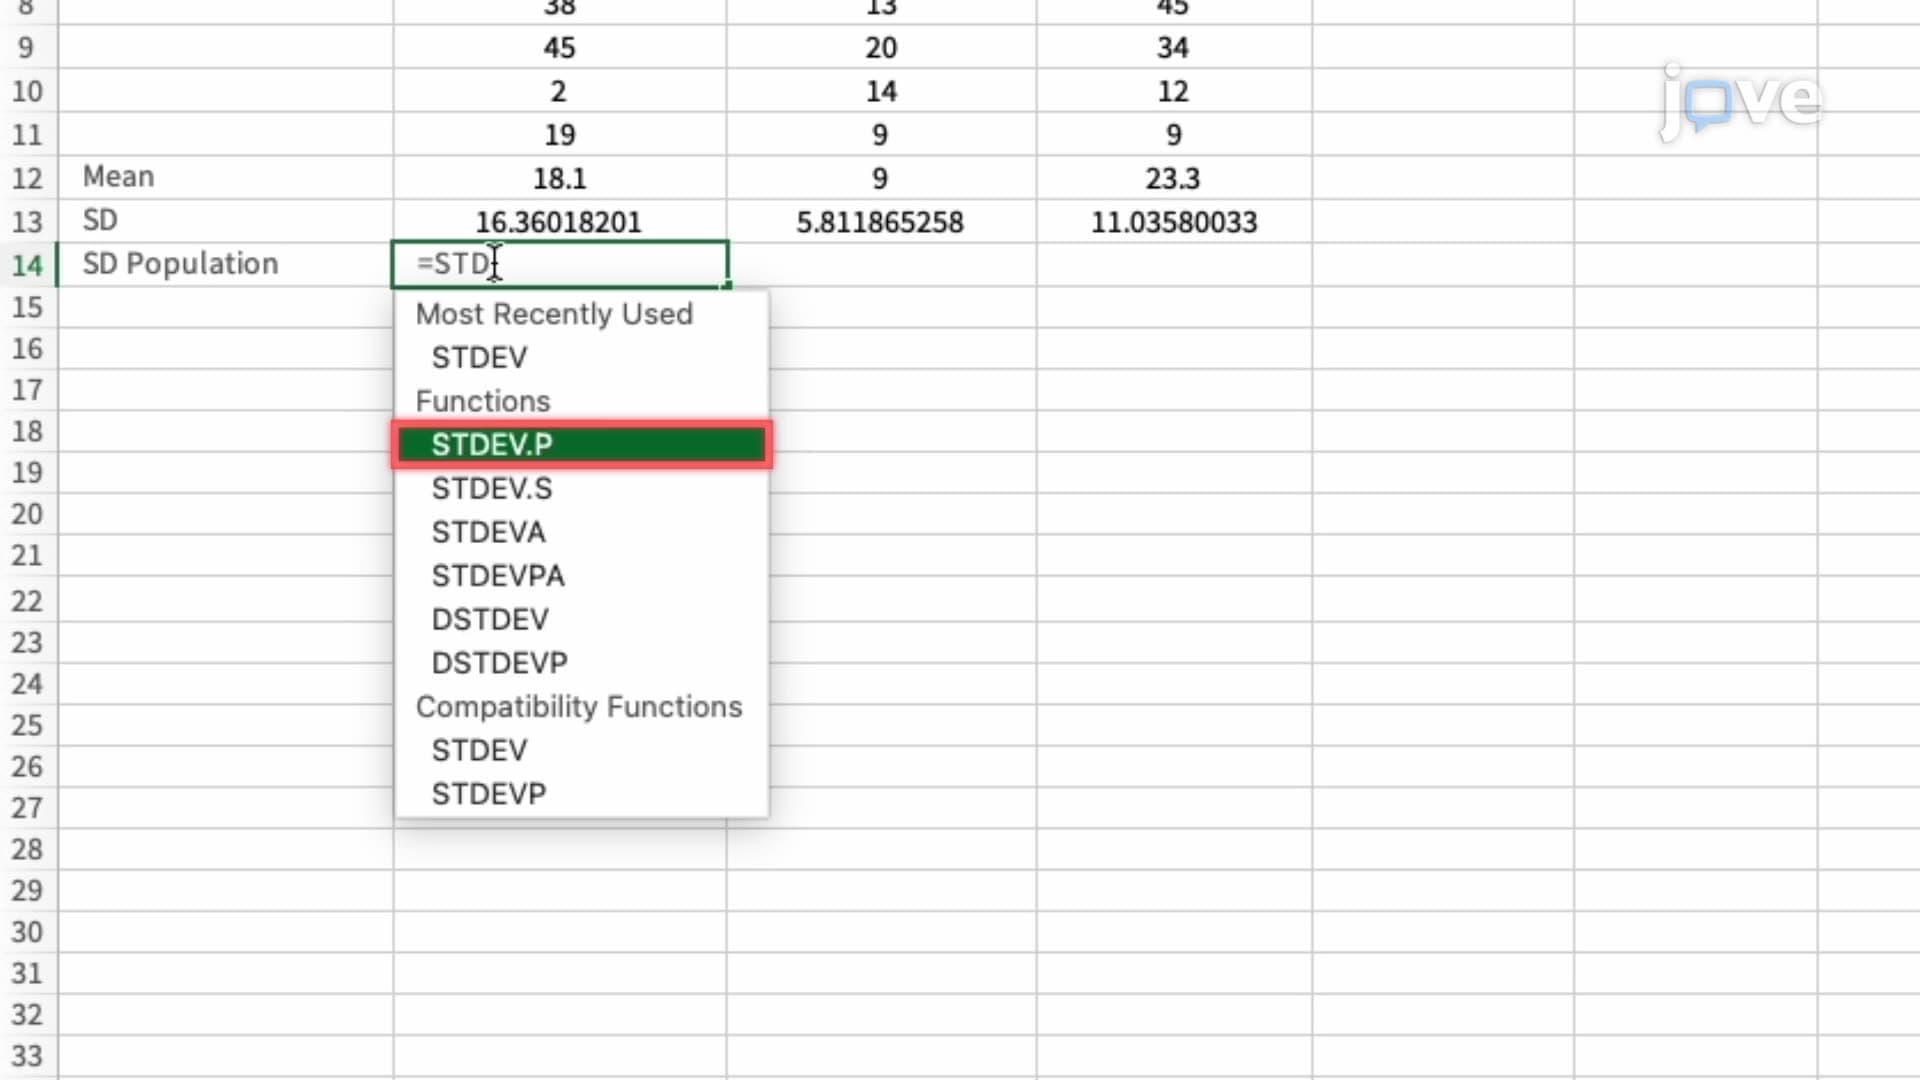
Standard deviation functions (STDEV.P for populations, STDEV.S for samples) measure data spread. A low standard deviation indicates consistent performance-crucial when analyzing standardized test scores for college admissions or evaluating manufacturing processes in industrial engineering programs.
Excel's IF function enables conditional data categorization, allowing analysts to classify information based on specific criteria. Students might use IF statements to categorize GPA ranges for scholarship eligibility or classify experimental results as statistically significant.
VLOOKUP and HLOOKUP functions retrieve specific information from large datasets, essential skills for business analytics and research methodology courses. These functions prove invaluable when cross-referencing student IDs with performance data or matching product codes with inventory information.
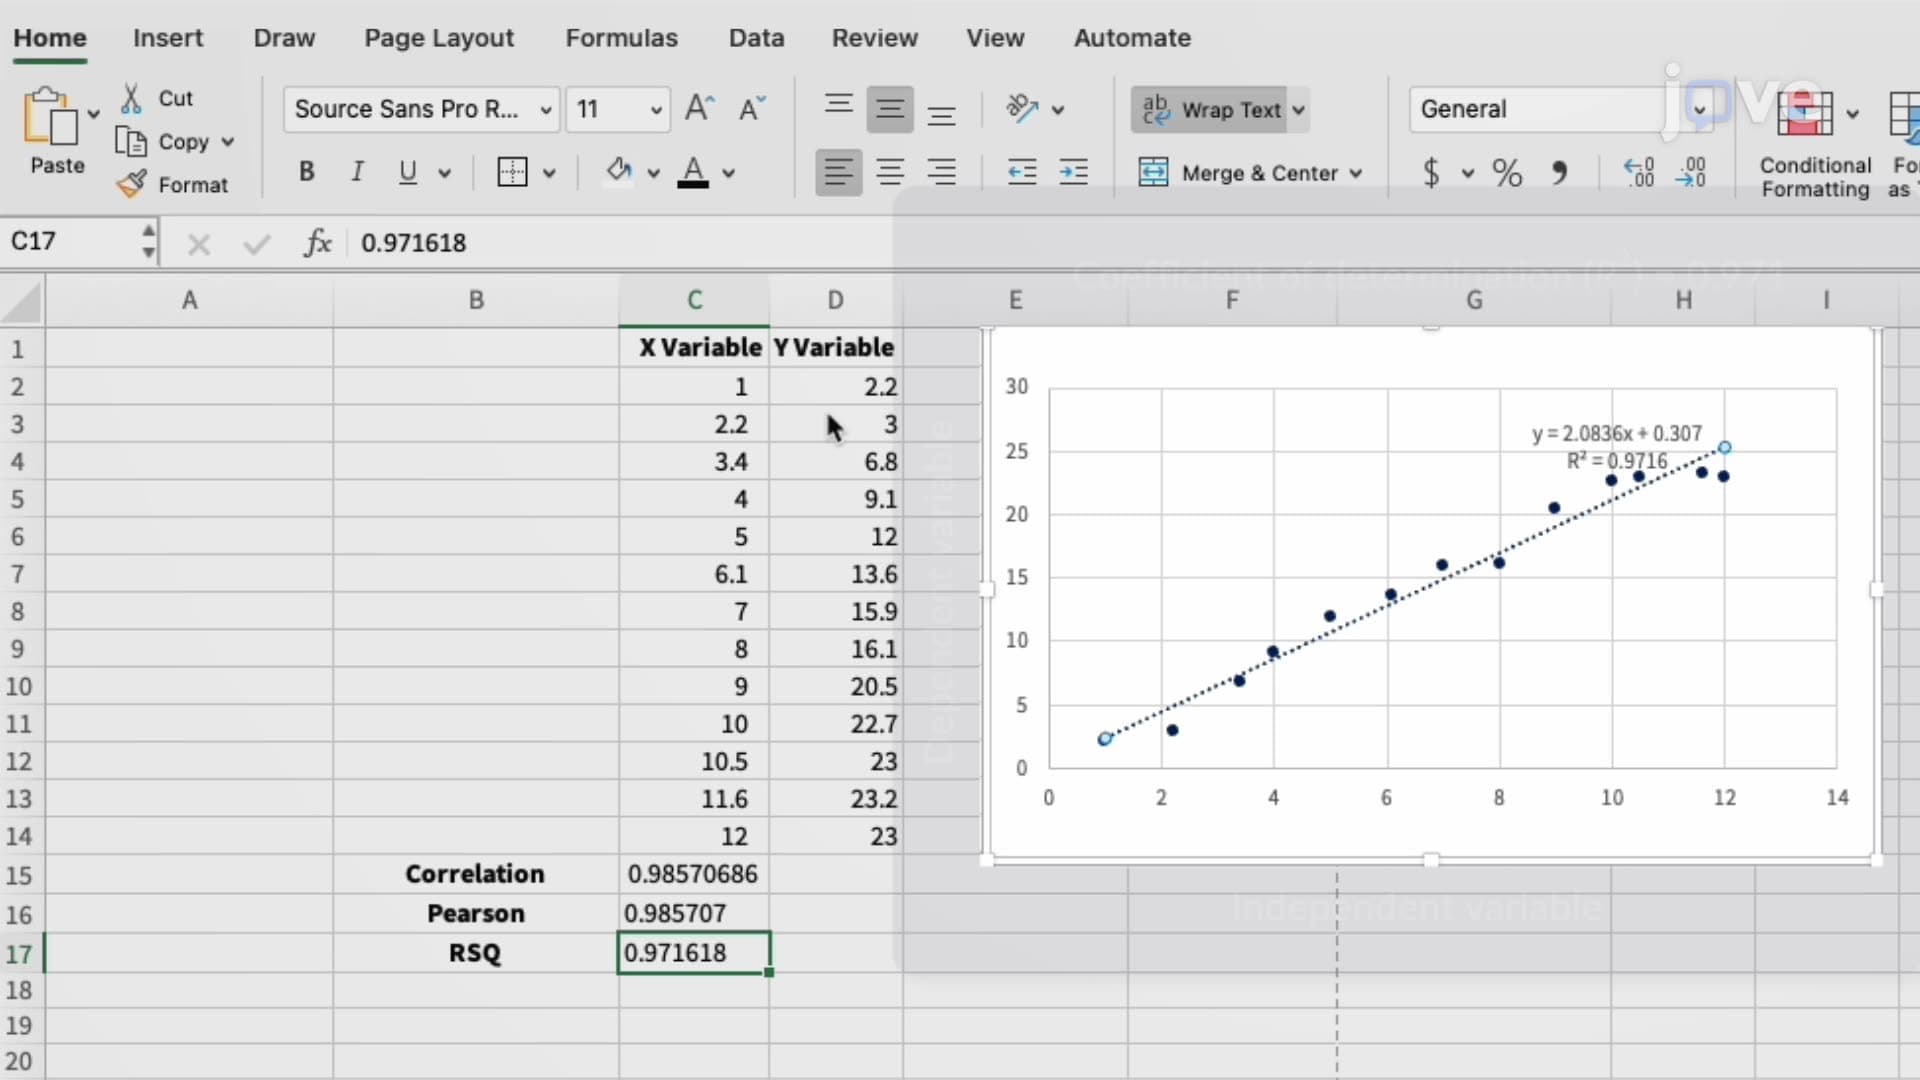
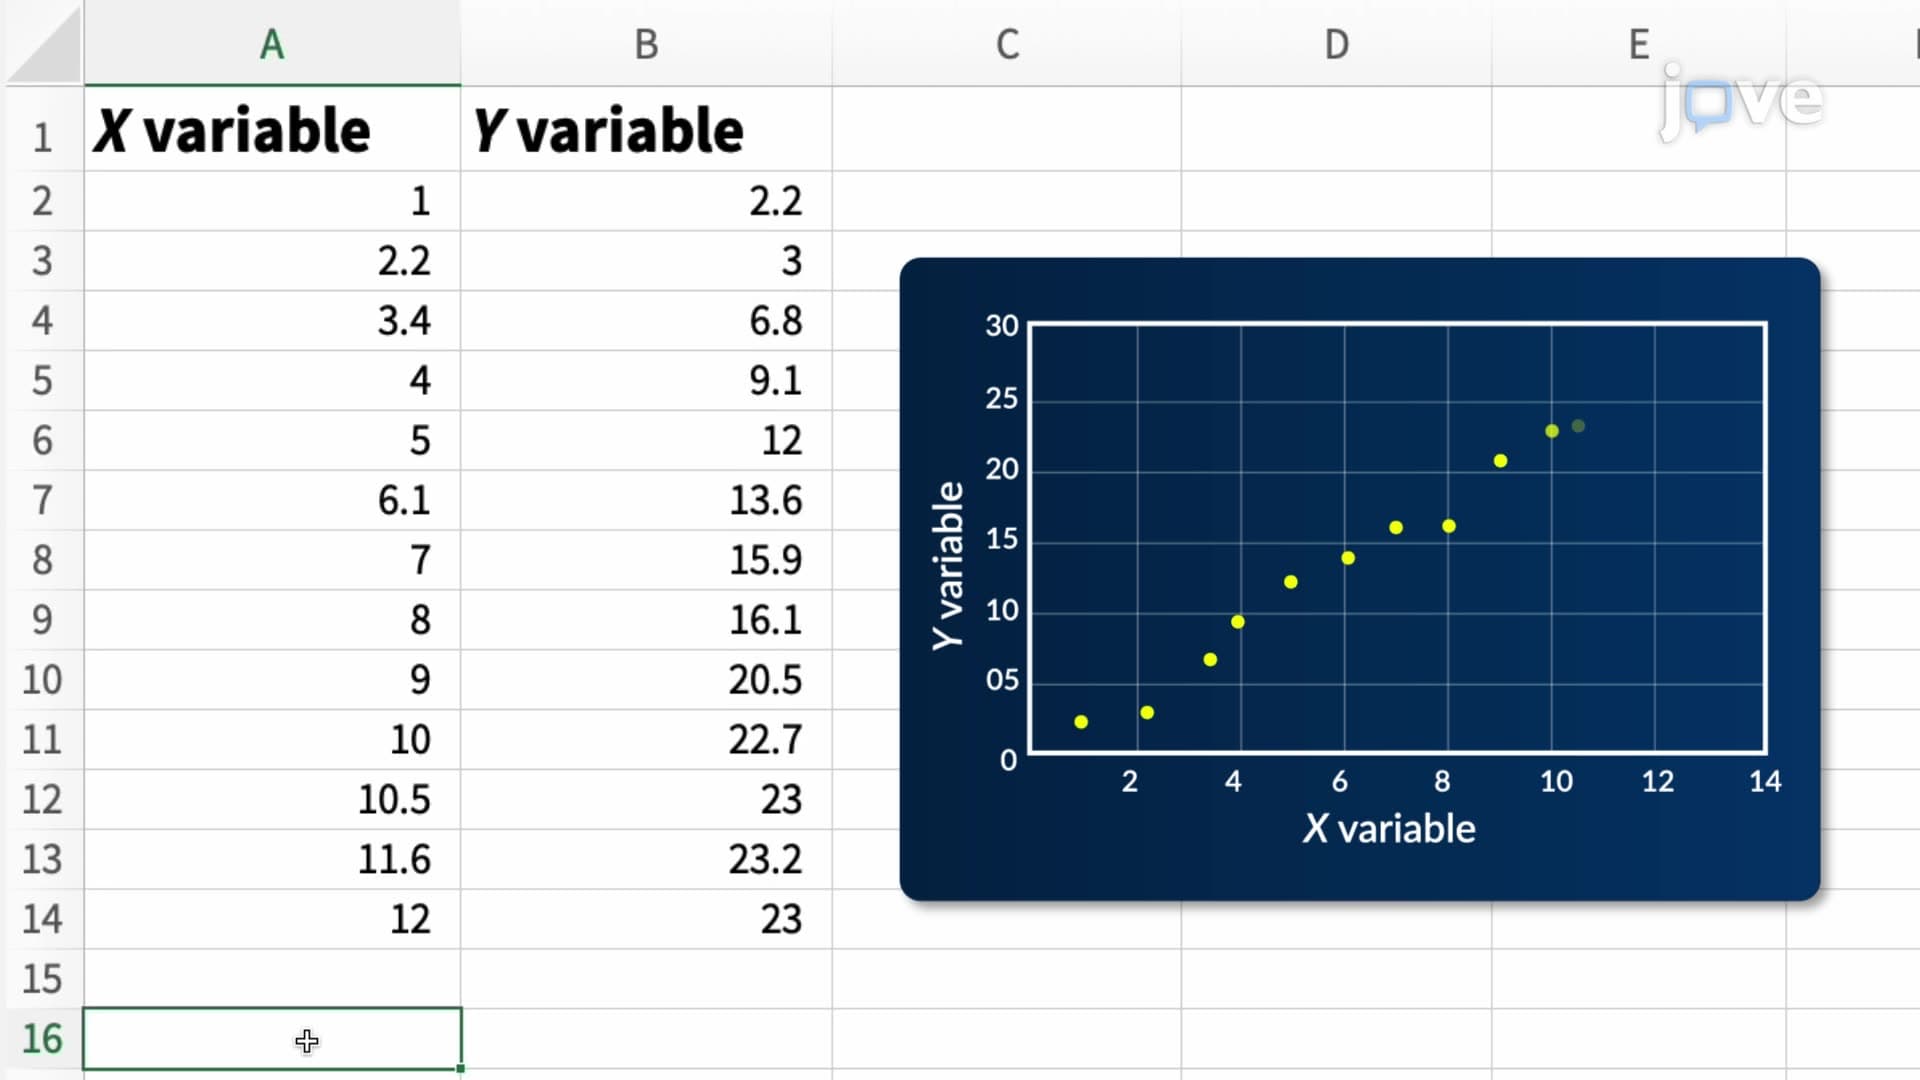
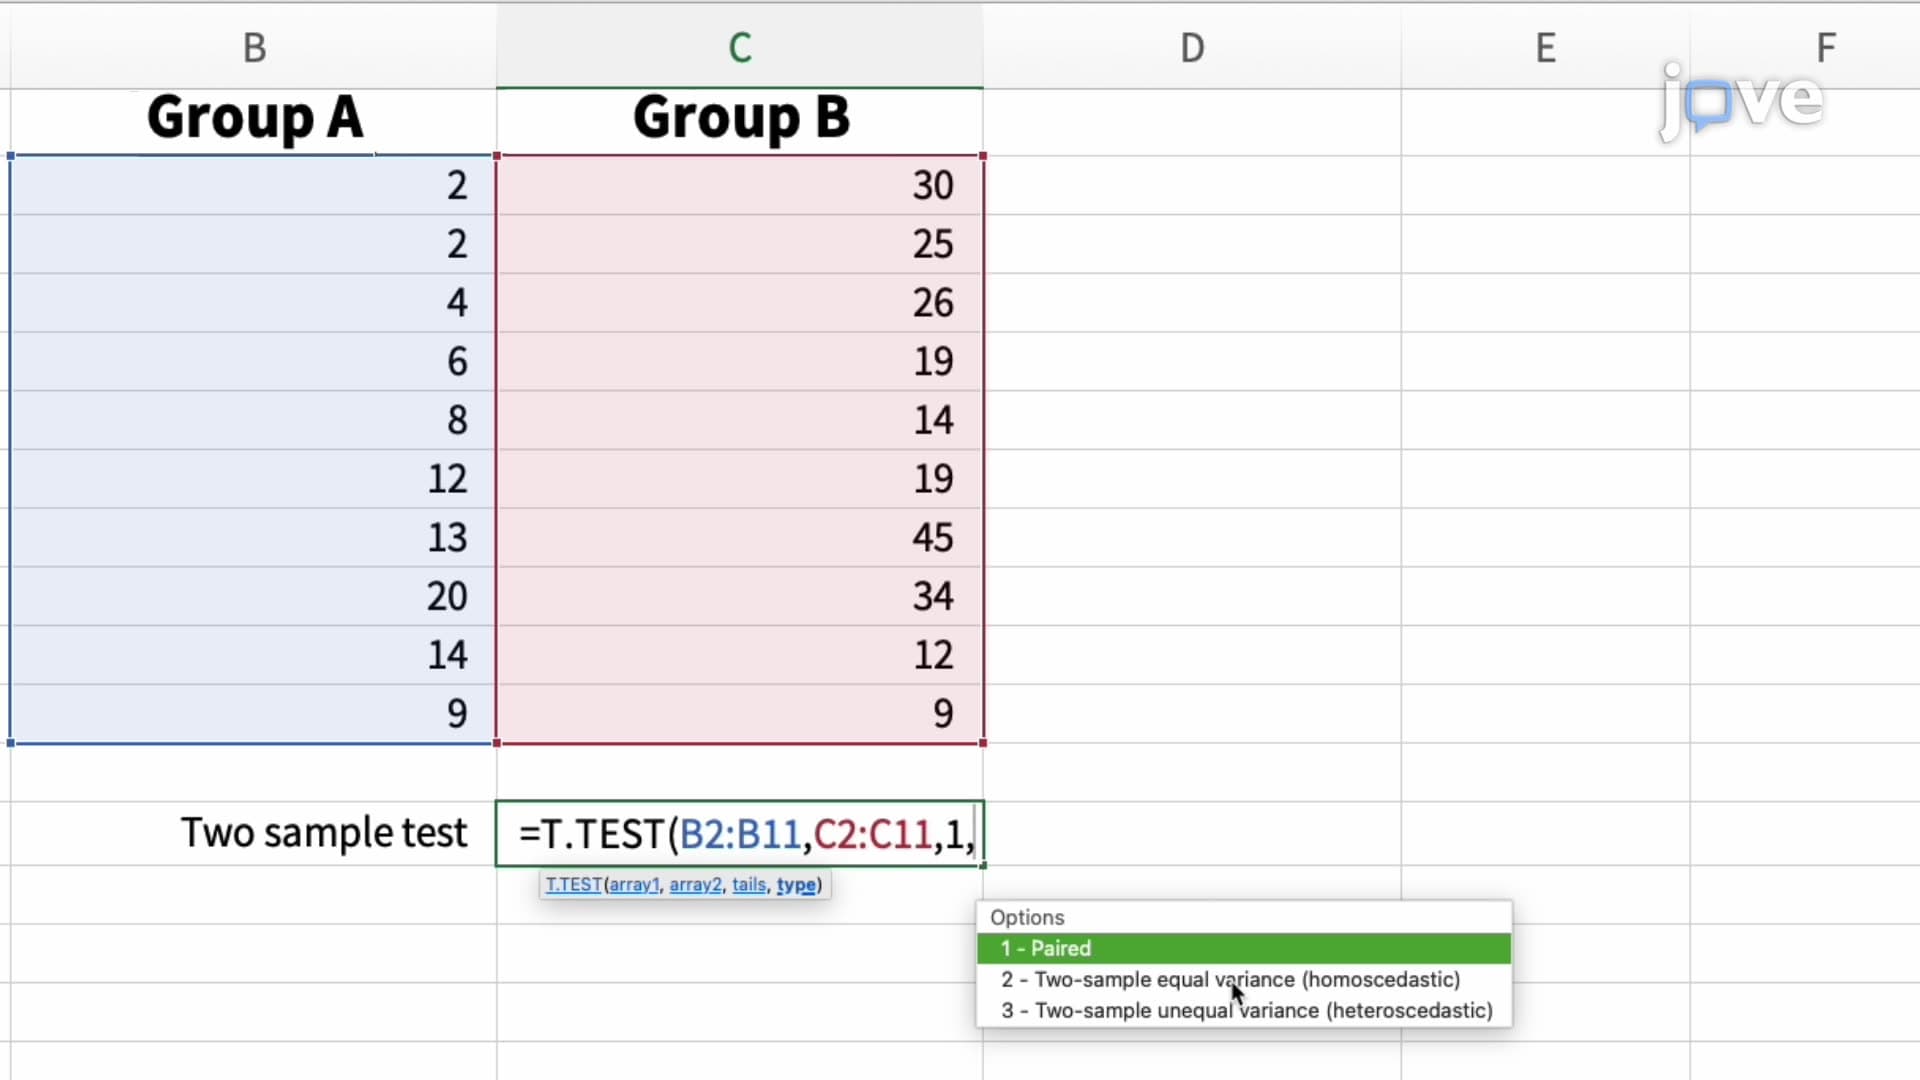
Hypothesis testing functions in Excel support more sophisticated analyses required in upper-level statistics courses and research projects. Correlation coefficients reveal relationships between variables-like studying the connection between study hours and exam performance. Student's t-test functions help determine statistical significance, critical for AP Research projects and college thesis work.
Pivot tables represent Excel's most powerful analytical tool, enabling complex data summarization without programming knowledge. These dynamic tables prove essential for analyzing survey results, financial data, or experimental outcomes in various academic disciplines.
Related Micro-courses