Loading video…


 16 Concepts
 15.9K views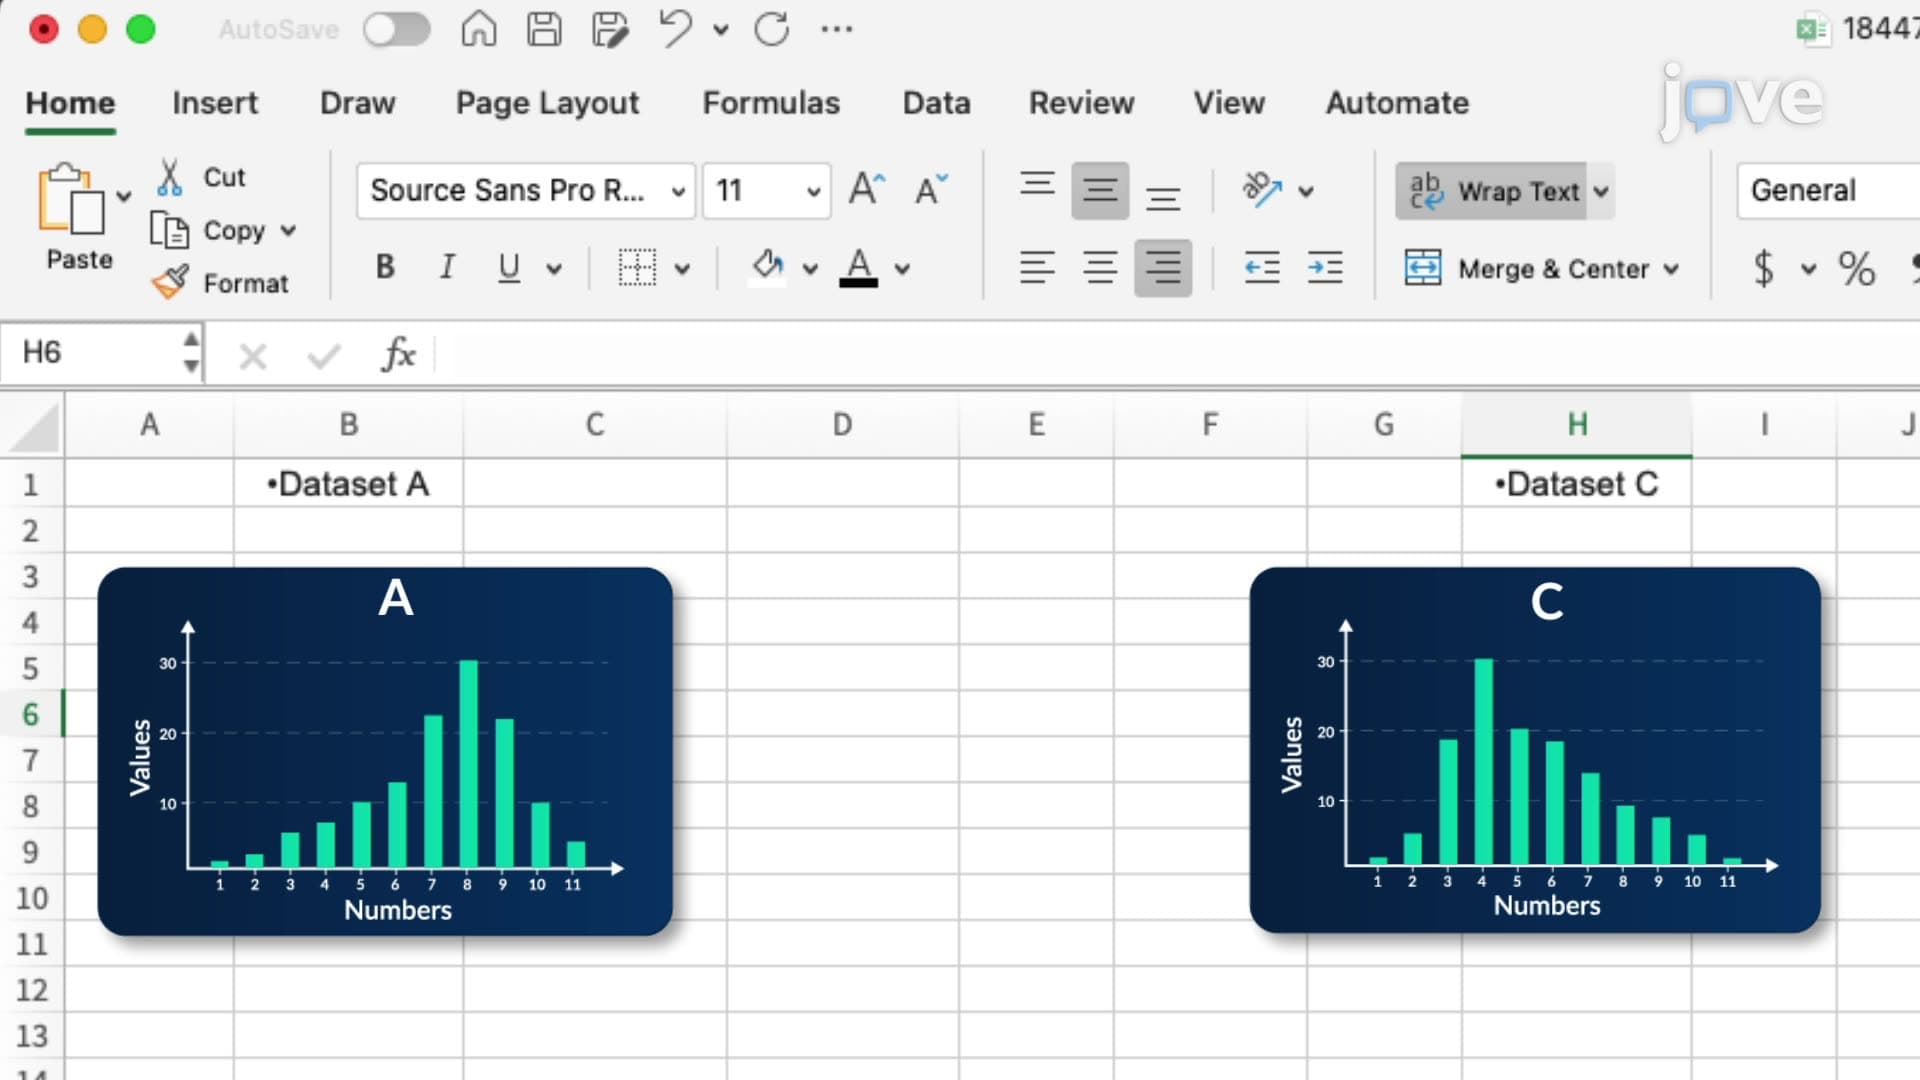

Video Summary: Microsoft Excel Finding Central Tendency Explained
Did you know that analyzing student test scores across US high schools relies heavily on Microsoft Excel finding central tendency measures? Microsoft Excel finding central tendency involves calculating mean, median, and mode using built-in functions like AVERAGE, MEDIAN, and MODE.SNGL to understand data distribution patterns. For instance, when educational researchers at UCLA analyze SAT score distributions, they also examine skewness and kurtosis to identify whether scores cluster symmetrically or show bias toward higher or lower values. Watch the full video on JoVE Coach to master this concept with expert-led visuals and step-by-step explanations.
Microsoft Excel finding central tendency represents a cornerstone skill for students entering statistics, business analytics, and research fields. Central tendency measures help identify the "typical" or "average" value within a dataset, providing crucial insights for decision-making across industries from healthcare to finance.
The three primary measures-mean, median, and mode-each serve distinct purposes. The mean (calculated using Excel's AVERAGE function) represents the arithmetic average, making it ideal for normally distributed data like standardized test scores. The median (MEDIAN function) identifies the middle value when data is arranged in order, proving more robust against outliers than the mean. The mode (MODE.SNGL function) reveals the most frequently occurring value, particularly valuable for categorical data analysis.
Students preparing for AP Statistics exams frequently encounter central tendency problems involving real datasets. For example, analyzing college admission test scores across different demographics requires understanding which measure best represents the data. Similarly, business students studying market research must determine whether consumer spending patterns follow normal distributions or show skewness that affects strategic decisions.
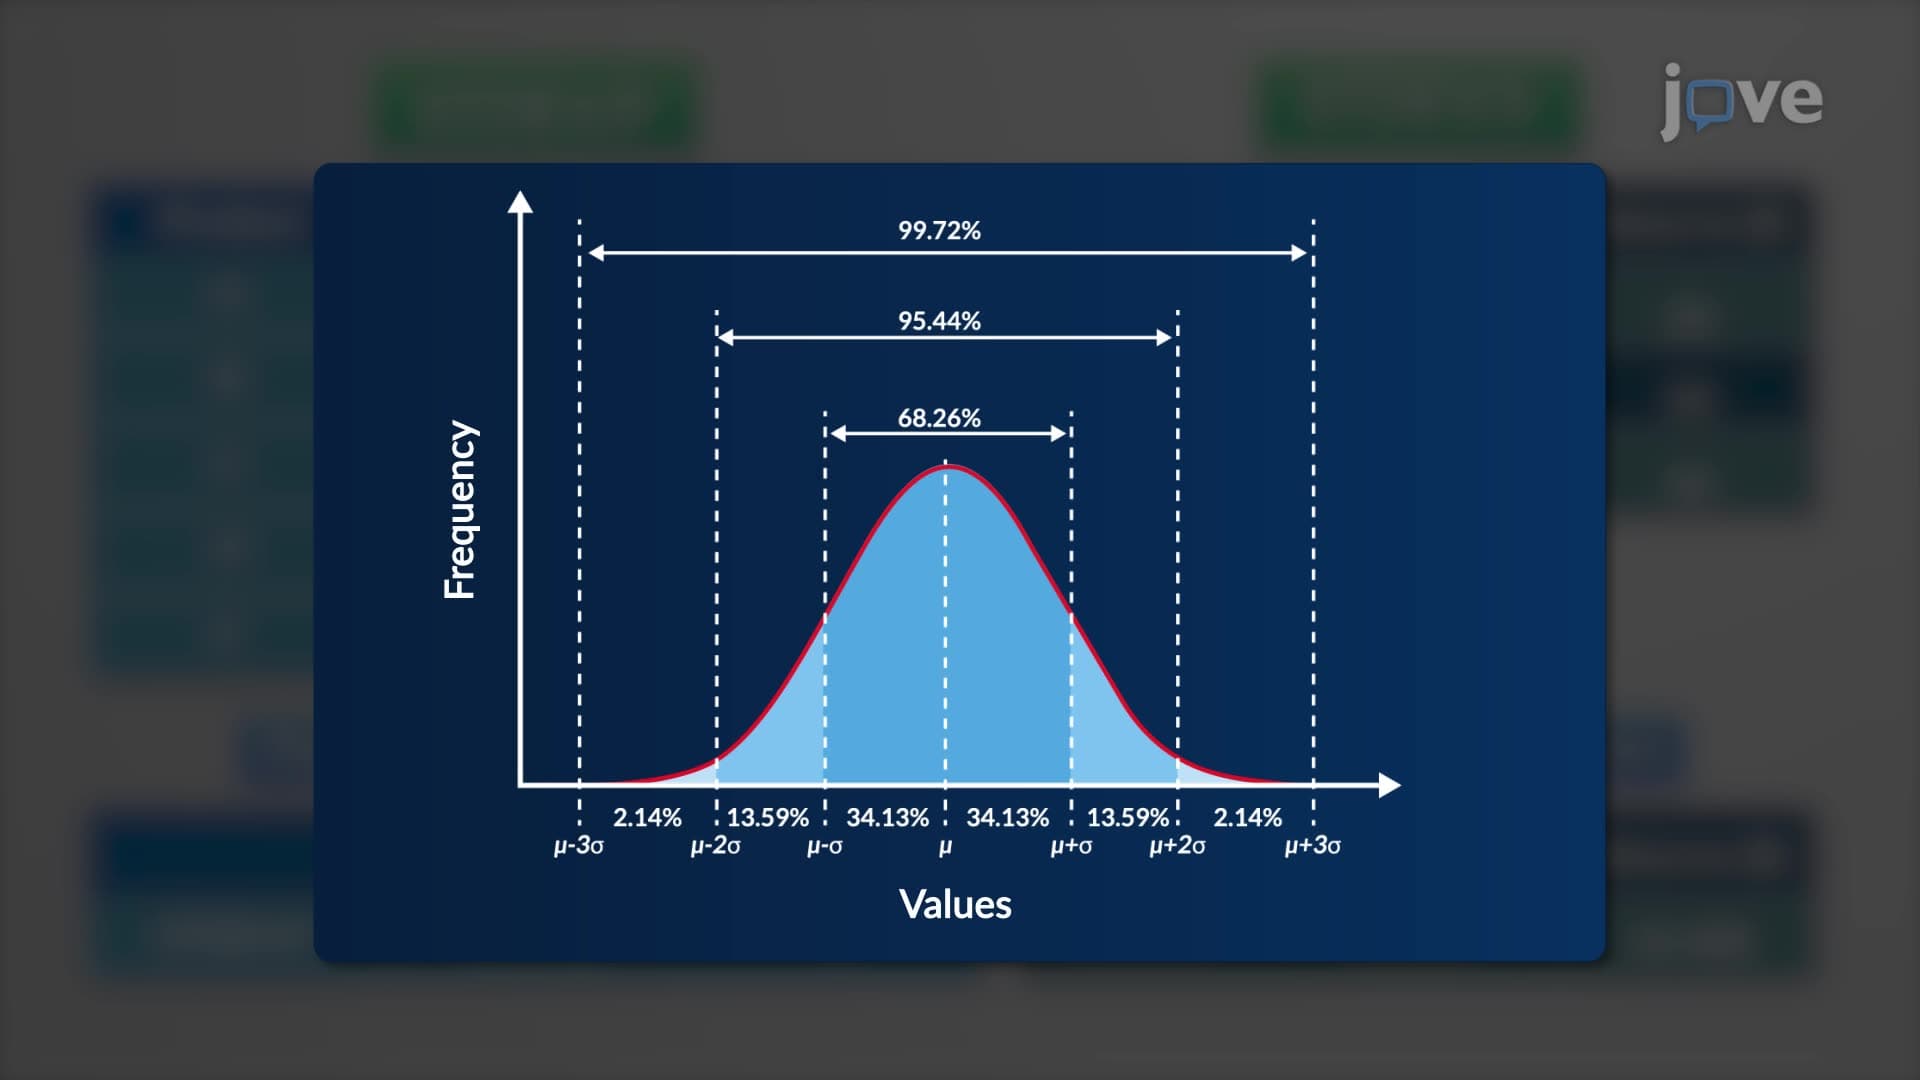
Beyond basic central tendency, Excel's SKEW and KURT functions provide deeper insights into data distribution characteristics. Skewness values near zero indicate symmetrical distributions, while positive skewness suggests data concentration toward lower values with extended right tails-common in income distribution studies. Negative skewness indicates the opposite pattern.
Kurtosis measurements reveal distribution "peakedness" compared to normal distributions. Positive kurtosis values indicate sharp peaks with more data in the tails, while negative values suggest flatter distributions with data concentrated around the center. These concepts prove essential for students advancing to inferential statistics and research methodology courses.
Mastering these Excel functions requires understanding proper data selection and interpretation. Students should practice with diverse datasets, from sports statistics to economic indicators, ensuring they can select appropriate ranges and interpret results contextually. This foundation proves invaluable for college-level statistics courses and standardized exams like the MCAT, where data interpretation skills are assessed.
Related Micro-courses