Loading video…


 16 Concepts
 15.9K views

Video Summary: What Is R
Did you know that over 40% of data scientists at Fortune 500 companies rely on the same programming language that started as a university research project? R is an open-source software environment for statistical computing and graphics that has revolutionized how researchers analyze data across fields like biostatistics, econometrics, and social sciences. From analyzing clinical trial data at the CDC to modeling economic trends at the Federal Reserve, R powers critical decision-making in American institutions. What is R becomes clear when you see its impact on modern data analysis and research methodologies. Watch the full video on JoVE Coach to master this concept with expert-led visuals and step-by-step explanations.
R represents one of the most influential developments in statistical computing over the past three decades. Named both as a tribute to its creators (Ross Ihaka and Robert Gentleman) and as a reference to the S language from Bell Telephone Laboratories, R has evolved from an academic project into the backbone of data analysis across numerous industries and research institutions.
The R definition encompasses several critical components that distinguish it from other statistical software. At its foundation, R provides sophisticated data structures including vectors, matrices, data frames, and lists that enable researchers to organize and manipulate complex datasets efficiently. The environment includes a comprehensive suite of mathematical operators designed specifically for statistical analysis, from basic arithmetic to advanced matrix operations.
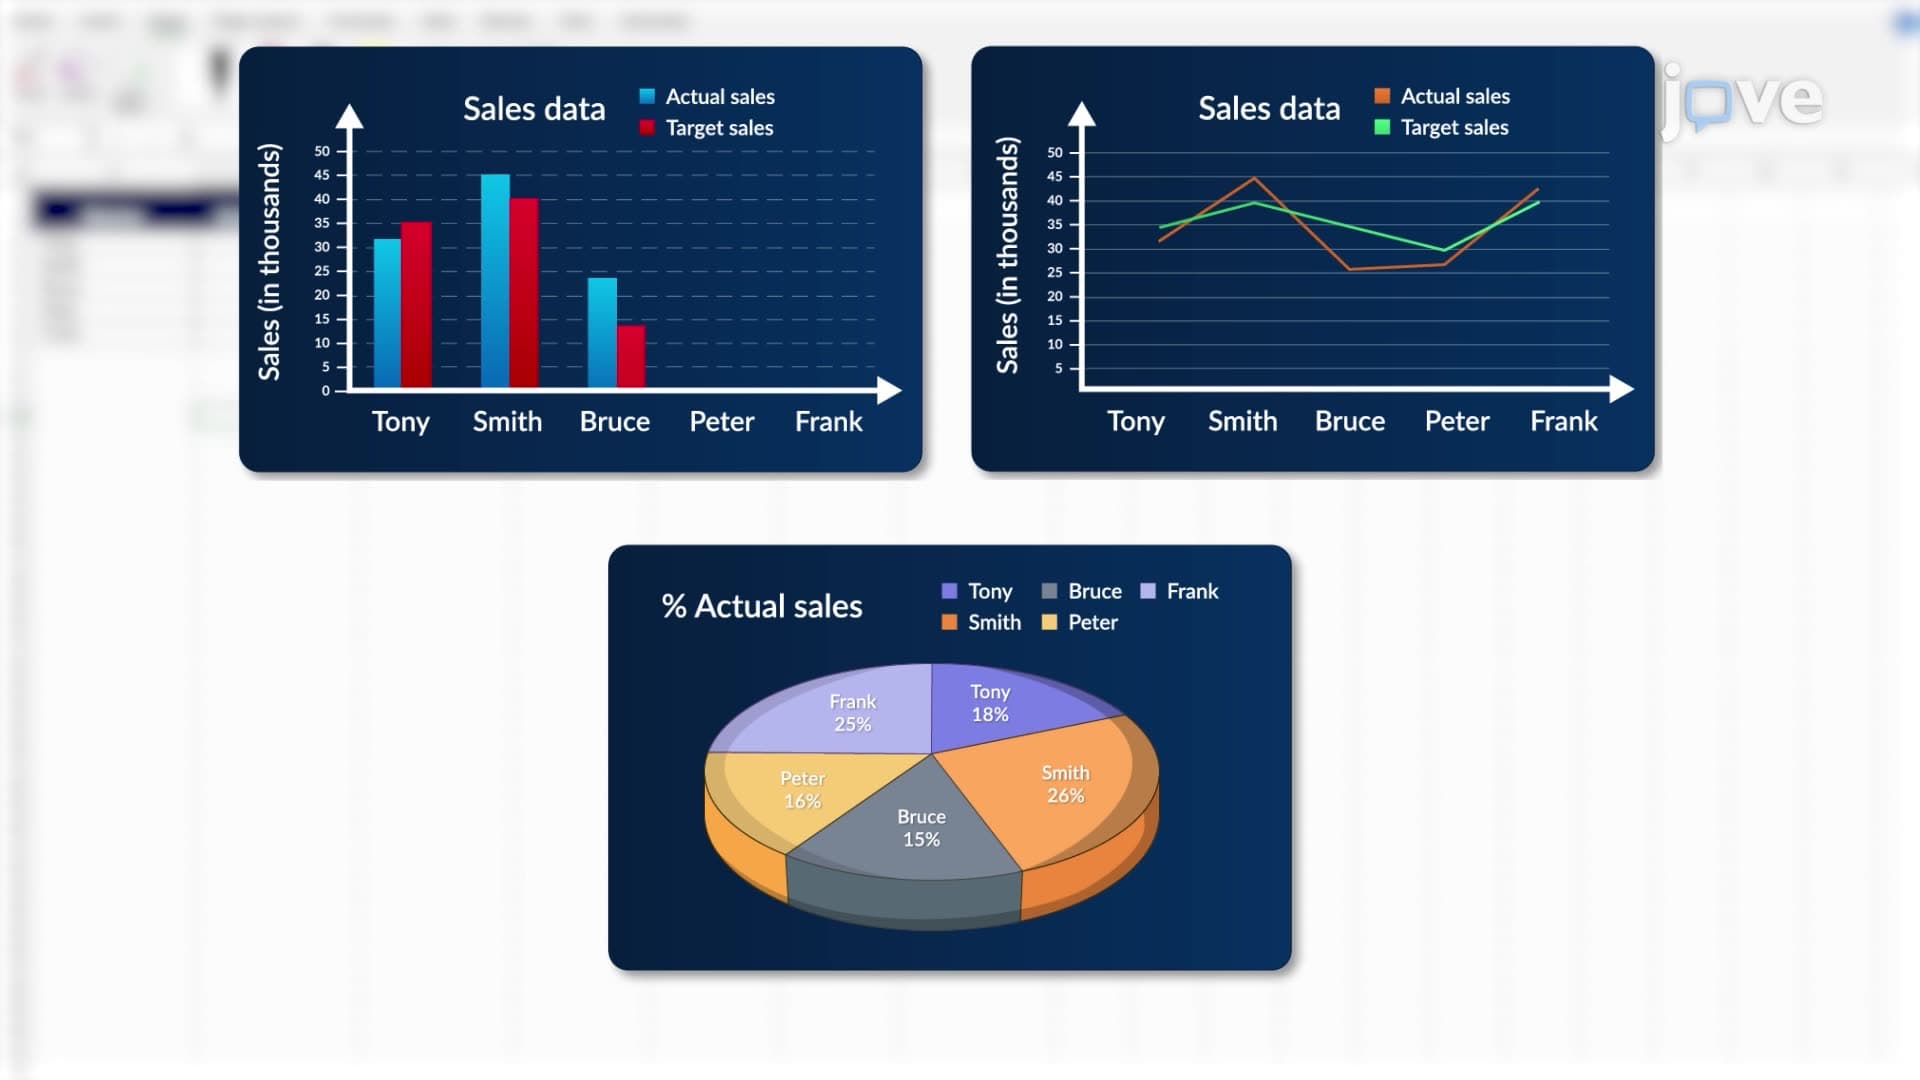
R's graphical capabilities represent another cornerstone of its functionality. Unlike many statistical packages that treat visualization as an afterthought, R integrates plotting and data visualization as fundamental components. This integration allows researchers at institutions like Johns Hopkins Bloomberg School of Public Health to create publication-ready figures directly within their analysis workflow.
What is R in detail becomes apparent when examining its open-source ecosystem. This model has fostered an unprecedented level of collaboration, with statisticians, data scientists, and researchers worldwide contributing packages that extend R's capabilities. The Comprehensive R Archive Network (CRAN) hosts thousands of specialized packages covering everything from genomic analysis to financial modeling.
This community-driven development means that cutting-edge statistical techniques often appear in R before being implemented in commercial software. For students preparing for advanced coursework or standardized tests like the AP Statistics exam, understanding R's role in modern statistical practice provides valuable context for theoretical concepts.
R's versatility makes it essential across diverse fields. In biostatistics, researchers use R to analyze clinical trial data and epidemiological studies. Economics departments at universities like the University of Chicago rely on R for econometric modeling and policy analysis. Social scientists employ R for survey analysis and behavioral research.
For students, R skills prove invaluable in college statistics courses, research projects, and eventual career paths. Many undergraduate programs now incorporate R training into their curriculum, recognizing its importance in preparing students for graduate study and professional work in data-driven fields.
While R offers tremendous capabilities, students should understand its learning curve differs significantly from point-and-click statistical software. The command-line interface requires users to write code, which initially challenges students accustomed to graphical interfaces. Additionally, R's memory management can become problematic with extremely large datasets, though this limitation rarely affects typical academic applications.
Related Micro-courses