Loading video…


 16 Concepts
 15.9K views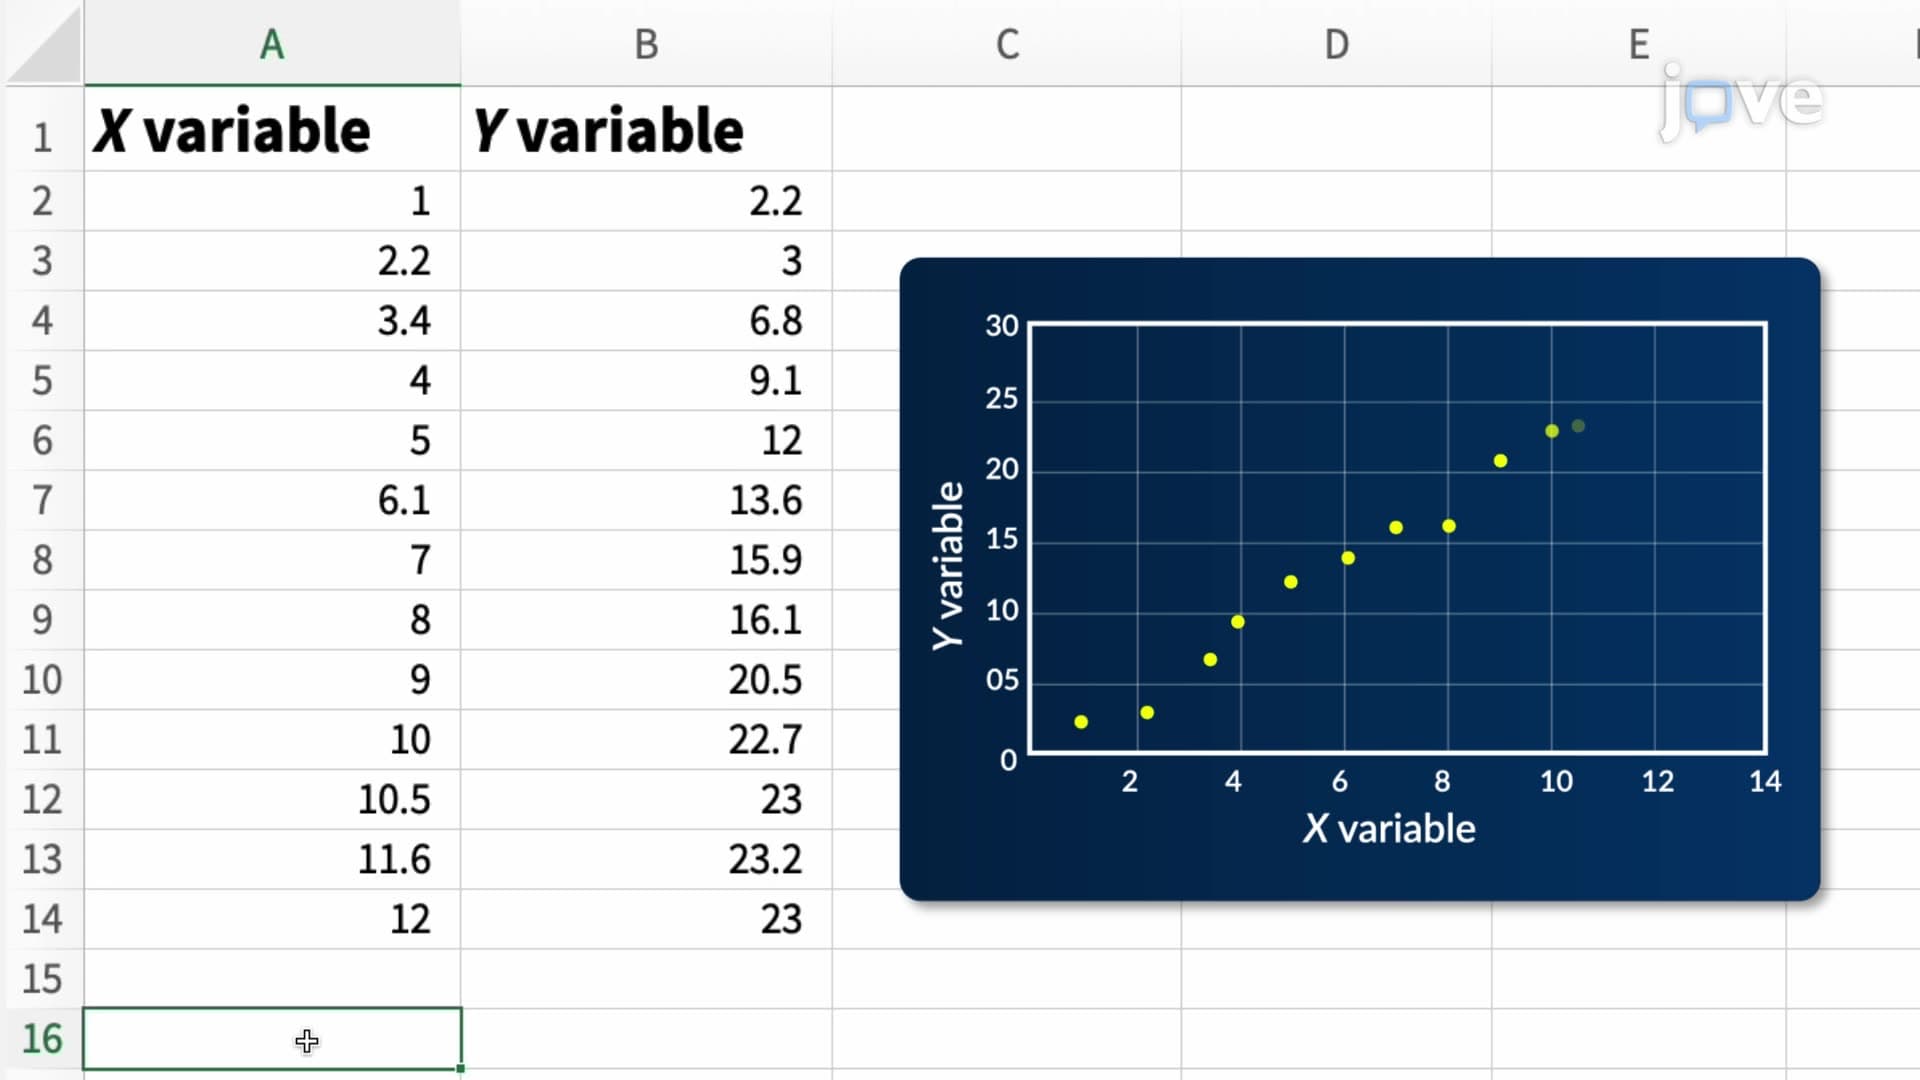

Video Summary: What Is Microsoft Excel Regression Analysis
Did you know that Netflix uses regression analysis to predict which shows you'll binge-watch next? Microsoft Excel regression analysis is a powerful statistical tool that helps identify relationships between variables and make data-driven predictions. Students at MIT's Sloan School of Management routinely use Excel's LINEST and FORECAST.LINEAR functions to analyze everything from stock prices to consumer behavior patterns. What is Microsoft Excel Regression Analysis becomes clearer when you see how easily it transforms raw data into actionable insights. Watch the full video on JoVE Coach to master this concept with expert-led visuals and step-by-step explanations.
What is Microsoft Excel Regression Analysis? At its core, it's a statistical method that examines the relationship between one dependent variable and one or more independent variables. Excel provides several built-in functions that make regression analysis accessible to students and professionals without requiring specialized statistical software. This approach is particularly valuable for high school AP Statistics students and college undergraduates studying business analytics or data science.
The foundation of Excel regression analysis lies in identifying patterns within data sets. When variables show a linear relationship, we can create mathematical models that predict future outcomes. For example, a retail company might analyze how advertising spend (independent variable) affects monthly sales (dependent variable). Excel's regression tools help quantify this relationship and provide predictive capabilities.
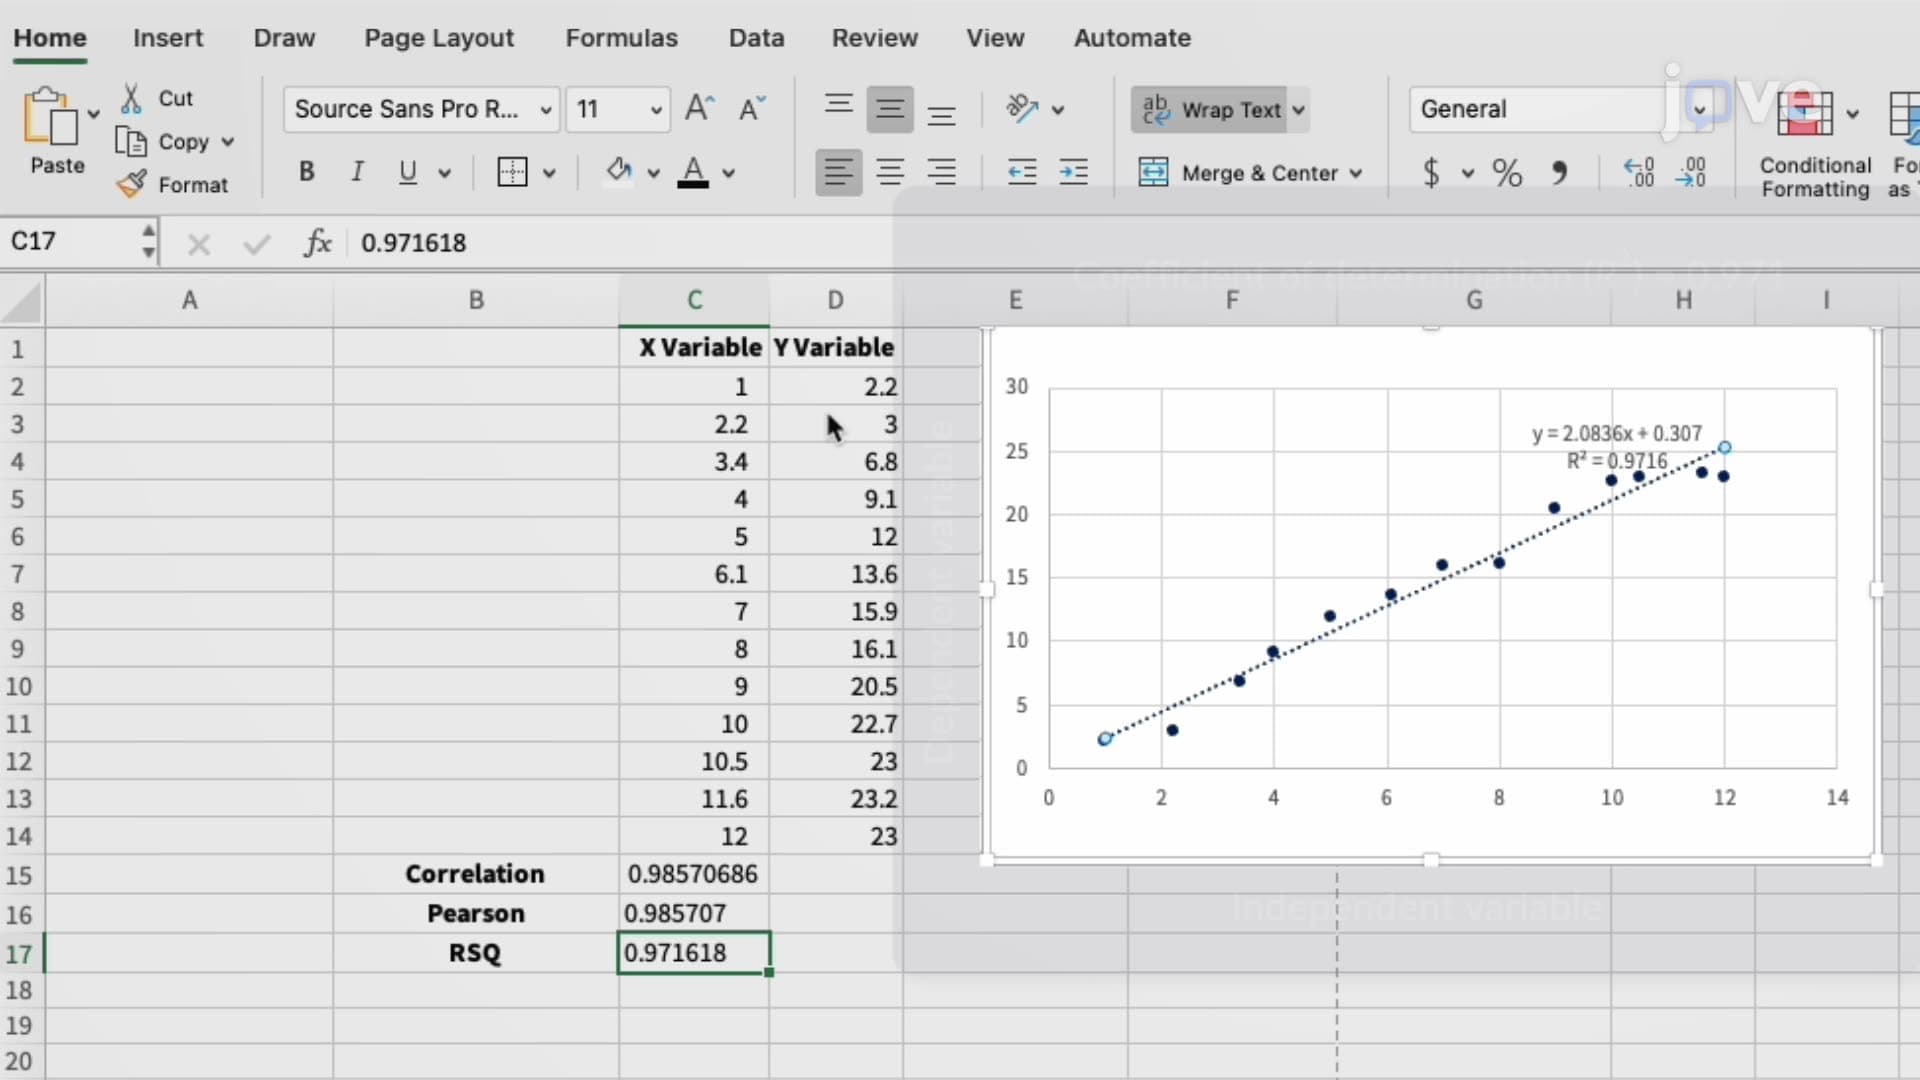
The LINEST function serves as Excel's primary tool for linear regression calculations. This function returns critical statistics including the slope and y-intercept of the best-fit line through your data points. Understanding these values is crucial for AP Statistics students, as they frequently appear on College Board exams. The slope indicates how much the dependent variable changes for each unit increase in the independent variable, while the y-intercept shows the predicted value when the independent variable equals zero.
FORECAST.LINEAR offers another approach, specifically designed for prediction tasks. This function excels when you need to estimate future values based on existing trends. Business students at universities like Wharton and Kelley School of Business regularly use this function for market analysis projects. The syntax requires specifying the target X-value and the known X and Y arrays, making it straightforward for predictive modeling.
Excel regression analysis appears extensively in standardized testing environments. SAT Subject Tests in Mathematics Level 2 often include regression problems, while AP Statistics students must demonstrate proficiency with correlation and regression concepts. College-level courses in economics, psychology, and business rely heavily on these analytical skills.
Professional applications span numerous industries. Healthcare organizations use regression analysis to predict patient outcomes and resource allocation needs. The pharmaceutical industry employs these techniques during clinical trials to analyze drug effectiveness. Financial institutions apply regression models for risk assessment and investment portfolio optimization. These real-world applications make Excel regression analysis an essential skill for students entering STEM and business careers.
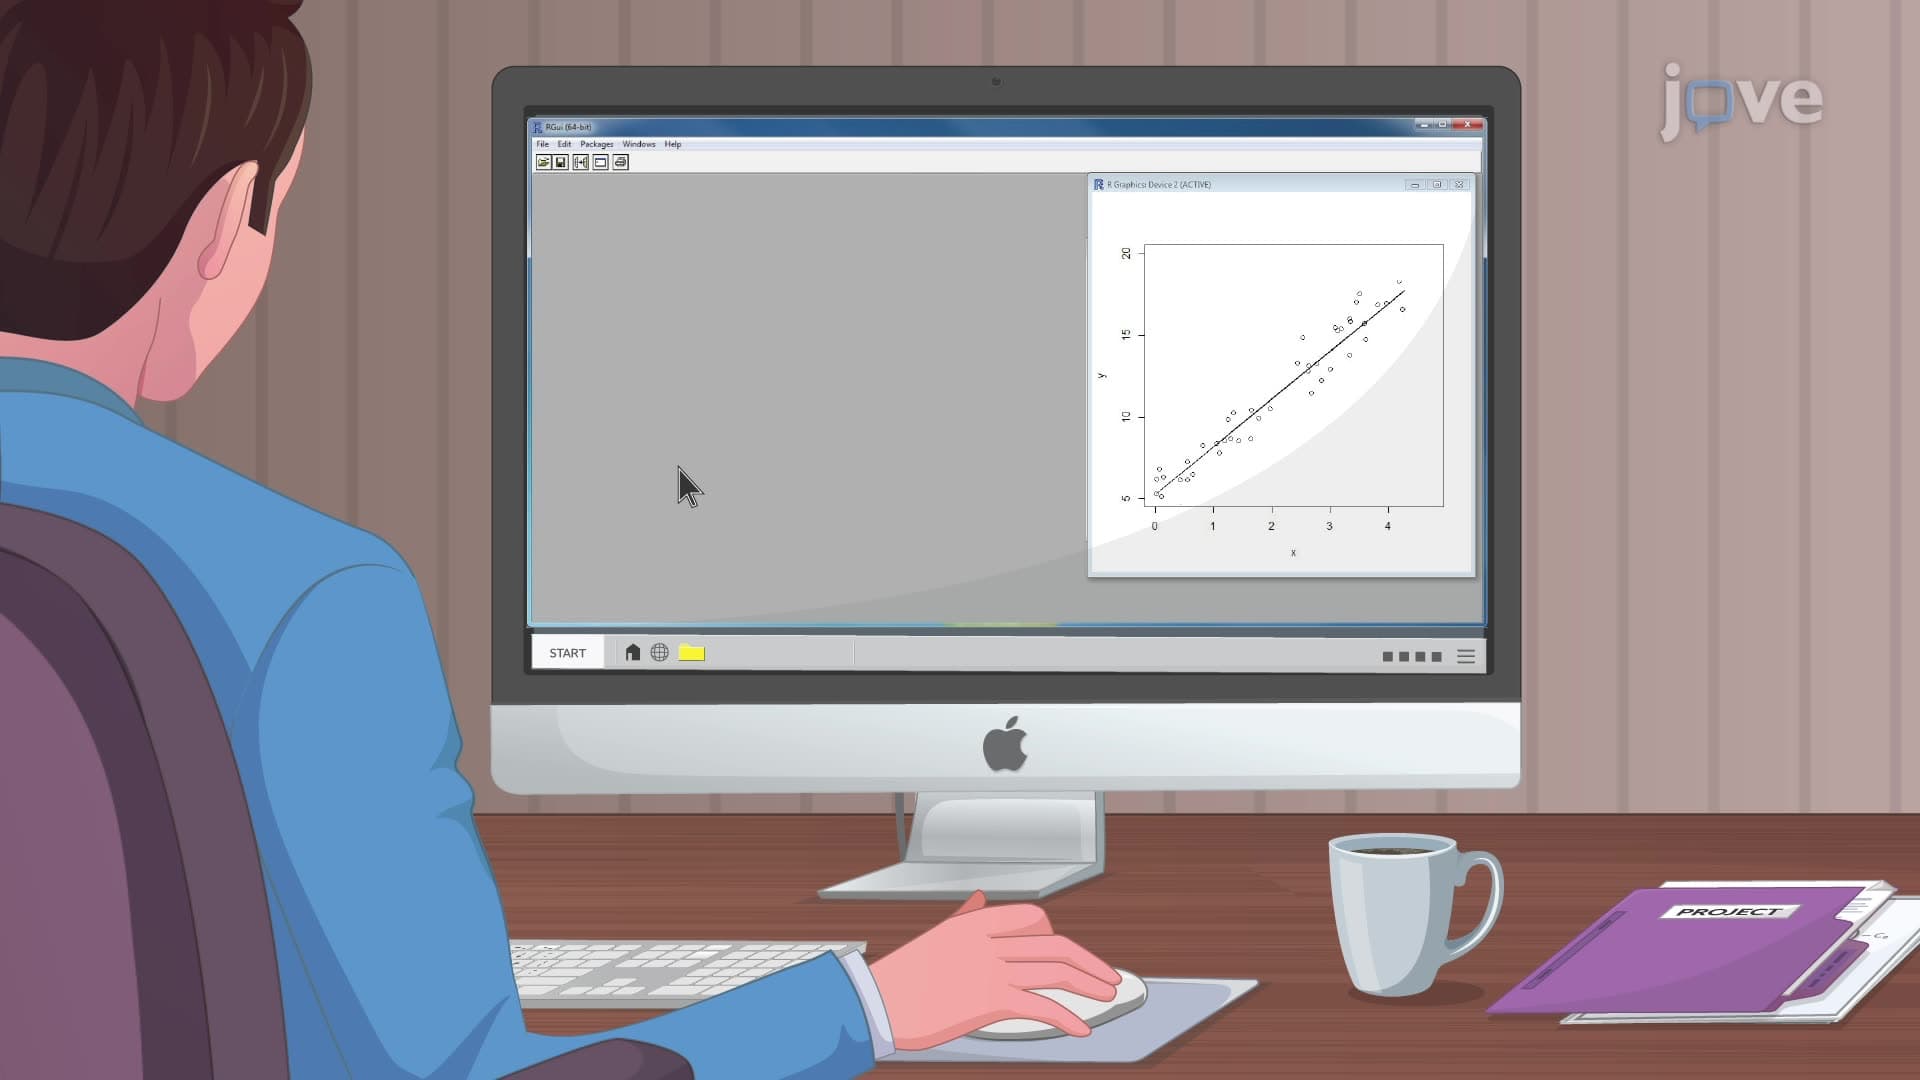
Successful regression analysis requires understanding underlying assumptions. Linear relationships work best when data points cluster around a straight line, residuals show random distribution, and outliers don't unduly influence results. Students preparing for advanced placement exams should recognize when these conditions aren't met and understand alternative approaches.
Excel's regression capabilities extend beyond simple linear models. Multiple regression analysis allows examination of several independent variables simultaneously, while polynomial regression addresses curved relationships. These advanced techniques prepare students for graduate-level coursework and professional data analysis roles.
Related Micro-courses