Loading video…

 16 Concepts
 15.9K views

Video Summary: Microsoft Excel Pearsons Correlation Explained
Did you know that 89% of Fortune 500 companies use correlation analysis to predict market trends? Microsoft Excel Pearson's correlation provides a powerful statistical tool that measures the strength of relationships between variables, like analyzing how SAT scores relate to college GPA performance across thousands of US students. This Microsoft Excel Pearson's Correlation Explained concept reveals how to calculate and interpret correlation coefficients using Excel's built-in functions. Watch the full video on JoVE Coach to master this concept with expert-led visuals and step-by-step explanations.
Microsoft Excel Pearson's correlation represents one of the most fundamental statistical analyses available to students and professionals. This correlation coefficient, developed by Karl Pearson, quantifies the linear relationship strength between two continuous variables, providing values ranging from -1.0 to +1.0. In Excel, this analysis becomes accessible through built-in functions that eliminate complex manual calculations while maintaining statistical rigor.
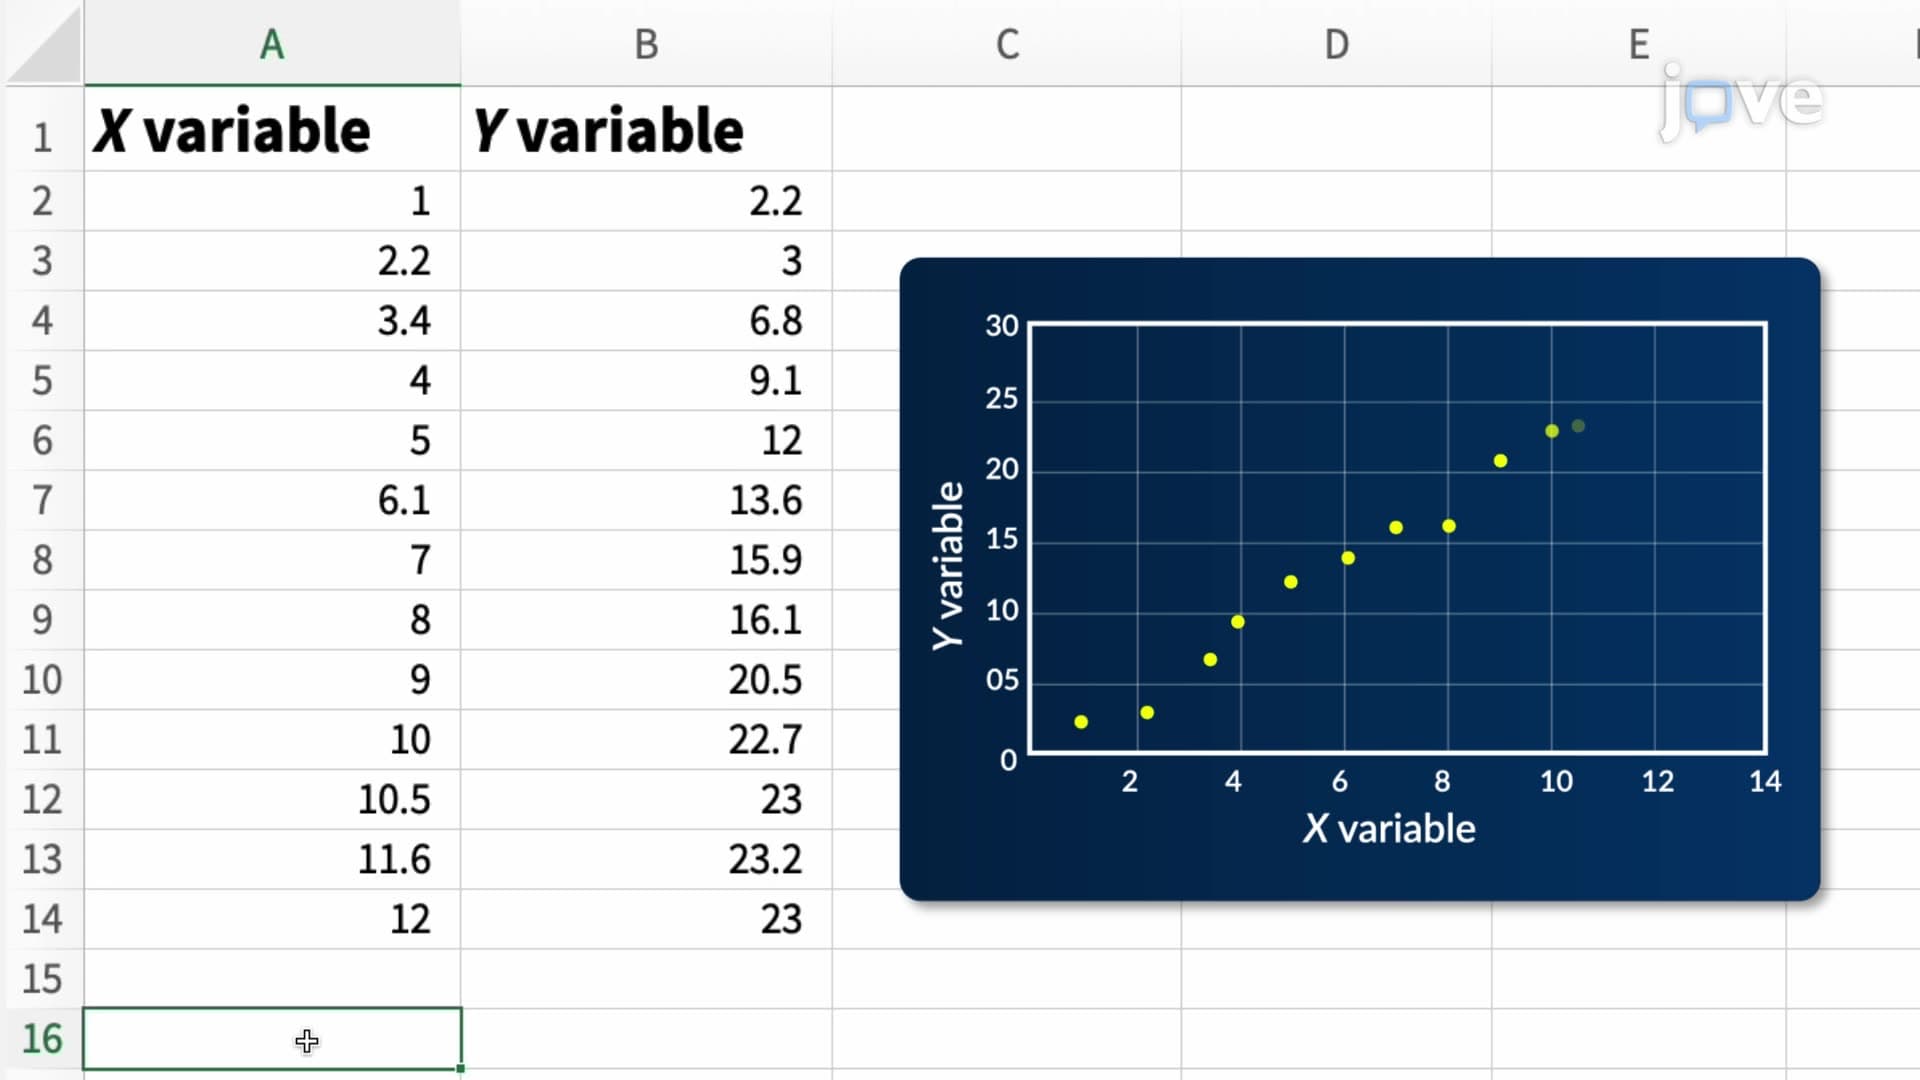
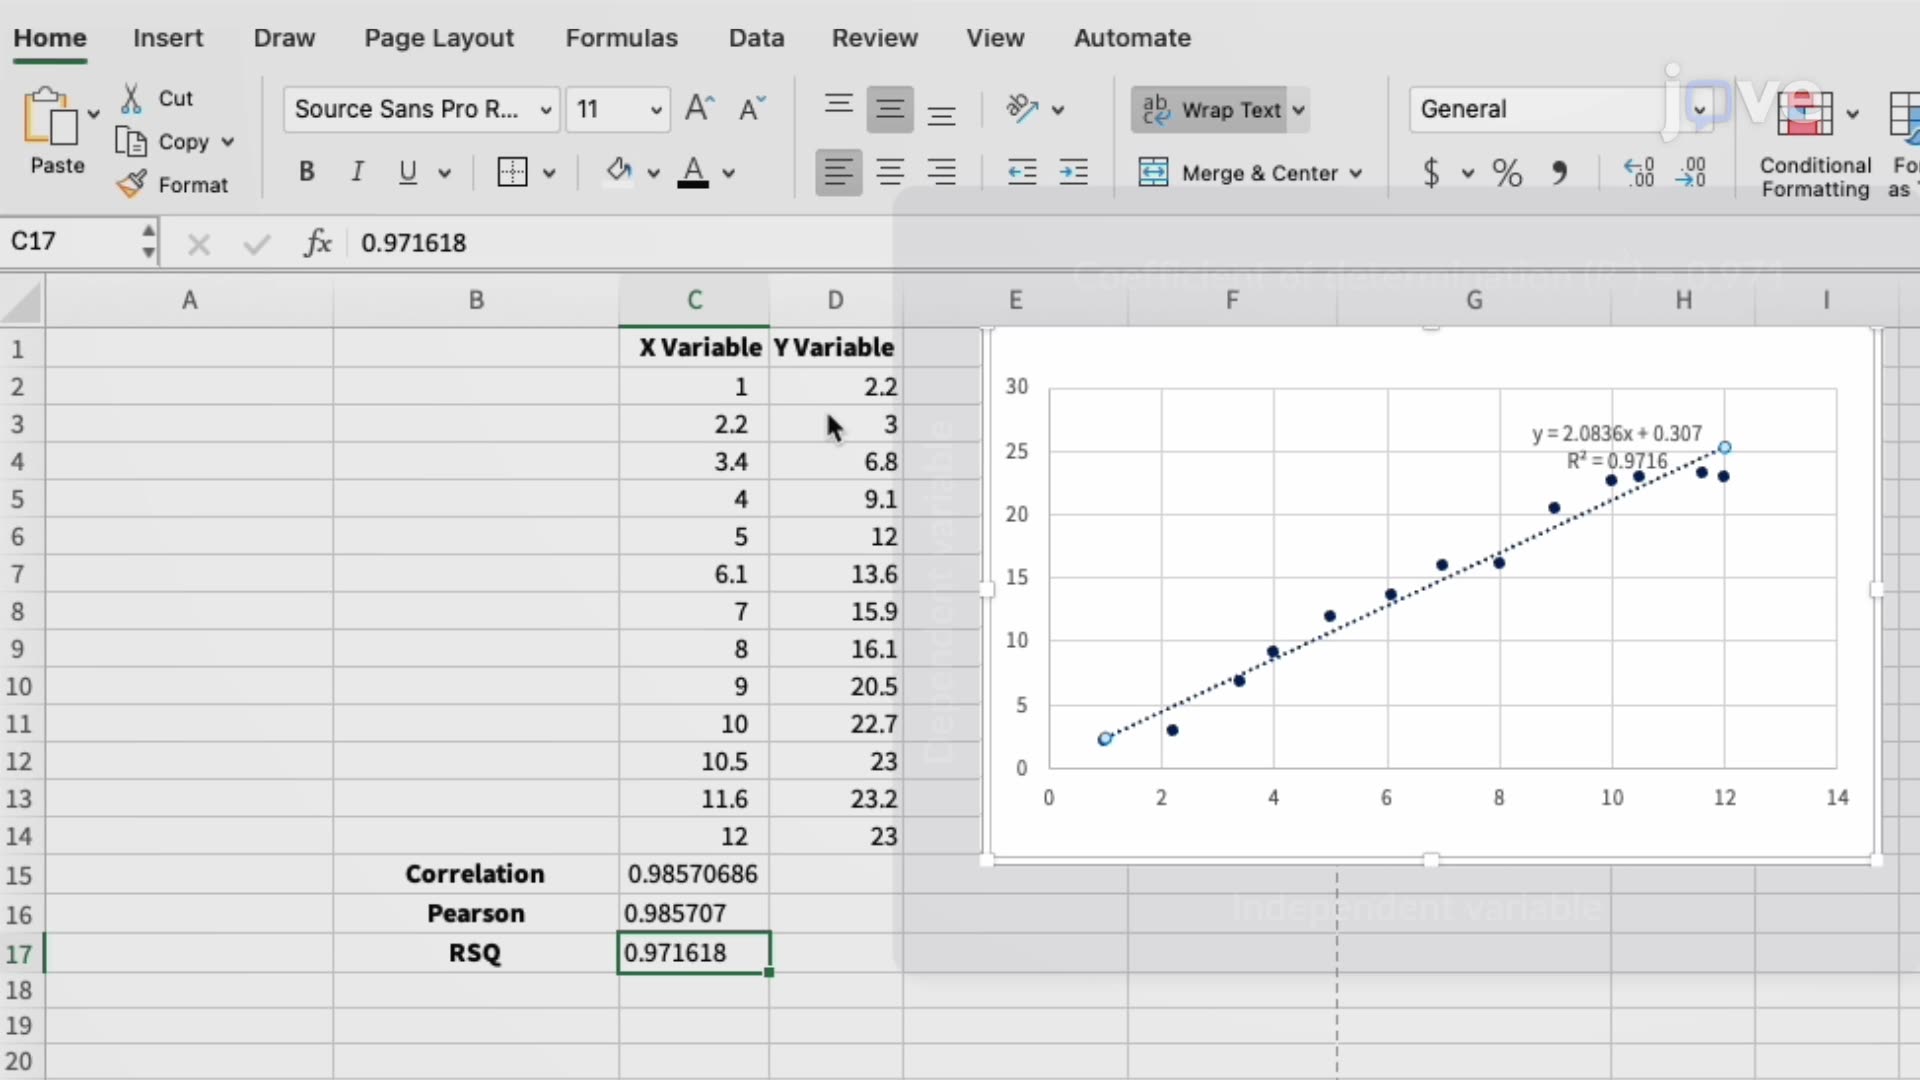
Excel provides two primary functions for Pearson's correlation: CORREL() and PEARSON(). Both functions return identical results, measuring linear relationship strength between variable pairs. The syntax requires selecting two data ranges: =CORREL(array1,array2). For example, analyzing the relationship between hours studied and exam scores across 100 US high school students would involve placing study hours in column A and test scores in column B, then applying =CORREL(A:A,B:B).
The RSQ() function complements correlation analysis by calculating the coefficient of determination (R-squared). This value represents the proportion of variance in the dependent variable explained by the independent variable. An R-squared value of 0.85 indicates that 85% of the variation in exam scores can be explained by study hours, making this metric crucial for AP Statistics students and college research projects.
Correlation strength interpretation follows established statistical guidelines. Values between 0.70-1.00 indicate strong positive relationships, while 0.30-0.69 suggests moderate correlation. Negative values follow the same strength patterns but indicate inverse relationships. For instance, analyzing US unemployment rates versus consumer spending typically yields strong negative correlations (-0.75 to -0.85), meaning higher unemployment correlates with reduced spending.
Understanding microsoft excel pearson's correlation tutorial concepts proves essential for multiple academic contexts. AP Statistics examinations frequently test correlation interpretation skills, while college psychology and business courses require students to analyze survey data using correlation matrices. Medical school applicants encounter correlation analysis on MCAT practice questions, particularly when interpreting research study results.
US business applications include market research correlation studies, such as analyzing social media engagement versus sales conversion rates. Healthcare professionals use correlation analysis to identify relationships between patient lifestyle factors and health outcomes, making this Excel skill valuable across STEM and social science disciplines.
Related Micro-courses