Loading video…


 16 Concepts
 15.9K views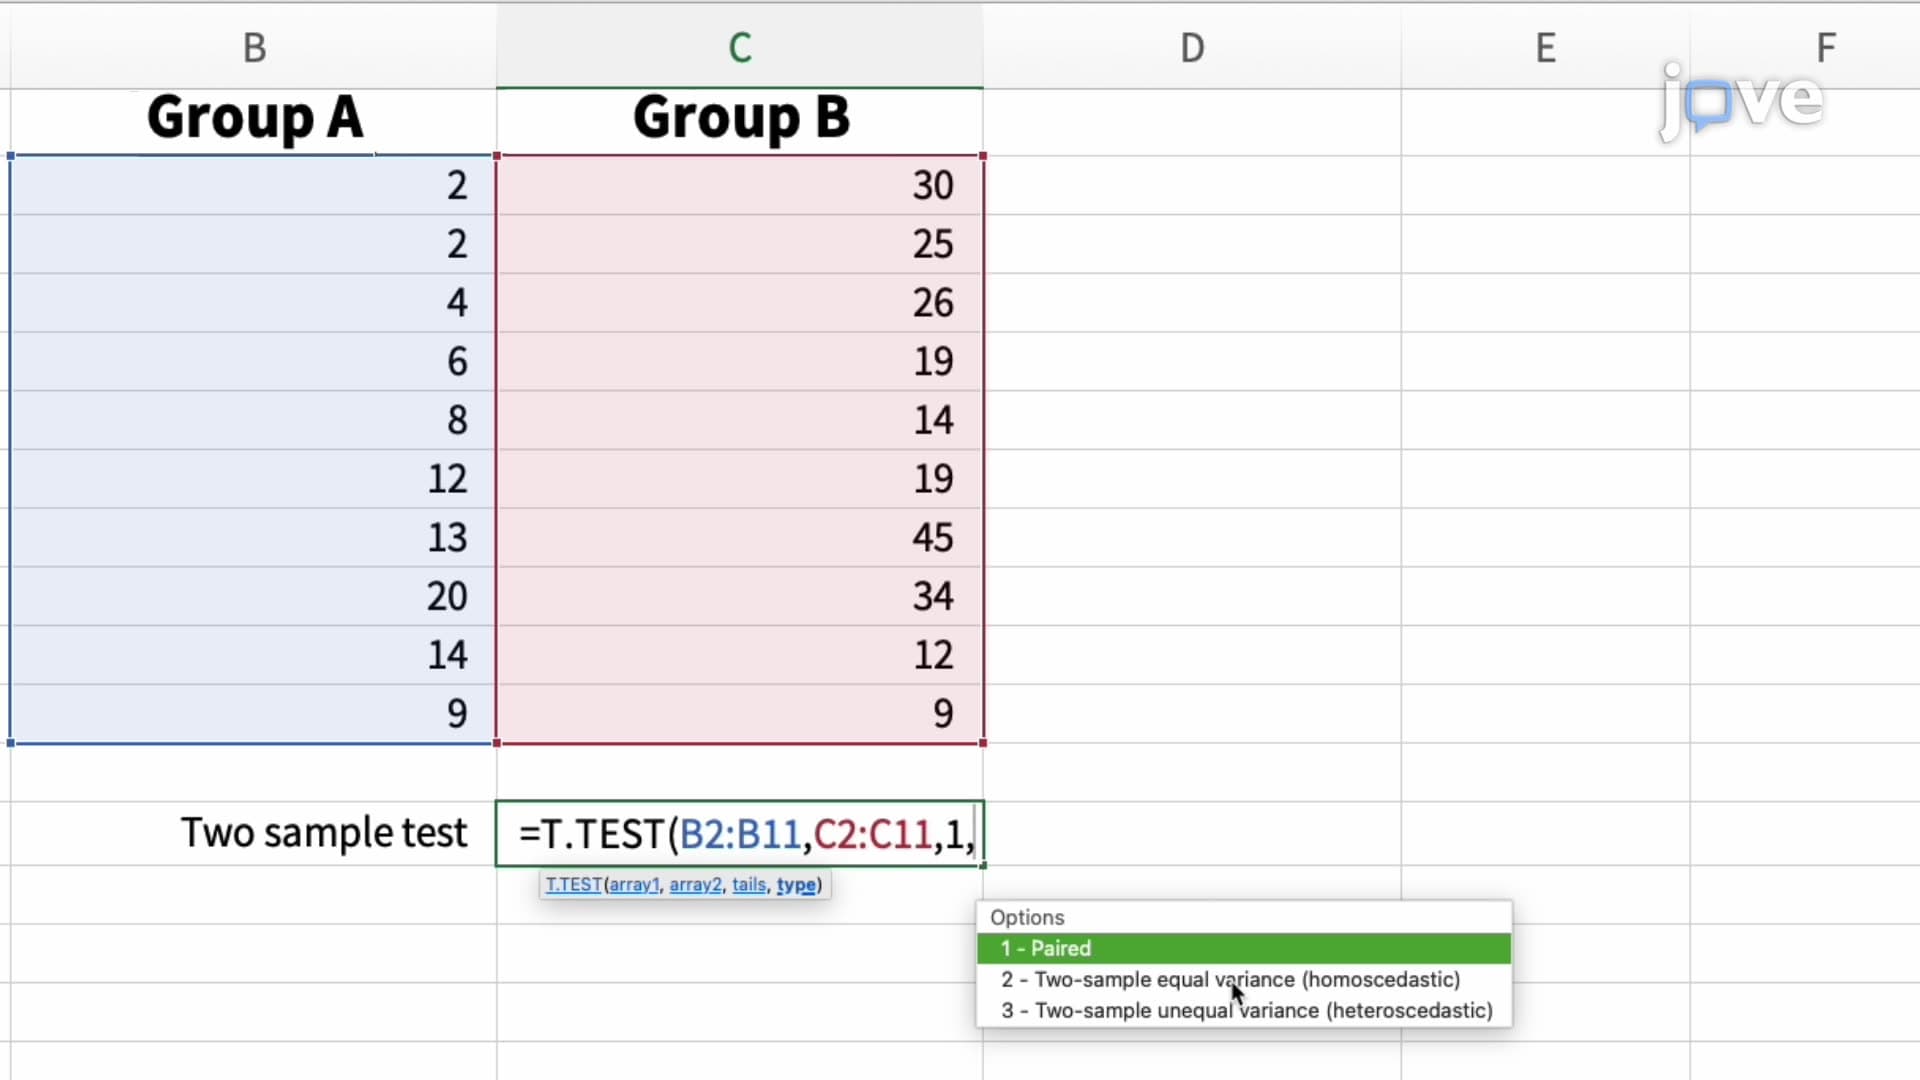

Video Summary: Performing Student S T Test in Microsoft Excel
Did you know that pharmaceutical companies like Pfizer use t-tests daily to determine if new medications outperform placebos? Performing student's t-test in Microsoft Excel empowers researchers to make these critical statistical decisions with just a few clicks. From comparing SAT scores between different teaching methods to analyzing clinical trial results at Johns Hopkins, Excel's T.TEST function streamlines complex statistical analysis for students and professionals alike. Watch the full video on JoVE Coach to master this concept with expert-led visuals and step-by-step explanations.
Performing student's t-test in Microsoft Excel transforms complex statistical analysis into an accessible process for high school and college students. The Student's t-test, developed by William Sealy Gosset (publishing under the pseudonym "Student"), addresses a fundamental question: are the differences we observe between groups statistically meaningful or simply due to random chance?
Excel's implementation makes this powerful statistical tool available without specialized software. The T.TEST function serves as your primary tool, accepting data ranges and returning probability values that determine statistical significance. This approach proves invaluable for AP Statistics students analyzing survey data or pre-med students evaluating research findings for MCAT preparation.
Excel accommodates three distinct t-test scenarios through the Type parameter in the T.TEST function. Type 1 performs paired t-tests, ideal when comparing before-and-after measurements on the same subjects-like blood pressure readings before and after medication in a clinical trial at Mayo Clinic. This requires identical sample sizes since each observation in group one corresponds directly to a specific observation in group two.
Type 2 handles two-sample t-tests assuming equal variances (homoscedastic data). Use this when comparing standardized test scores between different schools, assuming similar score distributions. Type 3 addresses unequal variances (heteroscedastic data), common when sample sizes differ significantly or when comparing fundamentally different populations, such as comparing reaction times between professional athletes and average college students.
The Array1 and Array2 parameters define your data ranges, while the Tails parameter specifies whether you're conducting a one-tailed or two-tailed test. One-tailed tests examine directional hypotheses-testing if a new teaching method improves scores rather than simply changes them. Two-tailed tests detect any significant difference, regardless of direction.
For college-level statistics courses, understanding these distinctions proves crucial for midterm success. The function returns a p-value that you compare against your significance level (typically 0.05) to determine statistical significance.
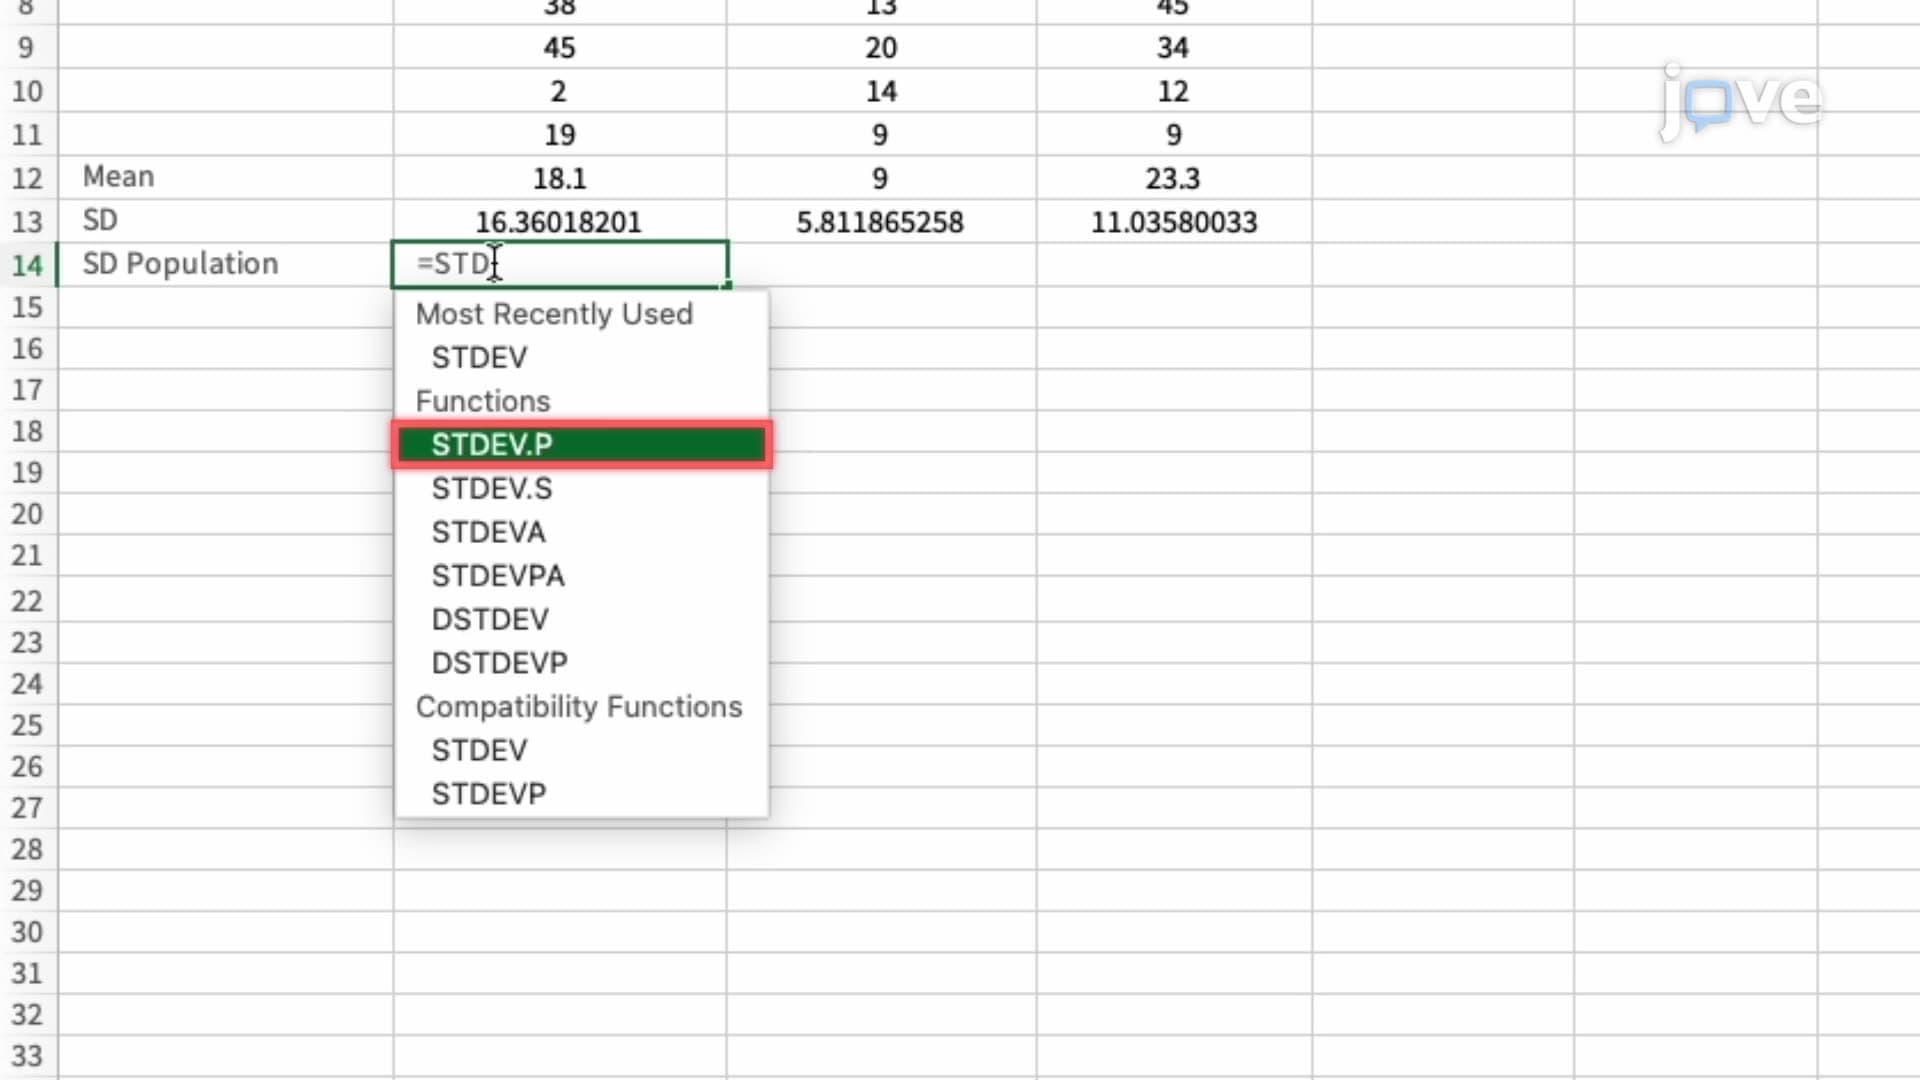
One-sample t-tests in Excel require manual setup but offer deeper understanding of underlying calculations. Calculate the sample mean, standard deviation, and count using Excel's AVERAGE, STDEV.S, and COUNT functions. The t-statistic formula becomes: t = (sample mean - population mean) / (sample standard deviation / square root of sample size).
Use T.DIST.2T for two-tailed tests or T.DIST for one-tailed tests, inputting your calculated t-statistic and degrees of freedom. This manual approach reinforces statistical concepts essential for advanced coursework and standardized exams.
Related Micro-courses