Loading video…


 15 Concepts
 8.3K views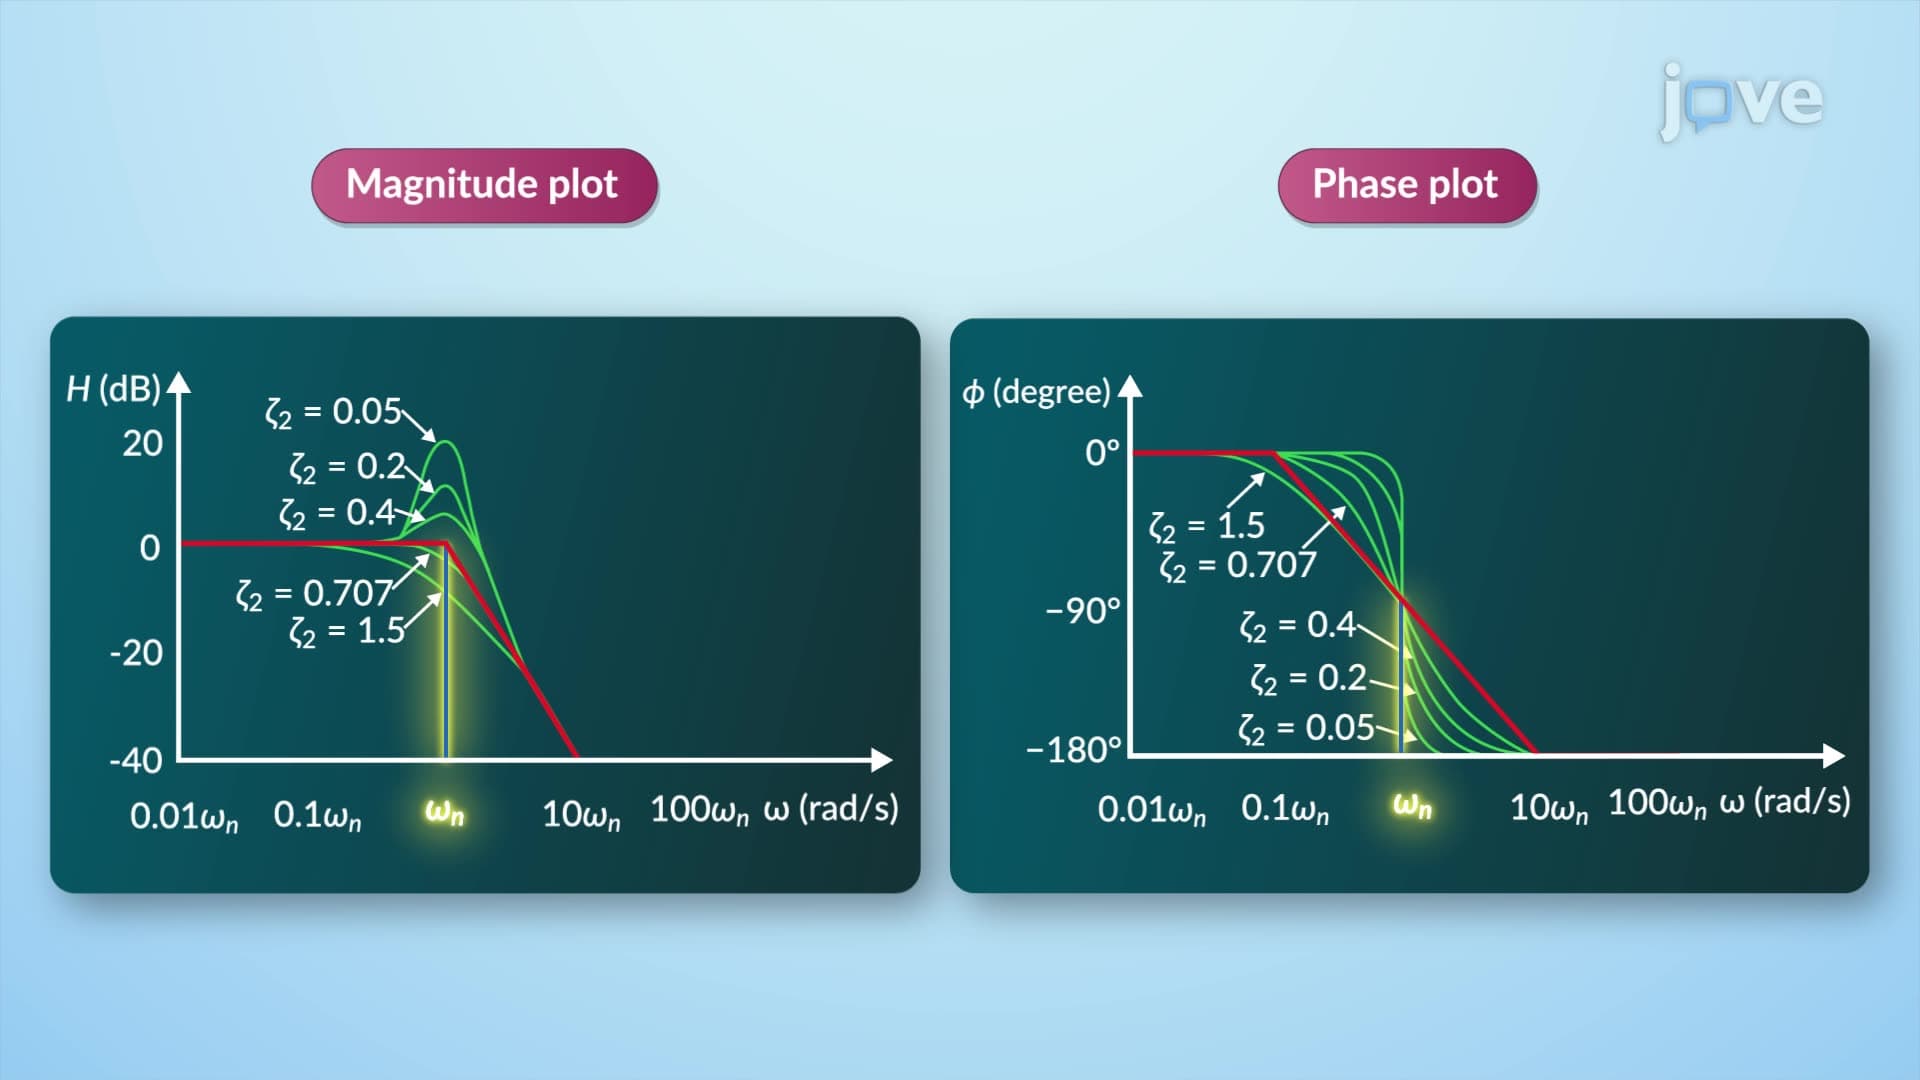

Video Summary: Transfer Function and Bode Plots Ii Explained
Ever wonder how NASA engineers predict whether a spacecraft's control system will remain stable during re-entry? Bode plots construction provides the mathematical framework to analyze system stability and frequency response in control systems. This technique helps engineers at companies like Boeing and SpaceX design reliable autopilot systems for aircraft and rockets. Transfer Function And Bode Plots II Explained demonstrates how to construct these critical plots using poles and zeros analysis. Watch the full video on JoVE Coach to master this concept with expert-led visuals and step-by-step explanations.
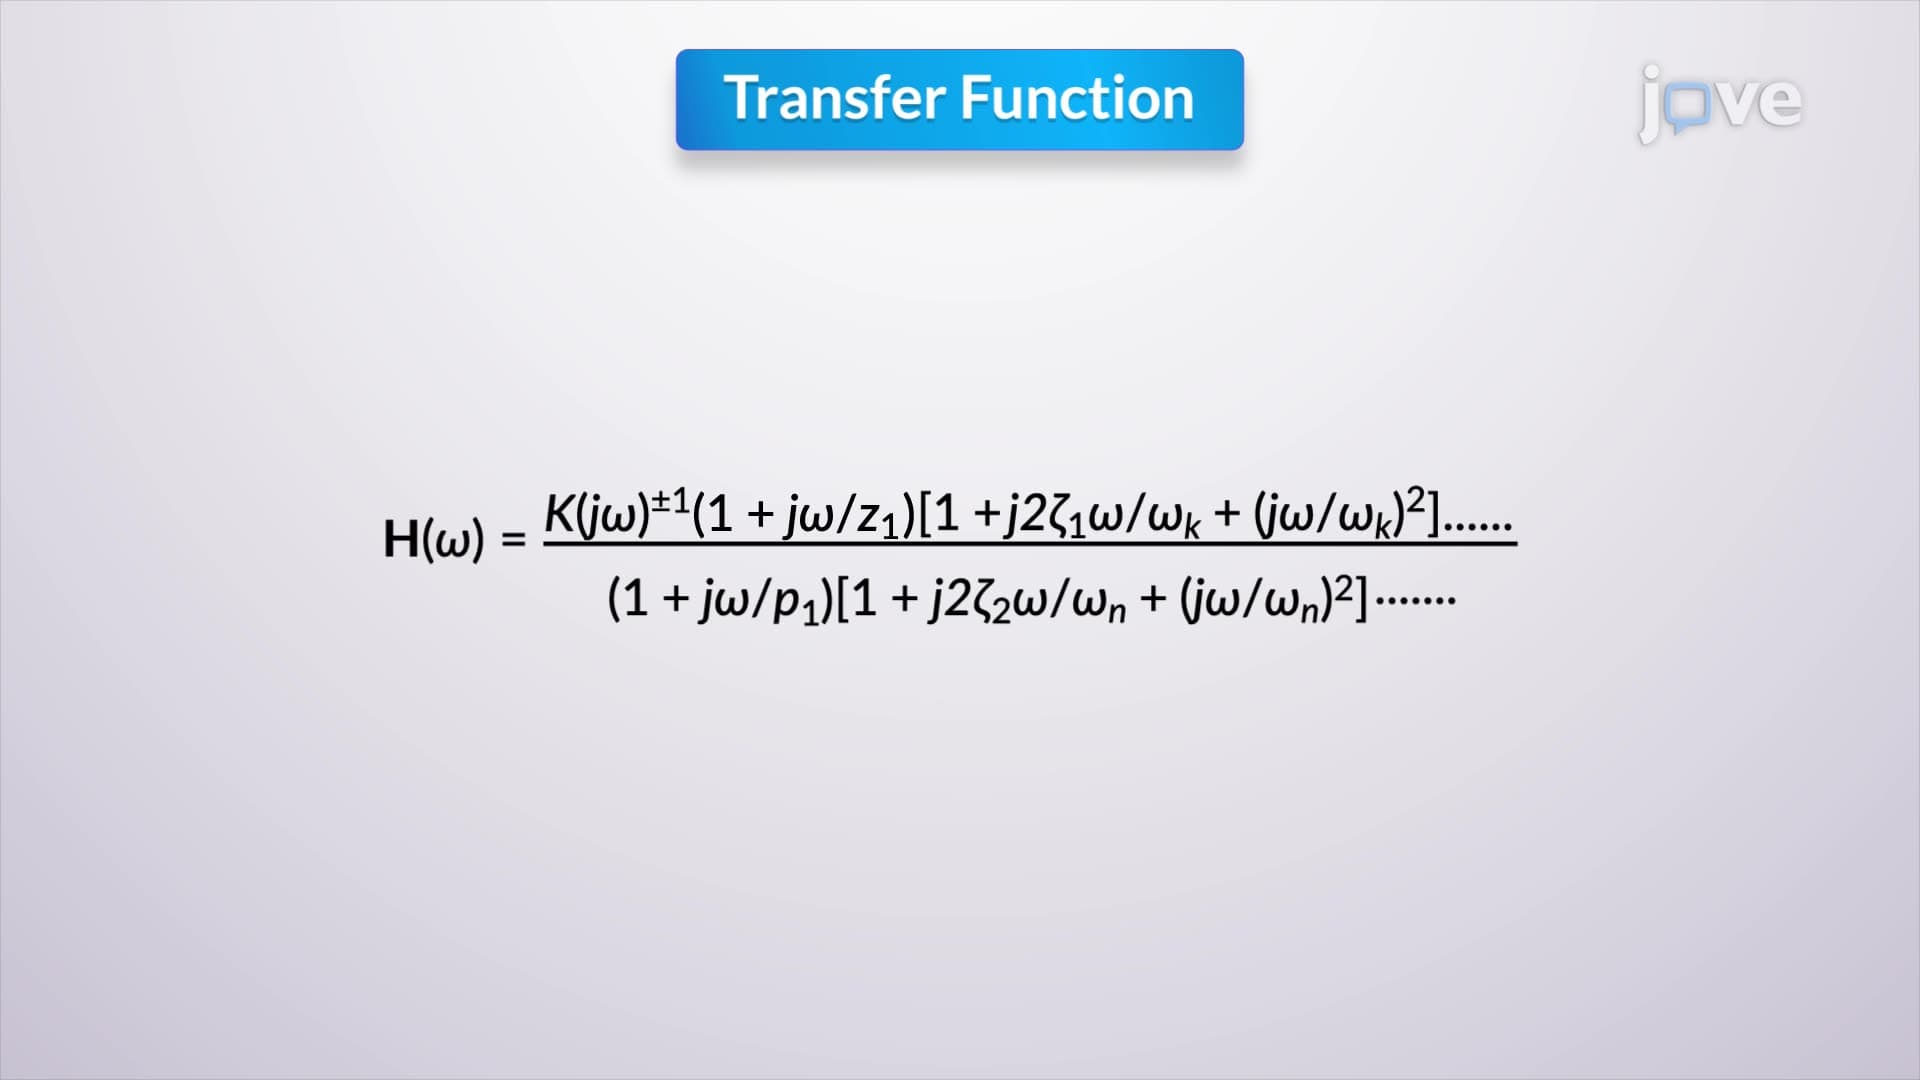
Bode plots construction represents a cornerstone technique in control systems engineering, providing engineers with a powerful graphical method to analyze system frequency response. These logarithmic plots display both magnitude (in decibels) and phase (in degrees) as functions of frequency, enabling rapid assessment of system stability and performance characteristics.
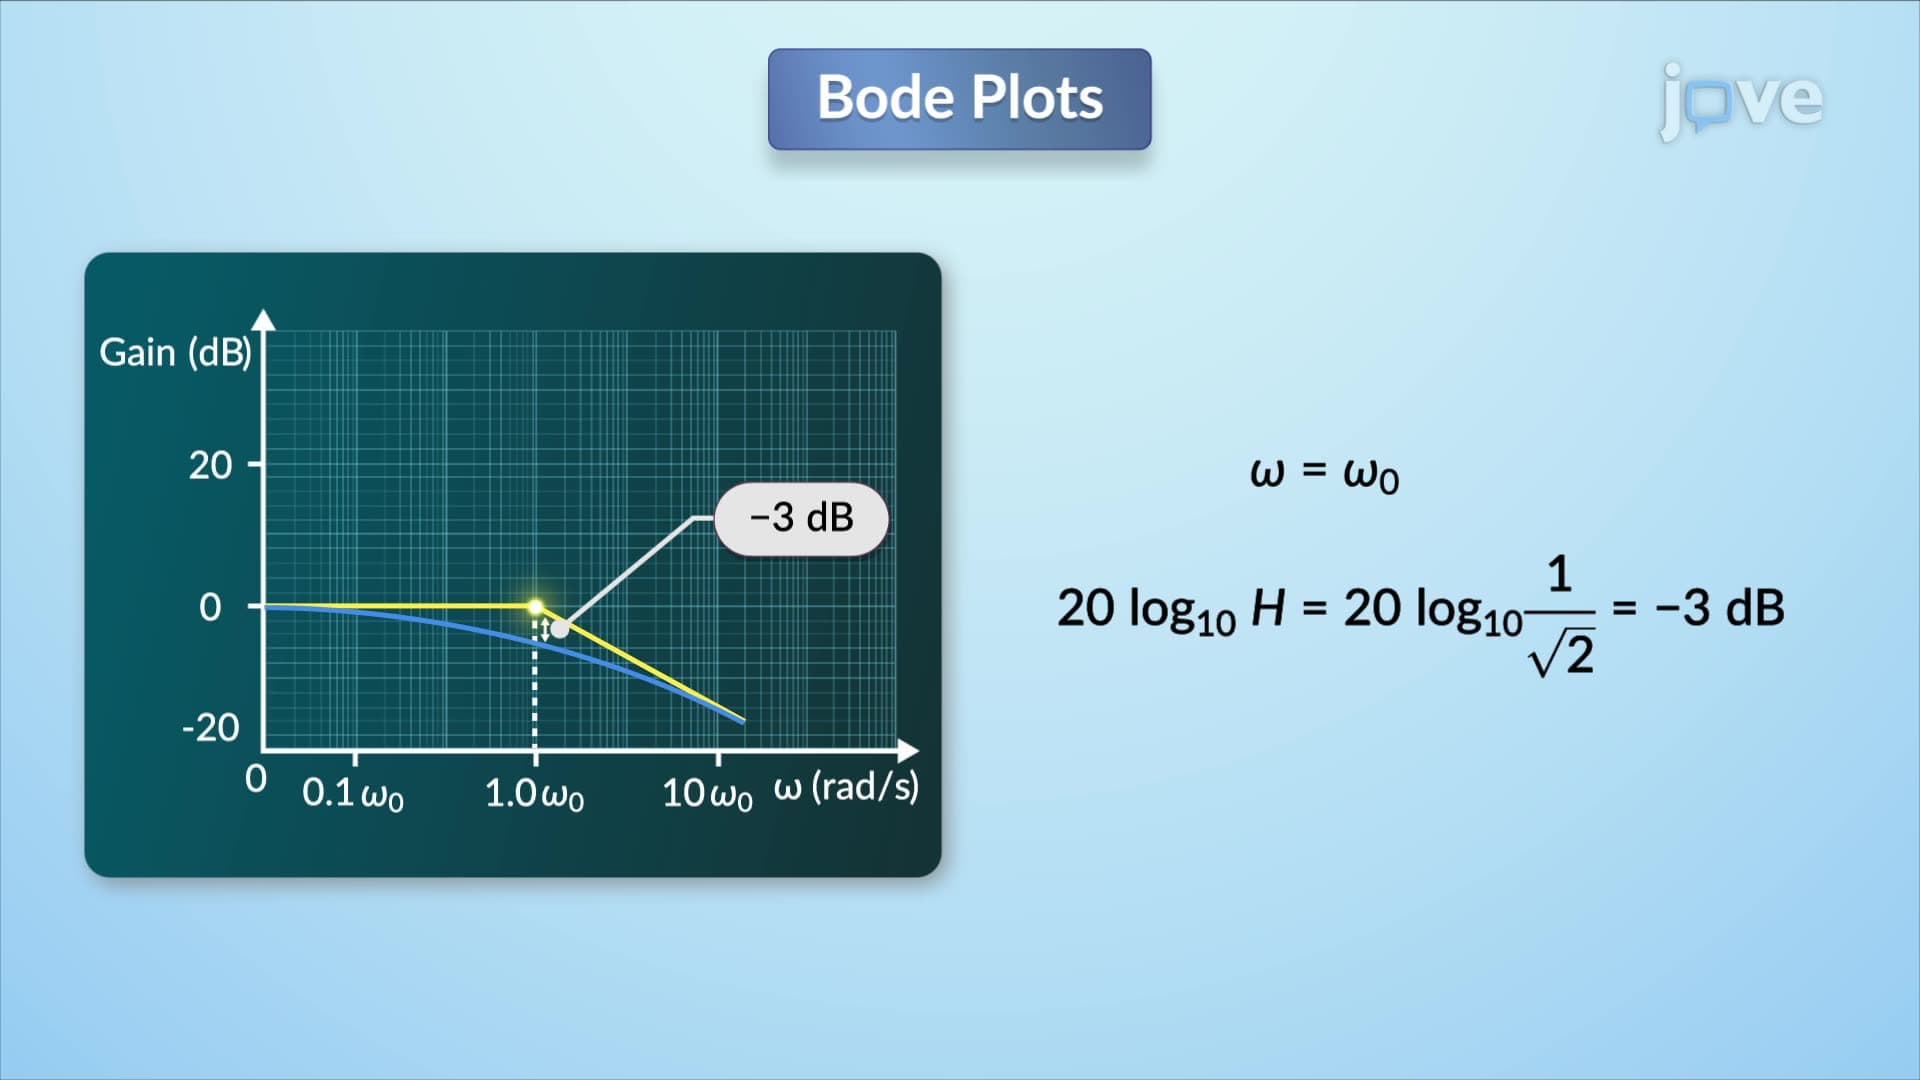
When constructing Bode plots for systems with simple zeros, engineers observe three distinct frequency regions. At low frequencies, the magnitude plot maintains a horizontal line with zero slope, while the phase approaches zero degrees. This flat response indicates that low-frequency signals pass through essentially unchanged. As frequency increases toward the corner frequency (also called the break frequency), the asymptotic magnitude begins deviating upward, and the phase shifts toward 45 degrees. Beyond the corner frequency, the magnitude plot exhibits a +20 dB/decade slope, with the phase stabilizing at 90 degrees. This behavior explains why zeros can improve system stability by adding phase lead.
Simple poles exhibit behavior that directly mirrors simple zero characteristics, but reflected about the horizontal axis. This reciprocal relationship means that where zeros provide positive slopes and phase lead, poles contribute negative slopes and phase lag. At low frequencies, both magnitude and phase approach zero. However, at the corner frequency, the magnitude begins dropping with a -20 dB/decade slope, while the phase shifts toward -90 degrees. This fundamental difference between poles and zeros helps explain why excessive poles can destabilize control systems-a critical consideration for AP Physics C students studying oscillatory motion and engineers designing servo systems for manufacturing equipment.
Quadratic pole systems introduce additional complexity through damping factor dependencies. Unlike simple poles, quadratic poles produce -40 dB/decade magnitude slopes and -180-degree phase shifts at high frequencies. The damping factor (zeta) significantly influences the magnitude plot's behavior near the corner frequency, creating either gentle curves for overdamped systems or pronounced peaks for underdamped systems. Students preparing for electrical engineering coursework at institutions like MIT or Stanford must master these concepts, as they appear frequently in control systems exams and practical circuit design projects. Multiple quadratic poles multiply these effects-two quadratic poles create -80 dB/decade slopes and -360-degree phase shifts, illustrating why high-order systems require careful stability analysis.
Related Micro-courses